검색 전체 메뉴
PDF
맨 위로
OA 학술지
한강 및 낙동강 수계 주요 하천을 중심으로 어류를 이용한 수생태 건강성 평가 Ecological Health Assessment using Fish for the Han River and Nakdong River in Korea
ABSTRACT

The present study was carried out to develop biological criteria for aquatic ecosystem health assessment using composition and diversity of collected species. The sampling sites were a total of 67 sites in the Han River (29 sites) and the Nakdong River (38 sites), May and September 2012. During the survey period fish were collected totally 93 species. In each water system, 73 and 61 species were collected in the Han River and the Nakdong River respectively. The current composition of fish species between the Han River and Nakdong River showed similar pattern. The dominant species was Zacco platypus of the Han River, and the Nakdong River was Opsariichthys uncirostris. In particular, ecological characteristics of O. uncirostris frequently appeared in general polluted waters. In conclusion, in the Nakdong River, average value of FAI (Fish Assessment Index) was averaged 41.3, indicating a “poor condition”, and the Han River was 53.1, indicating a “poor condition”. The aquatic health of the Nakdong River assessed based on FAI was considered to be worse than that of the Han River.


KEYWORD
Ecological Health Assessment , FAI (Fish Assessment Index) , Freshwater Fish , Han River , Nakdong River
  • 1. Introduction

    선진국에서는 오래전부터 수자원의 건강성 유지 및 회복을 위한 관리목표를 설정하고 이를 실행하기 위하여 수질에 대한 생물학적 평가체계를 운영해 오고 있다. 특히 미국에서는 1981년부터 다변수 모델을 개발하여 수생태계 보전과 관리연구에 활용하고 있다. 수생 생물을 이용한 수생태 건강성 평가 기법 중 어류의 생물지수는 대표적으로 다변수 분석(Multi-metric Analysis) 방법을 이용하며 이는 12개의 변수를 기반으로 하여 생물지수를 산출하는 방식이다(Barbour et al., 1999; Karr, 1981). 국외에서 생물지수 산출을 위해 이용된 변수는 12개로 M1: 총종수(Total number of fish species), M2: Darter 혹은 저서성 어류의 종수(Number of darter species), M3: 소에 거주하는 종수(Sunfish), M4: 장수하는 어류의 종수(Long-lived species, 혹은 Sucker 종), M5: 민감종수(Number of intolerant species), M6: 내성종수(Number of tolerant species), M7: 잡식종 어종의 개체수 비율(Proportion of individuals as omnivore), M8: 충식성 어종의 개체수 비율(Proportion of individuals as insectivore), M9: 국내 육식어종의 개체수 비율(Proportion of individuals as native carnivore), M10: 총개체수(Total number of individuals), M11: 외래종(혹은 교잡 종)의 비율, M12: 질병 및 비정상성 어류의 비율(Proportion with disease/ abnormality)의 메트릭 이 이용된다.

    우리나라에서도 생물학적 수질평가지표개발을 위하여 환경부에서는 법률을 제정하였으며(수질및수생태계보전에관한 법률, 2007. 4), 이에 따라 환경부에서는 수질측정망의 중권역 대표지점을 포함한 전국 하천을 대상으로 2008년부터 2012년까지 부착조류, 저서성 대형무척추동물, 어류, 서식 및 수변환경을 중심으로 수생태계 건강성 평가를 위한 지표 개발을 수행하였다(MOE and NIER, 2008; 2009; 2010; 2011; 2012). 어류를 이용한 평가지수는 다변수 분석인 12개의 변수를 기반으로 우리나라 하천 특성에 맞게 총 8개의 메트릭을 확립하여 어류평가지수(Fish Assessment Index, FAI)를 산정하였다(MOE and NIER, 2012).

    우리나라 하천・호수(유구천, 강릉남대천, 태화강, 충주호 등) 등을 대상으로 어류를 이용한 생물학적 생태 건강성 평가에 관한 연구는 지속적으로 수행되어 왔다(An et al., 2001; An and Lee, 2006; Bae et al., 2008; Choi et al., 2007; Choi et al., 2012; Jeon et al., 2010; Kim and An, 2010; Kwon and An, 2006; Lee et al., 2007; Song et al., 2005; Yeom et al., 2000). 하지만 특정 하천에 대한 생태 건강성 평가로 국한되어 있으며 향후 생물학적 건강성 평가지표의 정책적 활용성을 위하여 전체 수계에 대한 생물학적 건강성 평가 연구는 필요할 것으로 판단된다.

    따라서 본 연구에서는 환경부에서 주관한 수생태계 건강성 조사 평가 사업을 수행하면서 생산된 결과를 이용하여 어류를 대상으로 한강 및 낙동강 수계 주요 하천별 어류의 분포 현황, 각 생물군이 갖는 생태 특성(내성도, 섭식 특성)등을 반영하여 한강 및 낙동강의 수생태 건강성을 평가하였으며 이러한 연구결과는 향후 수생태계 관리 방안의 기초 자료로 활용될 수 있을 것이다.

    2. Materials and Methods

       2.1. 조사 지점, 시기 및 군집분석법

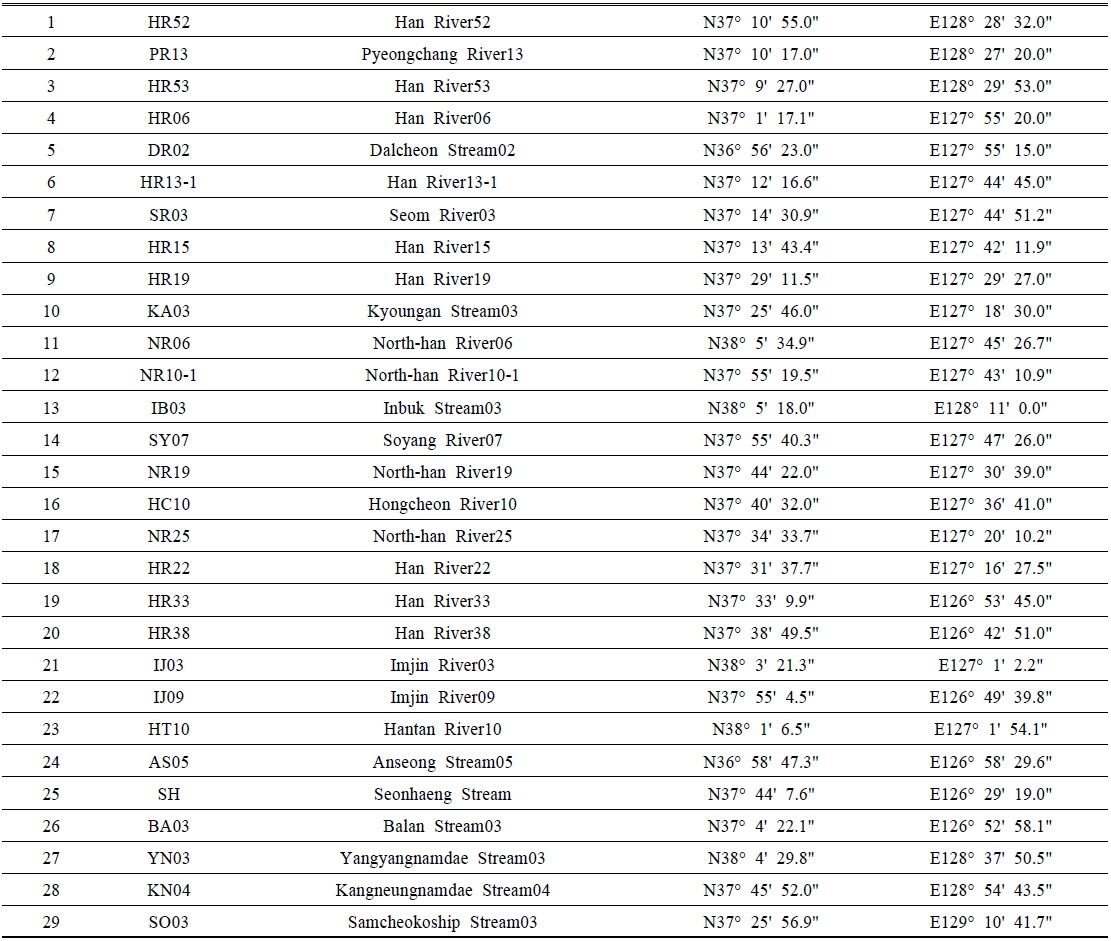
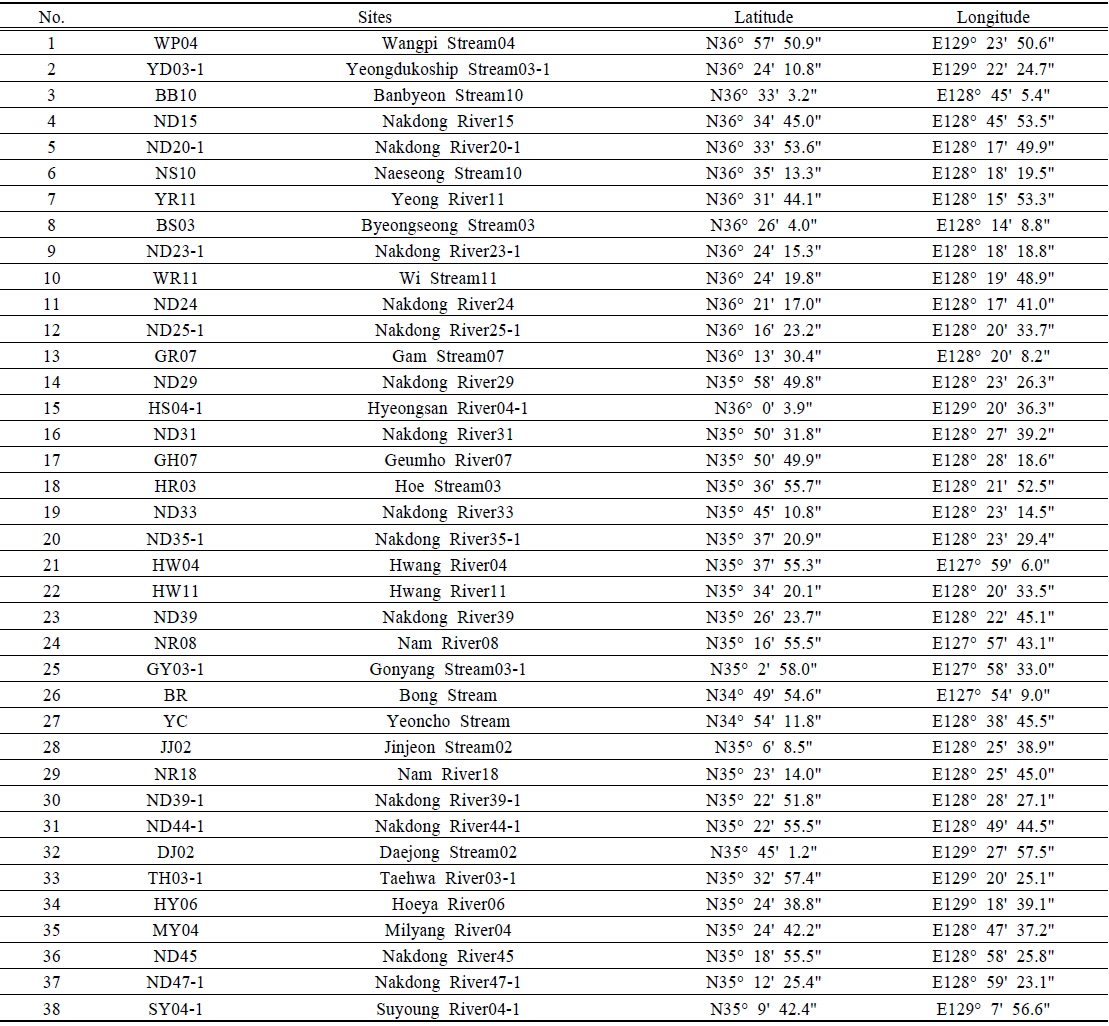
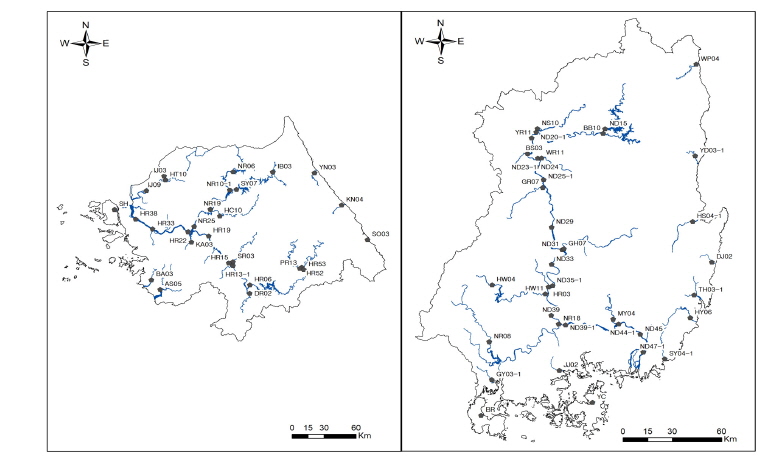
    ‘수질측정망 운영계획’(MOE, 2008)에 의거하여 Table 1과 같이 2012년 우리 나라 한강 및 낙동강 수계 주요 하천 총 67 지점(한강 29 지점, 낙동강 38 지점)을 대상으로 수행하였다(Fig. 1; Table 1, 2). 조사 시기는 홍수기 전후로 년 2회 조사하였으며(봄철 : 4 ~ 5월, 가을철 : 9 ~ 10월), 어류 채집 구간은 조사 지점에서 상・하류 간 총 200 m 구간 으로 여울(Riffle), 소(Pool), 유속이 느린 구간(Run)이 존재 하는 구간에서 투망(망목 5 × 5 mm), 족대(망목 4 × 4 mm)를 이용하여 채집 후 어류의 정성 및 정량분석을 실시하였다(MOE and NIER, 2012).

    [Table 1.] GPS information of study sites the Han River.
    label

    GPS information of study sites the Han River.

    [Table 2] GPS information of study sites the Nakdong River
    label

    GPS information of study sites the Nakdong River

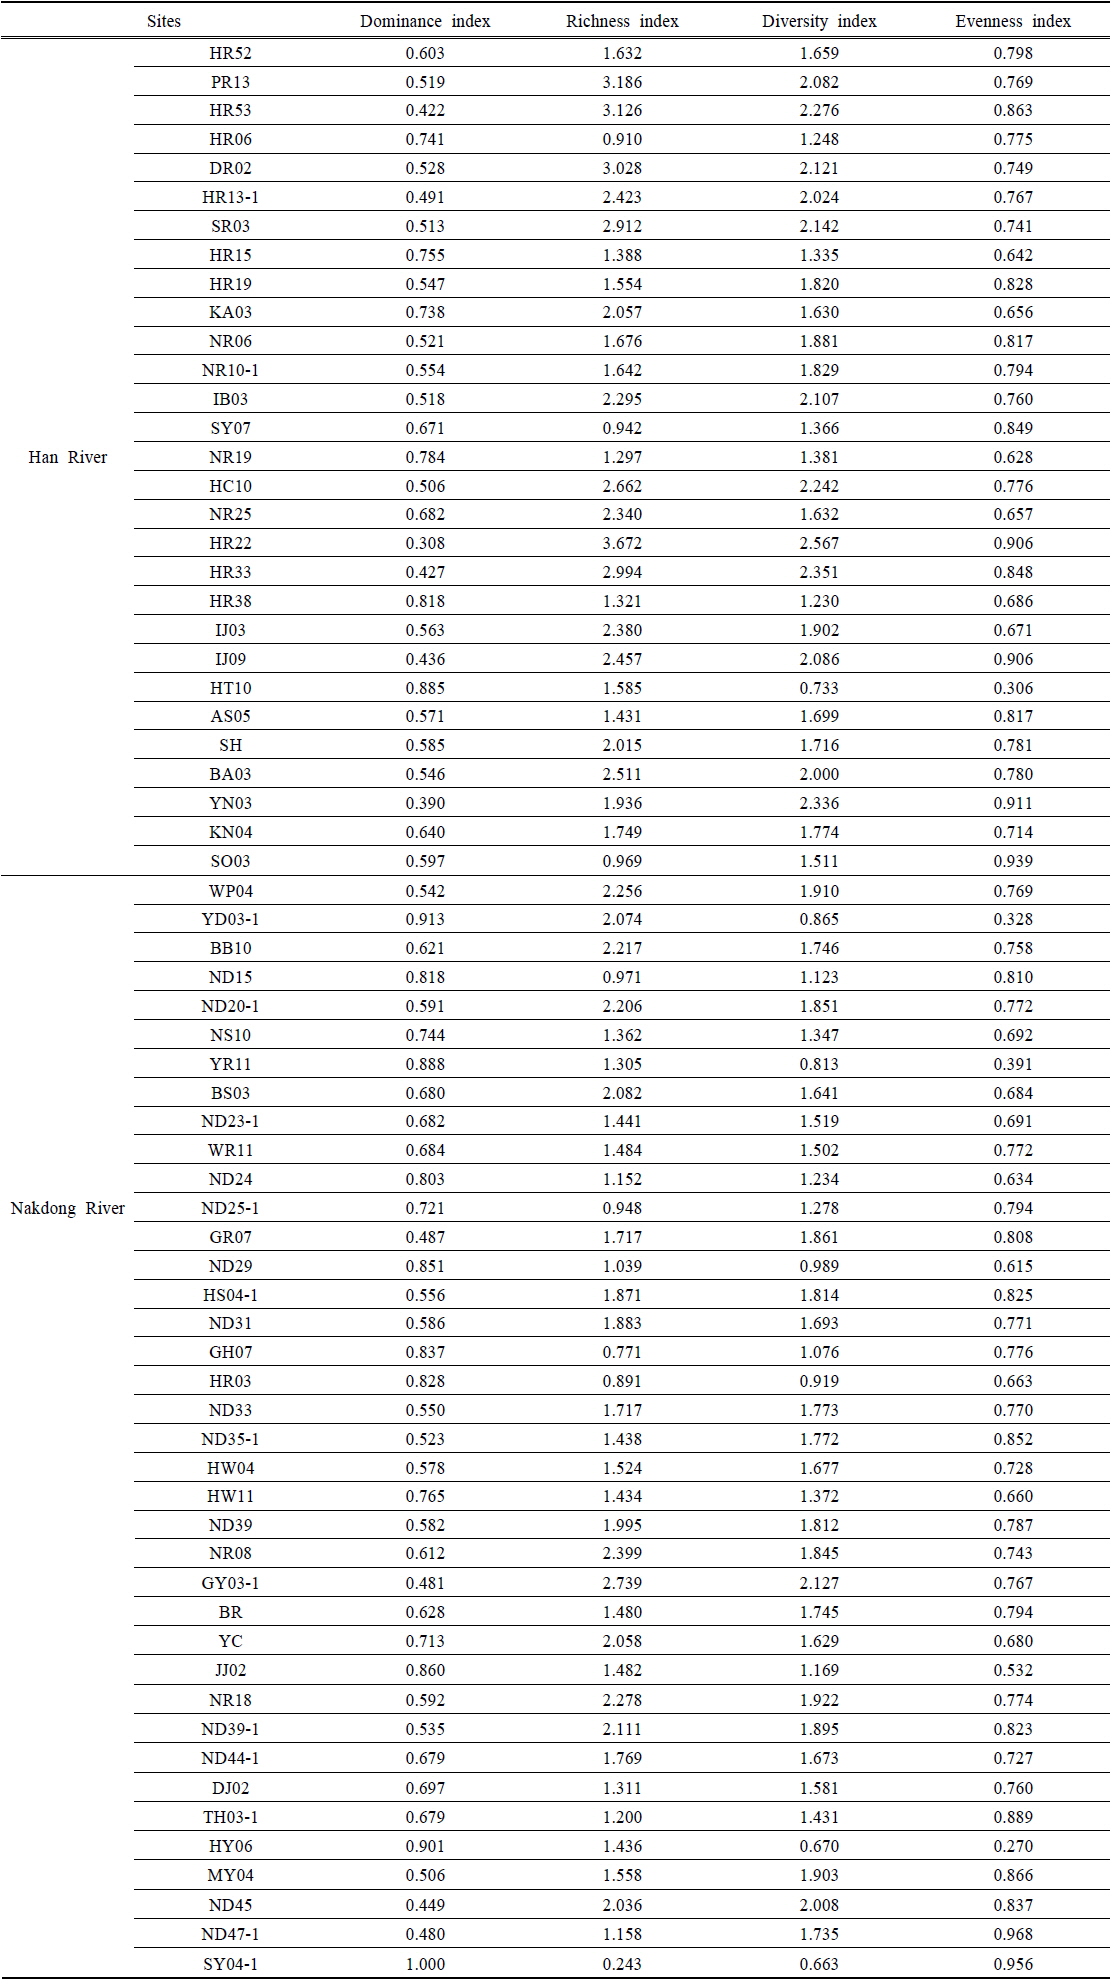
    어류의 군집구조를 파악하기 위하여 지점별 어류 출현 개체수와 출현 종수를 이용하여 우점도 지수(Dominance Index)(Simpson, 1949), 종 다양도 지수(Diversity Index)(Shannon and Weaver, 1963), 종 균등도 지수(Evenness Index)(Pielou, 1975), 종 풍부도 지수(Richness Index)(Margalef, 1958)를 산출하였다.

       2.2. 수생태계의 건강성 평가를 위한 지수산정방법

    어류를 이용한 어류평가지수(FAI)는 생태건강성 메트릭 모델을 이용하여 산정하였다. 어류의 메트릭 모델값은 개체수, 출현 종수 및 생태지표 특성 등을 고려하여 계산하였으며 어류의 생태지표 특성은 내성도 특성 및 섭식 특성을 분석하여 산출하였다(MOE and NIER, 2006). 이 중 내성도 특성 분석은 채집된 어종을 대상으로 수질 오염도에 따라 쉽게 사라지는 민감종(Sensitive species, SS), 수질 오염도에 내성을 갖는 내성종(Tolerant species, TS) 및 두 범주(민감종 및 내성종)에 속하지 않는 중간종(Intermediate species, IS)으로 구분하였다. 또한 섭식 특성은 잡식종(Omnivores, O), 충식종(Insectivores, I), 육식종(Carnivores, C) 및 초식종(Herbivores, H)으로 구별 하여 분석하였다.

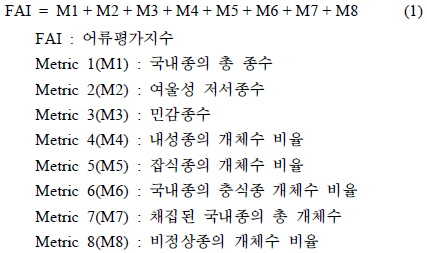
    어류의 생태건강성 메트릭 모델 분석은 U. S. EPA (1993)의 기준에 의거하여 우리나라 지리적 특성 및 생태 특성에 적합하도록 재정립된 8개의 메트릭을 이용하여 산출하였다. M1 : 국내종의 총 종수(Total number of native fish species), M2 : 여울성 저서종수(Number of riffle-benthic species), M3 : 민감종수(Total number of sensitive species), M4 : 내성종의 개체수 비율(Proportion of individuals as tolerant species), M5 : 잡식종의 개체수 비율(Proportion of individuals as omnivores), M6 : 국내종의 충식종 개체수 비율(Proportion of individuals as native insectivores), M7 : 채집된 국내종의 총 개체수(Total number of individuals), M8 : 비정상종의 개체수 비율(Proportion of individuals as abnormal individuals)의 총 8개 메트릭에 대해 각각 “0”, “6.25”, “12.5”의 점수를 부여하였으며 모든 메트릭 합으로 생물지수 등급을 산정하였다(식 (1))(MOE and NIER, 2012).

    image

       2.3. 수생태 건강성 평가 등급

    어류를 이용한 수생태계 평가등급은 현재 ‘수질 및 수생태계 상태별 생물학적 특성 이해표’에서 구분한 등급구분과 동일하게 4단계로 87.5 ~ 100은 “최상(A등급; Excellent)”, 56.2 ~ 87.4는 “양호(B등급; Good)”, 25.0 ~ 56.1은 “보통(C등급; Fair)”, 0 ~ 24.9는 “불량(D등급; Poor)”으로 구분하였다(MOE and NIER, 2012). 각 생물군에 따른 등급별 생물지수는 수치가 높을수록 오염이 진행되지 않은 청정한 수계를 의미하고 수치가 낮을수록 오염이 심한 수계를 의미한다.

    3. Results and Discussion

       3.1. 어류 종조성 및 분포 현황

    한강 및 낙동강 수계의 조사대상 총 67 지점(한강 29 지점, 낙동강 38 지점)에서 출현된 어류는 1강 11목 22과 59속 93종으로 조사되었다.

    한강 수계 조사 지점에서 서식하는 어류를 살펴보면 53속 73종으로 평균 12종을 보였고 Seom River03 지점(섬강중권역), Hong Cheon River10 지점(홍천강 중권역)에서 18종으로 가장 풍부한 종조성을 보였다(Fig. 2). 낙동강 수계조사 지점에서의 어류의 종조성은 42속 61종이었으며 평균 9종이 출현하였다. 지점별 출현 양상은 Gonyang Stream 03-1 지점에서 16 종으로 가장 많은 어종의 출현을 보였으며(Fig. 3), 한강 및 낙동강 수계에 출현하는 어종의 종조성은 큰 차이를 보이지 않았다.

    한강 수계 주요 하천에서 서식하는 어류의 출현 개체수는 평균 244 개체였으며 Imjin River09(임진강 하류 중권역) 지점에서 39 개체로 가장 적었으며 Imjin River03(임진강 상류 중권역) 지점에서 831 개체로 가장 많은 출현 개체수를 보였으며(Fig. 2), 우점종은 넓은 생태 범위를 갖는 Zacco platypus(피라미)로 나타났다. 낙동강 수계 주요 하천에서는 평균 191 개체로 나타났고 Nakdong River15(안동댐하류 중권역)에서 22 개체로 가장 적었고 Hoeya River06(회야강 중권역)에서 2,121 개체로 가장 많은 개체수를 나타냈으며(Fig. 3) 주변 식생대 형성 부족, 인공제방, 오염원 유입 등에 의한 어류 서식지 악화에 따라 하류 지점에서 다소 낮은 출현 개체수를 나타냈다.

    멸종위기야생생물 Ⅰ급으로 지정된 어종은 한강에서는 출현하지 않았으며 낙동강에서는 Gobiobotia nakdongensis(흰수마자)가 Nakdong River20-1(1 개체), Gam Stream07 지점에서(12 개체) 출현하였다. 멸종위기야생생물 Ⅱ급에 해당하는 종은 한강에서 Pseudopungtungia tenuicorpa(가는돌고기, 27 개체), Pungitius sinensis(가시고기, 17 개체), Gobiobotia macrocephala(꾸구리, 21 개체), Gobiobotia brevibarba(돌상어, 19 개체), Acheilognathus signifer(묵납자루, 3 개체), Cottus hangiongensis(한둑중개, 25 개체)가 출현하였으며, 낙동강에서는 Cottus hangiongensis가 Wangpi Stream04 지점에서 7 개체 출현하였다. 비정상 개체는 한강 및 낙동강 지점 모두 출현하지 않았다.

    생태계교란 생물로 지정된 Micropterus salmoides(배스)와 Lepomis macrochirus(블루길)의 출현은 한강 수계에서는 M. salmoides가 41 개체, L. macrochirus가 45 개체 출현하였고 낙동강 수계에서는 M. salmoides가 183 개체(2.5%), L. macrochirus가 167 개체(2.3%)로 한강 수계에 비하여 높은 출현을 보였다. 또한 M. salmoides와 L. macrochirus 은 잡식성으로 동・식물 플랑크톤, 조개, 새우, 수서곤충, 작은 어류, 어란 등 다양한 먹이를 섭식하는 종으로 알려져 있어(Byeon et al., 1997; Choi et al., 2012) 높은 포식압에 의한 수생태계 교란에 영향을 미칠 것으로 판단되며 낙동강 수계에서 생태계교란 생물 분포 및 관리에 대한 면밀한 연구가 필요할 것으로 사료된다.

       3.2. 우점종

    한강 및 낙동강 수계 전체 67개 지점 중 34개 지점에서 Zacco platypus가 우점종으로 나타나 가장 높은 누적우점빈도를 보였으며, Opsariichthys uncirostris, Squalidus chankaensis도 높은 누적우점빈도를 나타내었다(Table 3).

    주요 하천별 어류의 우점종을 조사한 결과, 한강에서는 Zacco platypus가 21개 지점에서 우점하여 가장 높은 누적우점 빈도를 보였다(Table 3). Zacco platypus은 우리나라에 가장 넓은 생태 범위를 갖는 종으로 주로 부착 조류를 섭식하는 잡식성 어종이다(Kim et al., 2005). 낙동강에서는 Opsariichthys uncirostris가 19개 지점에서 우점하여 가장 높은 누적우점빈도를 보였으며, 이 종은 수서곤충, 작은 어류 등을 섭식하는 육식성 종이며, 중・하류에 출현하는 종들로서 오염된 하천에서도 내성을 갖는 종으로(Choi et al., 2012; Kim et al., 2005) 알려져 있다.

    [Table 3.] The dominant species and sub-dominant species of fish in Han River and Nakdong River (Parenthesis : the number of accumulation dominant frequency).

    label

    The dominant species and sub-dominant species of fish in Han River and Nakdong River (Parenthesis : the number of accumulation dominant frequency).

       3.3. 어류의 군집 분석

    어류를 이용한 군집 분석 결과 한강 수계에서 우점도 지수(Dominance index)는 Hantan River10지점에서 0.885로 최대값을 보였으며 다양도 지수(Diversity index)와 균등도 지수(Evenness index)는 각각 0.733, 0.306으로 최소값을 보였다(Table 4). 이와 같은 결과는 Hantan River10지점에서 Zacco platypus가 83% 이상(459 개체)의 높은 우점에 의한 영향으로 판단된다. 최저 우점도 지수는 Han River22 지점(0.308)으로 나타났으며 이 지점의 풍부도 지수(Richness index)(3.672) 및 다양도 지수(2.567)는 최대값을 보여 우점도 지수와 풍부도 및 다양도 지수는 반비례 관계를 보여주었다.

    낙동강 수계에서 우점도 지수는 Tridentiger obscurus(62% 이상), Mugil cephalus(37% 이상) 2 종만이 출현한 Suyoung River04-1 지점에서 1.000로 최대값을 보였고 풍부도 지수 및 다양도 지수는 각각 0.243, 0.663으로 최소값을 보여 한강 수계와 동일하게 우점도 지수 및 풍부도, 다양도 지수 간에는 반비례 관계를 나타내었다(Table 4).

    [Table 4.] Diversity index of Han River and Nakdong River.
    label

    Diversity index of Han River and Nakdong River.

       3.4. 어류의 생태 지표 특성

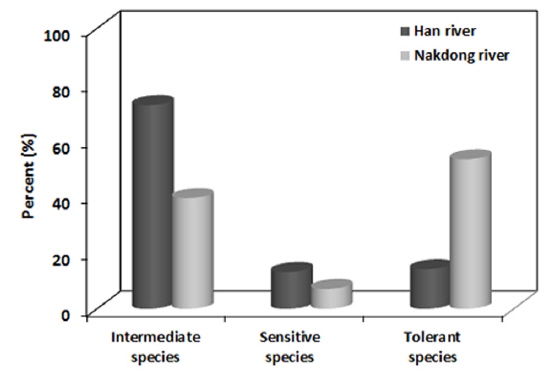
    어류의 내성도에 따른 조사 결과를 살펴보면 한강 주요 하천에서는 총 7,073 개체가 채집되었으며 중간종이 가장 풍부하게 서식하는 것으로 조사되었고(5,141 개체, 72.7%), 낙동강 주요 하천에서는 채집된 총 7,248 개체 중 내성종이 주로 서식하는 것으로 나타나(3,867 개체, 53.4%) 한강, 낙동강 수계 간의 내성도 특성은 차이를 보여주었다(Fig. 4). 하천 생태계 내 유기물 증가, 수환경 변화 등은 내성종 을 증가시킨다고 보고되고 있으며(Barbour et al., 1999), Choi et al. (2007)은 낙동강 수계 상류에서 하류로 갈수록 내성종의 개체수가 증가하며 이는 수생태계 교란을 반영해 주고 있다고 연구되었다. 이와 같은 결과를 비추어 볼 때 본 연구에서 한강 수계보다 낙동강 수계에서 내성종 출현이 높게 나타나 한강 수계가 낙동강 수계보다 수생태 건강성이 양호한 상태인 것으로 시사하였다

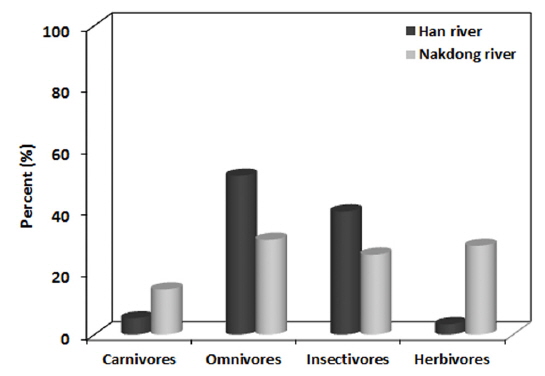
    섭식 특성에 따른 분류 결과 한강 수계 주요 하천에서는 잡식종(3,639 개체, 51.5%)과 충식종(2,820 개체, 39.9%)이 대부분을 차지하였다. 반면, 낙동강 수계 주요 하천에서는 잡식종(30.7%), 초식종(28.8%), 충식종(25.9%)은 비슷한 출현빈도를 나타냈으며 상대적으로 육식종(14.6%)의 분포는 적게 나타났다(Fig. 5).

       3.5. 수생태계 건강성 평가

    한강 및 낙동강 수계 주요 하천을 대상으로 어류평가지수(FAI)를 이용한 수생태계 건강성 평가 결과, 한강 수계 주요 하천에서는 Anseong Stream05, Balan Stream03 지점이 최소값(15.7), Inbuk Stream03, Yangyangnamdae Stream03 지점에서 90.7로 최고값을 나타냈으며 평균 53.2(C 등급, 보통)로 나타났다. 평가 등급별 결과는 C 등급(보통)이 14 지점(48.3%)으로 가장 많았으며, B 등급(양호)이 9 지점(31.0%), A 등급(최상)이 4 지점(13.8%), D 등급(불량)이 2 지점(6.9%) 순으로 나타났다(Fig. 6). 낙동강 수계 주요 하천에서는 Nakdong River15 지점에서 15.7로 최소값을, Jinjeon Stream02 지점에서 81.3으로 최고값을 나타냈으며 평균 41.3(C 등급, 보통)으로 나타났다. 평가 등급별 결과는 총 38 지점 중 29 지점(76.3%)이 C 등급(보통)으로 가장 많았으며 B 등급 5 지점(13.2%), D 등급 4 지점(10.5%), A 등급 0 지점(0.0%) 순으로 나타나(Fig. 7), 어류평가지수 결과 한강 수계가 낙동강 수계 보다 건강성이 양호한 것으로 평가되었다.

    4. Conclusion

    한강과 낙동강 수계의 주요 하천을 중심으로 어류상 조사 및 어류를 이용한 수생태계 건강성 평가결과는 다음과 같다.

    한강 및 낙동강 수계 주요하천 총 67 지점(한강 29 지점, 낙동강 38 지점)에 대하여 2012년 봄철, 가을철에 걸쳐 조사하였으며 한강 수계에서는 53속 73종, 낙동강 수계에서는 42속 61종으로 총 출현한 어류는 59속 93종으로 조사되었다. 주요 하천별 어류 출현 개체수는 한강 수계에서 평균 244 개체를, 낙동강 수계에서 평균 191 개체로 한강 수계가 낙동강 수계 보다 풍부한 개체수를 보여주었다. 낙동강 하류 지점에서는 주변 식생 분포 부족, 인공제방, 오염원 유입 등 어류 서식지 악화의 영향으로 다소 낮은 출현 개체수를 나타냈다. 각 수계에서 출현한 주요종을 살펴보면 한강 수계에서는 Zacco platypus였으며 낙동강 수계에서는 Opsariichthys uncirostris로 나타났다. 이 O. uncirostris종의 생태적 특성은 수서곤충, 작은 어류 등을 섭식하는 육식성 종이며, 중・하류에 출현하는 종들로서 낙동강 수계에서는 오염된 하천에 서식하는 종이 높은 출현을 보였다. 어류를 이용한 수생태계 건강성 평가 결과 한강 수계에서 메트릭 값은 평균 53.1로 보통의 건강상태를 보였으며 등급별 분포는 B등급과 C등급이 약 80% 평가되었고 A 등급은 약 14%를 나타냈다. 낙동강 수계에서는 평균 41.3의 메트릭 값을 보여 한강 수계보다 다소 낮은 값을 나타냈으며, 등급별 분포는 C등급이 75% 이상으로 가장 많이 평가되었고 A등급은 나타나지 않았다. 이와 같은 결과 한강 수계가 낙동강 수계보다 수생태 건강성이 다소 양호한 상태를 보이는 것으로 판단된다.
참고문헌
  • 1. An K. G., Jung S. H, Choi S. S. 2001 An Evaluation on Health Conditions of Pyong-Chang River using the Index of Biological Integrity (IBI) and Qualitative Habitat Evaluation Index (QHEI) [Korean Journal of Limnology] Vol.34 P.153-165 google
  • 2. An K. G., Lee E. H. 2006 Ecological Health Assessments of Yoogu Stream using a Fish Community Metric Model [Korean Journal of Limnology] Vol.39 P.310-319 google
  • 3. Bae D. Y., Kim Y. P., An K. G. 2008 Ecological Health Assessment of Mountainous Stream in Mt. Sik-Jang using Multi-metric Models [Journal of Korean Society on Water Environment] Vol.24 P.156-163 google
  • 4. Barbour M. T., Gerritsen J., Snyder B. D., Stribling J. B. 1999 Rapid Bioassessment Protocols for us.e in Streams and Wadeable Rivers: Periphyton, Benthic Macroinvertebrates and Fish google
  • 5. Byeon H. G., Song H. B., Jeon S. R., Son Y. M. 1997 Feeding Habit of Bluegill, Lepomis macrochirus, Introduced at Lake Paldang [Korean Journal of Limnology] Vol.30 P.75-84 google
  • 6. Choi J. W., Lee E. H., Lee J. H., An K. G. 2007 Biological Water Quality Assessments Using Fish Assemblage in Nakdong River Watershed [Korean Journal of Limnology] Vol.40 P.254-263 google
  • 7. Choi M. J., Park H. K., Yun S. H., Lee J. H. 2012 Fish Community and Stream Health Assessment in Lake Chungju and its Tributaries [Journal of Korean Society on Water Environment] Vol.28 P.185-196 google
  • 8. Jeon D. Y., Lee S. L., Son J. W., Cha Y. U., Kwon K. W., Yoo P. J. 2010 Aquatic Ecosystem Health Assessment in Middle Reach of Suyoung River using Characteristics of Benthic Macroinvertebrate and Fish Fauna [Journal of Korean Society on Water Environment] Vol.26 P.934-942 google
  • 9. Karr J. R. 1981 Assessment of Biotic Integrity using Fish Communities [Fisheries] Vol.6 P.21-27 google cross ref
  • 10. Kim I. S., Choi Y., Lee C. L., Lee Y. J., Kim B. J., Kim J. H. 2005 Illustrated Book of Korean Fishes P.131 google
  • 11. Kim Y. P., An K. G. 2010 Characteristics of Physicochemical Water Quality Characteristics in Taehwa-river Watershed and Stream Ecosystem Health Assessments by a Multimetic Fish Model and Community Analysis [Korean Journal of Limnology] Vol.43 P.428-436 google
  • 12. Kwon Y. S., An K. G. 2006 Biological Stream Health and Physico-chemical characteristics in the Keum-ho River watershed [Korean Journal of Limnology] Vol.39 P.145-156 google
  • 13. Lee J. H., Hong Y. P., An K. G. 2007 Fish Community Structure Analysis and Ecological Health Assessments in the Headwater Watershed of Nakdong River [Korean Journal of Limnology] Vol.40 P.403-411 google
  • 14. Margalef R. 1958 Information Theory in Ecology [General Systematics] Vol.3 P.36-71 google
  • 15. 2006 Survey of Water Quality Comprehensive Assessment Methods (III) google
  • 16. 2008 Water Quality Monitoring Program, google
  • 17. 2008 Waterwide Aquatic Ecological Monitoring Program (I) google
  • 18. 2009 Waterwide Aquatic Ecological Monitoring Program (II) google
  • 19. 2010 Waterwide Aquatic Ecological Monitoring Program (III) google
  • 20. 2011 Waterwide Aquatic Ecological Monitoring Program (IV) google
  • 21. 2012 Waterwide Aquatic Ecological Monitoring Program (V) google
  • 22. Pielou E. C. 1975 Ecological diversity P.165 google
  • 23. Shannon C. E., Weaver W. 1963 The Mathematical Theory of Communication P.177 google
  • 24. Simpson E. H. 1949 Measurement of Diversity [Nature] Vol.163 P.688 google cross ref
  • 25. Song H. B., Baek H. M., Lee C. W. 2005 Water Environmental Assessment by the Species Biotic Index of Freshwater Fish in the Namdaecheon, Gangneung City [Environmental Impact Assessment] Vol.14 P.237-245 google
  • 26. 1993 Fish Field and Laboratory Methods for Evaluating the Biological Integrity of Surface Waters google
  • 27. Yeom D. H., An K. G., Hong Y. P., Lee S. K. 2000 Assessment of an Index of Biological Integrity (IBI) using Fish Assemblages in Keum-Ho River, Korea [Korean Journal Environment Biology] Vol.18 P.215-226 google
이미지 / 테이블
  • [ Fig. 1. ]  Map showing the sampling sites (Left : Han River, Right : Nakdong River).
    Map showing the sampling sites (Left : Han River, Right : Nakdong River).
  • [ Table 1. ]  GPS information of study sites the Han River.
    GPS information of study sites the Han River.
  • [ Table 2 ]  GPS information of study sites the Nakdong River
    GPS information of study sites the Nakdong River
  • [ ] 
  • [ Fig. 2. ]  Number of species and individuals at each study site in the Han River.
    Number of species and individuals at each study site in the Han River.
  • [ Fig. 3. ]  Number of species and individuals at each study site in the Nakdong River.
    Number of species and individuals at each study site in the Nakdong River.
  • [ Table 3. ]  The dominant species and sub-dominant species of fish in Han River and Nakdong River (Parenthesis : the number of accumulation dominant frequency).
    The dominant species and sub-dominant species of fish in Han River and Nakdong River (Parenthesis : the number of accumulation dominant frequency).
  • [ Table 4. ]  Diversity index of Han River and Nakdong River.
    Diversity index of Han River and Nakdong River.
  • [ Fig. 4. ]  Tolerance guild in the Han and Nakdong River.
    Tolerance guild in the Han and Nakdong River.
  • [ Fig. 5. ]  Trophic guild in the Han and Nakdong River.
    Trophic guild in the Han and Nakdong River.
  • [ Fig. 6. ]  Fish assessment index (FAI) in the Han River.
    Fish assessment index (FAI) in the Han River.
  • [ Fig. 7. ]  Fish assessment index (FAI) in the Nakdong River.
    Fish assessment index (FAI) in the Nakdong River.
(우)06579 서울시 서초구 반포대로 201(반포동)
Tel. 02-537-6389 | Fax. 02-590-0571 | 문의 : oak2014@korea.kr
Copyright(c) National Library of Korea. All rights reserved.