It is highly important for satellite operators to maintain consistent ephemerides. To this end, each operator independently obtains observation data by communicating with its satellite or operates additional receivers or observatories. Lee et al. (2011) conducted a simulation to determine the ideal location for a ground station for the Communication, Ocean and Meteorological Satellite (COMS), which revealed that the observation data from multiple locations could improve the precision of a determined satellite orbit. In the case of optical observatory, locations are limited to within South Korea; however, it may be highly efficient to arrange observatories based on the difference in adequate baseline distances to obtain the optimized ephemeris outcomes.
Son et al. (2015) performed a simulation reflecting the effects of the differences in baseline distances between ground stations on the optical determination of the orbits of Geostationary Earth Orbit (GEO) satellites optically. To determine the effect of the baseline distances between multiple optical observatories, we require orbit estimation results with actual observation data from those observatories over the simulation results, as shown in Son et al. (2015). Furthermore, these orbit estimation results can validate the simulation of the effect of baseline on the GEO satellite orbit estimation with optical observation from multiple observatories.
In this study, we show that the orbit estimation results obtained using actual optical observation data were affected by the baseline distances between observatories. We considered actual observation data from the 61-cm telescope of the Sobaeksan Optical Astronomy Observatory (SOAO), the Optical Wide field Patrol (OWL) 50-cm telescope of the National Agenda Project (NAP) team at the Korea Astronomy and Space Science Institute (KASI), and the 60-cm wide field telescope operated by the Chungbuk National University Observatory (CNUO). Among these, the telescopes used at the SOAO and CNUO were dedicated for astronomical observation. As such, most optical telescopes used in Korea for satellite observation are astronomical telescopes, and only a limited number among them are actually suitable for satellite observation. Sidereal tracking, which allows stars and moving satellites to be observed as dots and lines, respectively, was used to identify satellites efficiently when observing GEO satellites (Choi et al. 2009). To obtain as many observation images as possible during the given observation time, an observation was performed every minute. With this optical observation data, we performed several correction procedures to compensate for geometric distortion, shutter speed delay, electronic circuit delay, aberration, and light-travel time (Choi et al. 2011). To show the effect of baseline on the results of orbit estimation, multiple combinations of three observatories were selected. The optical observation data sets obtained from these combinations were processed and compared in radial, intrack, and cross-track (RIC) components.
The following section explains the characteristics of the observation systems used, the optical observatories, and the equipment used for observation. Also explained are the results of optical observation and the processes of observational data reduction used for orbit estimation. The last section presents a comparison of the results of simulation and those of orbit estimation from optical observation data performed using the Orbit Determination Tool Kit (ODTK). In addition, a comparison was made with the orbit ephemeris used by satellite operators.
2. OPTICAL OBSERVATION OF ARTIFICIAL SATELLITE
In this study, we considered actual observation data from telescopes at three observatories, the SOAO, OWL test-bed, and CNUO, to observe a GEO satellite. The first telescope is a 61-cm-diameter astronomical-observation telescope at the SOAO. A charge coupled device (CCD) camera (PL16803 model produced by Finger Lakes Instrumentation) was used for capturing observational images. The field of view (FOV) of the 61-cm telescope used at the SOAO was 15.2 × 15.2 arcmin. The second is a 50-cm telescope installed at the OWL test-bed; we captured images from this telescope using a CCD camera of the same type. The FOV of the OWL test-bed telescope was 1.11 × 1.11 degrees. The third telescope used in this study was a wide-field telescope of 60-cm diameter at CNUO located in Jincheon; another type of CCD camera (STX model) was used for capturing observational images. The FOV of the CNUO telescope was 1.2 × 1.2.
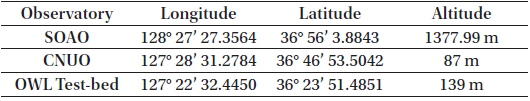
The locations of the observatories used in this study are listed in Table 1. The baseline distances were 45 km, 89 km, and 113 km between the OWL test-bed and the CNUO, the CNUO and the SOAO, and the SOAO and the OWL test-bed, respectively.
[Table 1.] Positions of the optical observatories.

Positions of the optical observatories.
The optical observation of the COMS was conducted during a 166 day campaign from August 1, 2014, to January 13, 2015. The observation was planned to be conducted simultaneously at the three observatories. However, it was difficult to conduct observations at all three observatories during the actual observation period because of the summer climate in South Korea, in which phenomena such as cloud cover and fog are subject to the topographical characteristics and geographical locations of the stations. During the campaign, the SOAO was secured for 35 days for observation through an observation proposal, but observation on many of those days was limited because of the climate conditions between August and January. Cloud cover was a particularly frequent obstacle, probably because of the altitude above sea level of nearly 1,400 m and the influence of the surrounding lakes. Consequently, observation was successful only on 9 days. The exposure time was set at 5 sec for observation.
The OWL test-bed has no geometric obstacles for approximately 20° altitude. However, it was difficult to adjust the exposure owing to the station’s proximity to the city center of Daejeon, the bright lights from which affected observation. In addition, as the station is situated in an inland area, the objects of observation were often shielded by weather conditions or low-altitude clouds, preventing smooth observation and directly affecting observation results. During the observation campaign, the OWL test-bed system successfully completed observation on a total of 12 days, but only half of these days yielded 100 data points or more. To facilitate the verification of satellites, the exposure time was configured as 2 sec for observation.
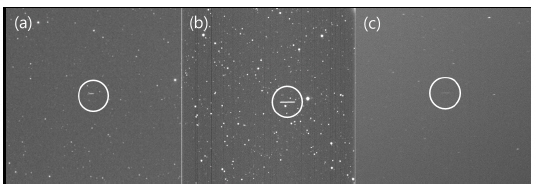
Topographically, the CNUO system does not have high-rising obstacles, but observation was frequently limited owing to cloud cover and other weather conditions. Furthermore, observation was suspended during a maintenance period of the telescope mount necessitated by its unexpected breakdown. After the maintenance work was completed, observation was resumed in January 2015, but actual observation was conducted on only 5 days, excluding the days of poor climate conditions. The CNUO system also maintained an exposure time of 2 sec. Fig. 1 shows the images obtained from the three stations at 15:17:000 (UTC) on January 12, 2015.
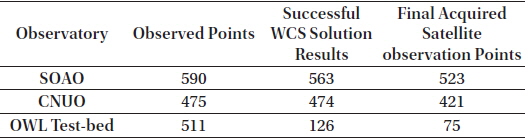
Although the COMS, a GEO satellite, can be observed from South Korea at all times, observation was possible only on a limited number of days at each observatory, as mentioned previously. On January 12, 2015, however, observation was possible at all three observatories. This study performed orbit determination by using the data from this day. The observation results of each station are provided as “Observed Points” in the second column of Table 2. “Successful WCS Solution Results” in the third column of Table 2 refers to the number of satellites successfully observed, and “Final Acquired Satellite Observation Points” in the fourth column of Table 2 refers to the number of satellites verified by the naked eye among the “Successful WCS Solution Results”.

Total number of observation points and number of usable observation points from raw observation and data processing (unit: points).
3. PROCESSING OF OPTICAL OBSERVATION DATA
The optical observation data were processed as shown in Fig. 2. As the median right ascension and declination (RA & DEC) data used for observation were not recorded in the file containing the observation results at the SOAO, the relevant data were additionally input later. One of the most important components in satellite observation is the accurate time of observation. Therefore, the systematic delay of the recorded time in the head of the flexible image transport system (FITS) file was initially corrected (Calabretta & Greisen 2002; Greisen & Calabretta 2002). The SOAO and CNUO systems used Universal Time Coordinated Korea (UTCK) 3.1 program, the Internet-synced clock developed by the Korea Research Institute of Standards and Science, for time synchronization. UTCK 3.1 systemically synchronizes time every minute. The precision of time at the SOAO and CNUO systems was on the order of 0.01 sec. The OWL test-bed system synchronized time data of the entire system from a Network Time Protocol (NTP) server and obtained data with precision on the order of 0.001 sec.
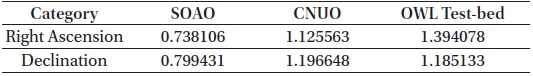
The subsequent data-processing procedure resulted in the WCS solution (Valdes 1984; Lasker et al. 1990). The catalog used for WCS data processing was Guide Star Catalog (GSC), and GSC version 1.1 was used for the observation data obtained at the OWL test-bed and CNUO. A relatively early version of GSC was used because a number of stars were observed owing to the wide FOV. On the other hand, for the WCS data processing of the SOAO data obtained with a narrower FOV, GSC version 2.3 was necessary with data for more stars (Russel et al. 1990; Park et al. 2011). Table 3 lists the root-mean-square (RMS) errors for RA & DEC components used for the WCS data processing.
[Table 3.] WCS RMS Results of Right Ascension and Declination element (unit: arcsec)

WCS RMS Results of Right Ascension and Declination element (unit: arcsec)
We verified the observation of the target GEO satellites in each data file containing the results obtained from WCS. Although the WCS results were verified, the observation of the satellites must be additionally checked with the naked eye. The data of satellites that were observed but could not be separated from the background with the naked eye or the data with unverified initial locations of satellites at the time exposure began, accompanying the vague starting point for satellite observation, were not utilized for the study. The observed satellite points listed in Table 2 indicate the results obtained from such procedures.
To correct the time information of observation data, values of light-travel time delay were added. Correction was also performed for the time delay that occurred in the telescope shutter used at each observatory. The shutter speed delay was determined by measuring and averaging the command time and shutter response time in more than 100 experiments. The RMS values of the shutter speed delay were 0.62, 1.135, and 0.265 sec for the SOAO, CNUO, and OWL test-bed, respectively. In the next procedure, the RA & DEC-format file was converted to the Geodetic Earth Orbiting Satellite C (GEOSC) format to be used for orbit estimation with the ODTK. Finally, annual and daily aberration correction was applied in the ODTK before conducting orbit estimation.
4. COMPARISON OF ORBIT ESTIMATION RESULTS
4.1 Comparison of Estimated Orbits with Optical Observation Data and Simulated Observation Data
The ODTK was utilized as an orbit estimation program, and the two line element set (TLE) was used as the initial value, as summarized in Table 4 (Historical TLE search 2015). The orbit estimation results were compared by combining observatories to obtain different baseline distances for different combinations of observatories. The compared data for the SOAO are as follows:
a. Single observation data of the SOAO b. Combined observation data of the SOAO and CNUO: baseline distance of 89 km c. Combined observation data of the SOAO and OWL test-bed: baseline distance of 113 km d. Combined observation data of the SOAO, CNUO, and OWL test-bed
[Table 4.] Six orbital elements of COMS converted from TLE used in the simulation.

Six orbital elements of COMS converted from TLE used in the simulation.
The RMS errors of each radial, in-track, and cross-track (RIC) components were obtained by differencing the estimated orbits with actual observation data and data simulated from the reference orbit using TLE, as summarized in Table 5.
[Table 5.] RMS errors in RIC components of real and simulated data.
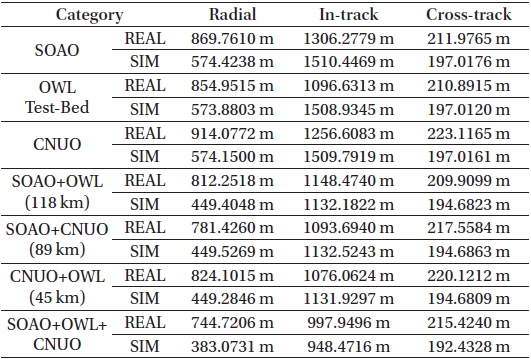
RMS errors in RIC components of real and simulated data.
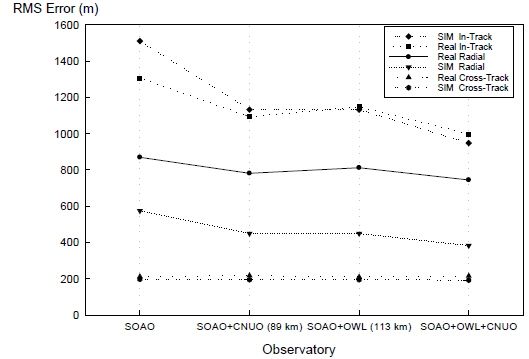
The RMS errors of orbits estimated with the simulated and actual observation data based on each observatory from the reference orbit shows similar trends with increasing baseline distance (Hajiyev & Ata 2011). As presented in Vallado (2004), the direction of the cross-track aligns with the angular-momentum vector (strong invariant), and the inclination is close to 0. Thus, the RMS error in the cross-track of the orbit estimated with the optical observation (angle measurement) tends to be smaller than that in the other components (Hwang et al. 2008). While the orbit estimation results in the simulation converged smoothly without off-set, bias, or black noise, the orbit estimation results obtained with the actual optical observation data can have peculiar errors in the radial and in-track components due to the optical observation errors (angle error; approximately perpendicular to the range vector). The in-track component is directly influenced by the velocity direction of a satellite and observation-time accuracy, and it is usually greater than the other two components. With angle measurements, the results of orbit estimation generally show weak observability in the radial component. Thus, the RMS error in the radial component of the orbit estimation in this study has little chance to be lower than the RMS error in the cross-track component.
As the number of observatories participating in orbit determination increases, results with better precision are obtained across all RIC components. Considering that the values of observation data from two observatories in the simulation were similar, it is concluded that the increase in precision with increasing number of observatories is attributable to the small amount of OWL test-bed observation data used for the orbit estimation. According to Lee et al. (2004), orbit estimation results are consistent only if sufficient observation data exist.
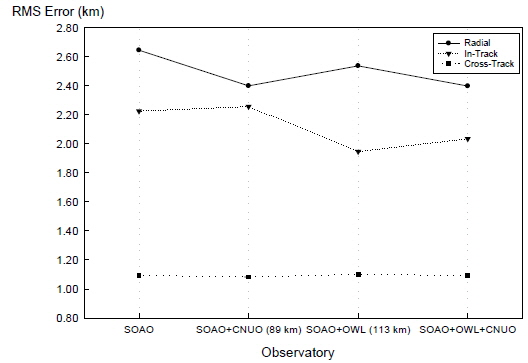
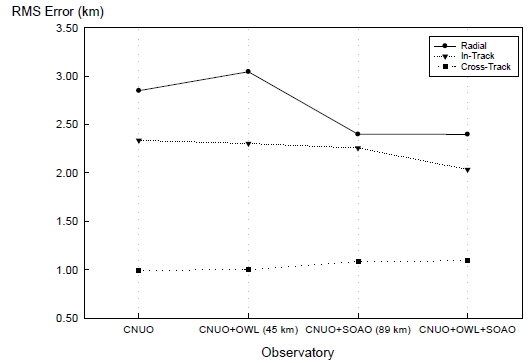
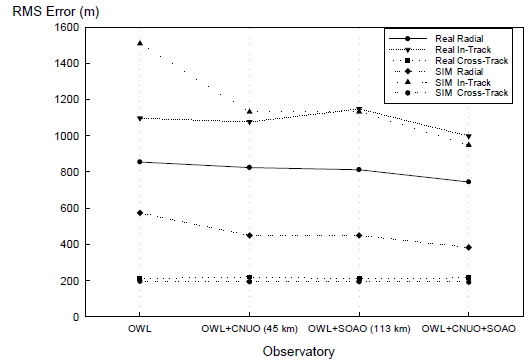
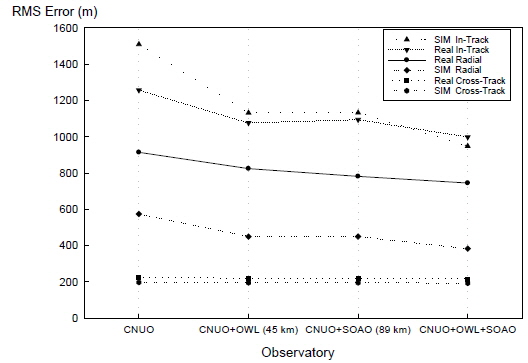
Figs. 3–5 show the orbit estimation results from each observatory, those from the data of two observatories based on the baseline distance between them, and those from the data of three observatories; the figures show results centered around the SOAO, OWL test-bed, and CNUO, respectively. When the number of observatories used for orbit estimation increased from two to three, the precision of the results was found to increase.
A comparison was made between the ephemeris of the COMS maintained by the satellite operator and the orbits estimated through optical observation. The ephemeris from the satellite operator was propagated by the high precision orbit propagator (HPOP) to produce the orbit during the same observation period. Fig. 6 shows the difference in RIC components between the operator’s ephemeris of COMS from the Korea Aerospace Research Institute (KARI) and the orbit estimated with optical observation data. The optical observation data were obtained from several combinations of single and multiple optical observatories centered at the SOAO according to the difference in baseline distances. The RMS errors in the cross-track component did not show any improvement in all the cases of combination of observation data. However, it was also verified that the results from the in-track and radial components became more precise with data from a higher number of observatories, depending on the data used for orbit estimation.
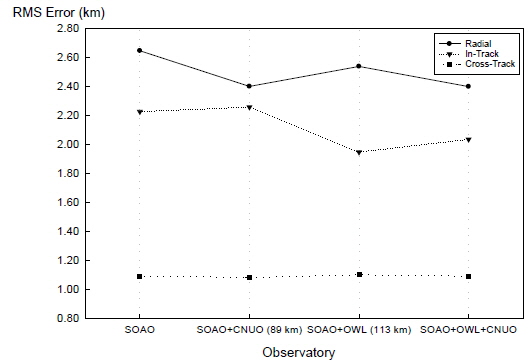
Fig. 7 compares the trend of RMS error between the operator’s ephemeris and orbit estimation results with several combinations of single and multiple optical observatories centered at the OWL test-bed. The more the number of observatories used for orbit estimation, the more precise the results were in the in-track and radial components. In the case of the OWL test-bed, the cross-track was found to increase gradually within an error range of 1 km.
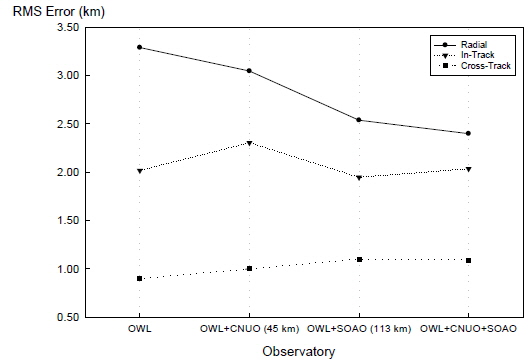
Fig. 8 compares the trend of RMS error between the operator’s ephemeris and orbit estimation results with several combinations of single and multiple optical observatories centered at the CNUO. The radial and in-track components showed gradually improving results. Although the RMS error in the cross-track at the CNUO increased, the deviation was smaller than that in the results obtained at the OWL test-bed. However, this is not sufficient to explain the entire orbit, because the observation time does not exceed the limit of 10 hr.
We used 600 simulated observation points for the orbit estimation in the simulation, but different numbers (523, 421, and 75) of real observation data were used for the orbit estimation based on the optical observation. This indicates that the radial RMS error in orbit estimation is dependent on the amount of observation data used.
In this study, we estimated the orbit of the COMS GEO satellite by using actual optical observation data. The observation was conducted at the SOAO, OWL Test-Bed, and CNUO in South Korea. The observation campaign spanned 166 days from August 1, 2014, but the actual observation was successful only on 5 days at the CNUO, 12 days at the OWL test-bed, and 9 days at SOAO because of weather conditions and equipment issues. The simultaneous observation at all three observatories was successful only on one day.
Necessary corrections were made to the optical observation data before the orbit estimation. The observation epoch, light-travel time delay, and shutter speed delay were corrected to enhance the time accuracy in observation data. For the orbit estimation, the ODTK sequential filter was used for correcting aberration as the last data-correction process.
After post data processing, we investigated the effects of baseline distance between observatories on the results of optical orbit estimation of the COMS. Based on the orbit estimation results of a single observatory, the data from two and three observatories were analyzed. The results of this comparative analysis were checked again with the RIC components. Considering the study of Son et al. (2015), who found that a baseline distance between observatories lower than 150 km had a limited influence, the baseline distance was assumed to be an influential factor in optical orbit estimation.
In conclusion, first, the orbits estimated with simulated observation data agree with those estimated with actual optical observation data from one, two, and three observatories within an error of 300 m at worst in the radial component. Second, as the number of observatories considered in obtaining data increased from one to three, the difference between the estimated orbit and the reference orbit from TLE decreased. Third, the trend of the differences between the orbits estimated with actual optical observation data and the orbit ephemeris maintained by the satellite operator, KARI, is very similar to the trend in the comparison between the orbits estimated with actual optical observation data and reference orbits. The RMS error difference in the radial component was greater than those in the other two components. As an optical observation provides information on only two angles, and the orbit estimated with the optical observation data lacks accuracy in the radial component compared to the operator’s ephemeris obtained from ranging and angle information. We believe that our results will prove useful for optimizing the collection of observation data for orbit estimation.