A DC Langmuir probe measures two basic parameters: electron density (Ne) and electron temperature (Te) in plasma (Langmuir & Mott-Smith 1924). Since a DC Langmuir probe was first flown in a V-2 rocket from White Sands in New Mexico, USA (Reifman & Dow 1949) to measure the lower E-region ionosphere, the probe has been flown in many sounding rockets and satellites there (Boggess et al. 1959; Spencer et al. 1965; Brace et al. 1973; Brace 1998) and in Russia (Andreyeva et al. 1971). Even now, DC Langmuir probes are generally employed in low earth orbit satellites, such as Astrid (Holback et al. 2001), Detection of Electro-Magnetic Emissions Transmitted from Earthquake Regions (DEMETER) (Lebreton et al. 2006), Challenging Minisatellite Payload (CHAMP) (Cooke et al. 2003), SWARM (Buchert et al. 2015), and Communications/Navigation Outage Forecasting System (C/NOFS) (Costa et al. 2014). This is because Ne and Te are two basic parameters that are fundamental for study of the ionosphere/plasmasphere. It goes without saying that without Langmuir probe measurements, the detailed understanding of the ionosphere that we now have would not have been possible.
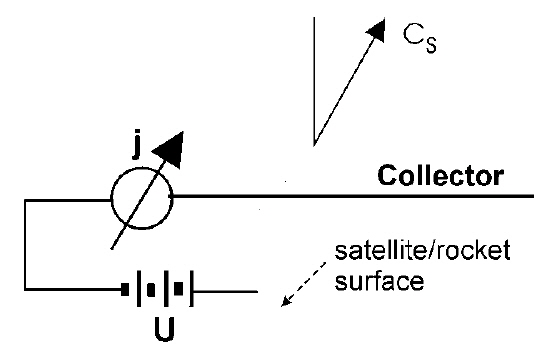
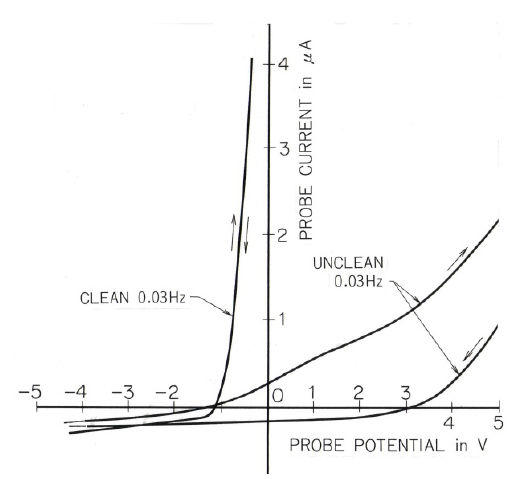
Fig. 1 shows the principle of the measurement. Varying voltage is applied to an electrode immersed in ionospheric plasma, with respect to the satellite (rocket) body, the electron and ion currents, I, that flow into and/or out from the electrode are measured. The I-V curve thus measured is fitted to a simple equation I = Ieexp(-eV/kTe)–Ip for the electron retarding region. V is measured from the potential of ambient plasma. In the equation, the electron saturation current, Ie=Se·Ne·e ·(kTe/2πme)1/2, and Ip= bV+ c. Se, Ne, e, k, and me are the surface area of the electrode, electron density, electron charge, Boltzmann’s constant, and electron mass, respectively. b is the slope of ion current, and c is the ion saturation current. Fig. 2 shows two I-V curves. One is the curve that was measured after the electrode was bombarded by highly negative voltage, and the other was measured by an electrode that was only washed by a chemical liquid, such as acetone. Here, Te and Ne cannot be obtained if the electrode is not ion bombarded or is not heated under vacuum. Thus, the principle of the DC Langmuir probe is simple and measurement appears to be easy. However, despite this simplicity, it does not always provide reliable results, especially for Te measurement. Even now we encounter problems in using Te data that are erroneously measured by satellites (Kakinami et al. 2013). Ne is automatically calculated incorrectly because Ne is a function of Te as is related to by the equation Ie = Se·Ne ·e(kTe /2πme)1/2 in Langmuir probe theory, in addition to the reduction of probe current caused by electrode contamination.
We must provide reliable and accurate data to users so that the effort, time, and money spent for rocket and satellite missions are not spent in vain or inefficiently. In this review, we mainly discuss Te measurement because calculation of Te from DC Langmuir probe data very often provides inaccurate values, even if the instrument and the sensor are carefully maintained. It is noted however, that the electron collection mechanism is not simple when an electrode is moving because the wake behind the electrode makes the theory complicated (Séran et al. 2005). The purpose of this paper is to make scientists aware of the problems that occur when Langmuir probes are used and to provide the information needed to obtain reliable and accurate electron temperature measurements. We will start with measurement in the E region; then proceed to measurement in the F/topside region and the plasmasphere and discuss two major problems associated with measurements. We finally end with a discussion of the subjects that need to be studied in the future.
In the lower E region, we still cannot fully confirm the value of Te in the lower E region (Oyama et al. 1980; Oyama 2000) even at mid-latitude, and in spite of the long history of sounding-rocket experiments. Most of the measurements report daytime Te, which is higher than the model neutral temperature Tn(Smith et al. 1968; Schutz & Smith 1976; Rohde et al. 1993). During the daytime, the ionospheric electron density is about 105 els/cm3 at the altitude of 95-120 km, while the density of neutral particles is 1012 particles/cm3. That is, neutral density is 107 times higher than Ne. Accordingly, Te is expected to be nearly equal to Tn. We know that most of the measurements provided in 1970 are not correct (Oyama et al. 1980) mainly due to electrode contamination (Oyama 1976; Oyama et al. 2012). However, even when an electrode with a clean surface is used (Hirao & Oyama 1972; Oyama & Hirao 1976; Oyama et al. 2008a, b) or another instrument is used whose measurement is not influenced by electrode contamination, the measurements still show Te to be higher than Tn during the daytime. The Te value measured by a resonance cone instrument agrees with this measurement (Piel et al. 1992), as well as that obtained by incoherent scatter radar (Smith et al. 1978).
Electron temperature inside and/or around the sporadic E layer (Es) is controversial. The Te value measured by Aubry was about 600K in the Es layer (Aubry et al. 1966), which is higher than that of outside plasma. The value measured by Schutz & Smith (1976) was about 380K inside Es, while outside Es, the Te value at the lower edge and upper edge of the Es layer were found to be 500K and 550K, respectively. The measurement was done by using a pulsed probe. According to Yoshimura et al. (1999), Te was about 1,000K in the Es which appeared at the height of 92.5 km, while outside Te was about 600K. The Ne value changed from 104 els/cm3 to 4×10⁴ els/cm3. The measurement was done by using a glass-sealed Langmuir probe. The measurement was repeated using a glass-sealed Langmuir probe, and the Te value inside was very close to the neutral temperature Tn, while outside Es, the Te value was several hundreds of degrees higher than the neutral temperature (Oyama et al. 2008a, b). The Te values reported by Barjatya (2007) was similar to these results. Theoretical discussion on Te inside Es was conducted by Gleeson & Axford (1967): Te is about 15K higher than the model neutral temperature, Tn, while outside Es , Te is higher than Tn by about 80 degrees. As such, Te measurement in the sporadic E layer is scarce (Szuszczewicz & Holmes 1977), and we still have not established the general behavior of Te in it.
If we can guess the energetics of the usual E layer from the measurement of Te inside Es which is very close to Tn, and that of Te outside of Es, which is higher than Tn , Te in the lower E region seems to be unequal to Tn. If so, then a question arises regarding high Te in the lower E region. Have we missed a heating mechanism in the theory? Theoretical computations by Gorse et al. (1985) and Paniccia et al. (1986) for laboratory plasma show that vibrationally excited N2 contributes to the heating of thermal electrons. The vibrational temperature of N2 (measured by a sounding rocket) was close to Te (Kurihara & Oyama 2005). When N2-O2 mixed-gas plasma was irradiated with an extreme ultraviolet (EUV) lamp, which mimics the solar EUV, an increased peak occurred around 0.4 eV (Oyama et al. 1991, 2011). This peak increases most when the density ratio of N2 to O2 ([N(O2)]/N[(N2)] is ~20%. On the other hand, according to Ashihara & Takayanagi (1974), who took into account the interaction between thermal electrons and vibrationally excited N2, the heating of thermal electrons seems to be small. Pavlov (1994) draws the same conclusion regarding the heating of thermal electrons.
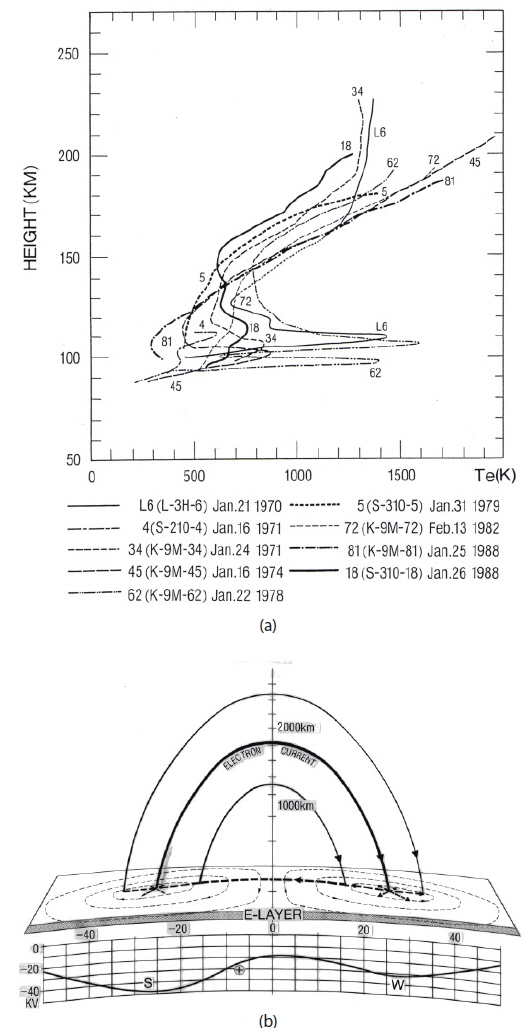
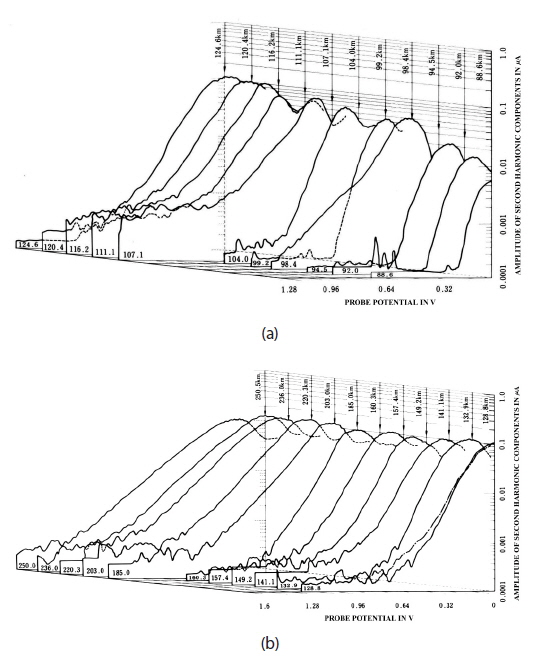
It was found that a sharp layer of high Te (thickness of ~20 km) appeared at 11 hours ±30 minutes in local time (LT) in winter (January and February) in the midst of the Sq-current focused (Oyama & Hirao 1979a) around the altitude of 105 km as Fig. 3 shows. Higher Te was found as the sounding rocket got closer to the Sq focus, and when there were more sunspots. The measurement of energy distribution indicated that a non-Maxwellian distribution of thermal electrons, or a high-energy tail, exists around the Sq focus (Oyama & Hirao 1979b), as Fig. 4 shows. The measurement principle of the energy distribution function is described in section 2.3. It was also observed strong plasma irregularities up to an altitude around 160 km (Oyama & Hirao 1985). One mechanism to explain these features is the potential difference between the summer hemisphere and the winter hemisphere. The potential in the winter hemisphere is higher than that in the summer hemisphere (Fukushima 1994), and the potential difference might be concentrated at altitudes < 150 km, where parallel conductivity becomes smaller than other conductivities (Oyama 2000). This might be related to the field-aligned current, which flows from winter to summer hemispheres (Takeda 1982). Efforts to find a heating mechanism are ongoing (Abe 2015, private communication). It is surely worth trying to observe plasma irregularities from the ground by HF radar when the Sq focus is near. It is noted that the location of the Sq focus changes depending on the day and season in mid-latitudes (Tarpley 1973).
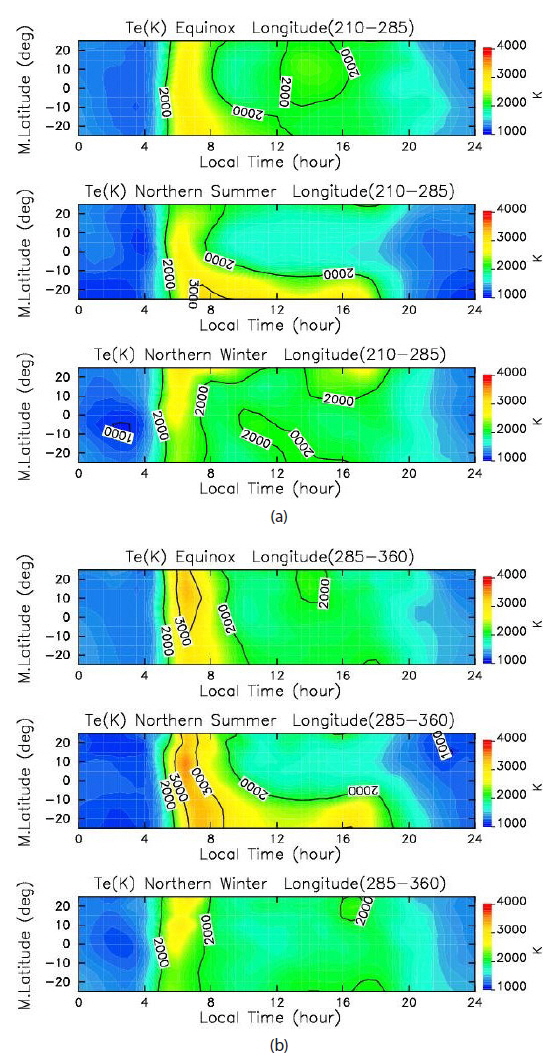
Since the 1980s, not many aeronomy satellites have been in orbit within the F and topside ionosphere (Schunk & Nagy 1978; Krehbiel et al. 1981; Sharma et al. 2010). Fig. 5 shows an example of the global distribution of Te at ~600 km at longitudes of 210°–285° and 285°–360°, which were observed by the HINOTOPRI sun observation satellite (to download data, visit the NSSDC website). The measurement was done using an electron temperature probe (modification of a DC probe), which is not influenced by electrode contamination (Oyama & Cheng 2013). The difference between the two figures is especially related to morning overshoot of electron temperature in three seasons, which is considered to be due to zonal wind. Zonal wind becomes effective when the magnetic meridional plane tilts like in the longitude band of 285°–360° (Oyama et al. 1996; Watanabe & Oyama 1996).
Recently, a number of satellites (Astrid, CHAMP, DEMETER, Proba-2, and SWARM) have been launched. Although these satellites are not purely dedicated to ionosphere study, all of these satellites carry a DC Langmuir probe (Holback et al. 2001; Lebreton et al. 2006; Buchert et al. 2014). The data measured by Astrid has shown unexpectedly high Te (Holback et al. 2001), and the Te measured by CHAMP at night is sometimes overestimated. The Te values at night (period 20 to 03 LT) during the March equinox are sometimes about 500K higher than the HINOTORI satellite data indicates (Su et al. 1995, 1996; Balan et al. 1997). We presume that this high temperature observed by CHAMP could be due to the low sampling rate (Cooke et al. 2003) in addition to insufficient amplifier gain. At night, there are only three or four measurements in the electron retarding region, where electron density is low. If we fit the theoretical curve to the small number of observed data points, where some of the data points are near space potential and are not on the fitting curve, the result is that Te is higher than the true value. The Te values measured by the DEMETER satellite are 2–3 times higher than what we think is the true Te (Kakinami et al. 2013). The high temperature is due to contamination of the electrode. The contamination effect appears as hysteresis in the I-V curve of the DC Langmuir probe, which we discuss in more detail in Section 3.1.
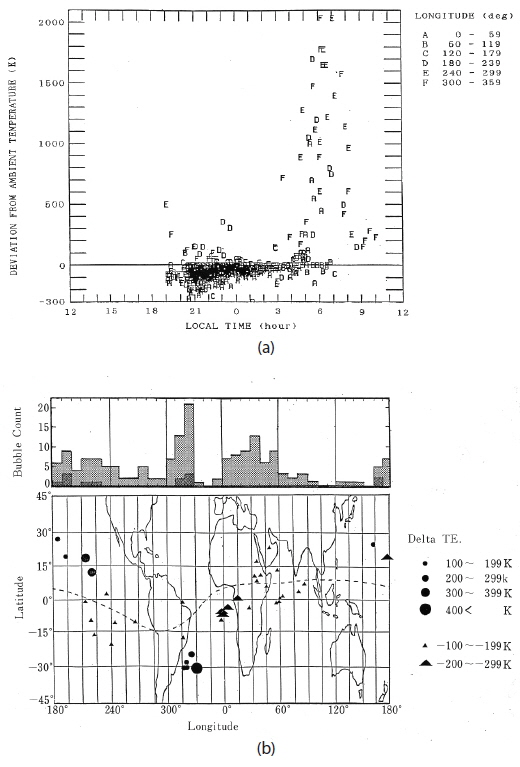
The Te in the plasma bubble observed by the HINOTORI satellite (Oyama et al. 1988) shows clear local time dependence. As Fig. 6 shows, Te is lower than, equal to, and higher than that of outside plasma, before midnight, at midnight, and early morning, respectively. In Fig. 6, there are several values that show positive deviation (Te is higher than that of ambient plasma) at night. These points are seen in the South Atlantic Geomagnetic Anomaly, which suggests the heating of thermal electrons by the precipitation of high energy particles. One more elevated Te region is over Hawaii. The reason, we assume, is that energetic particles precipitated by the interaction between Very Low Frequency (VLF) and particles in the lower edge of the radiation belt heat thermal electrons. It should be noted that a VLF transmitter facility is located in Hawaii.
[Fig. 6.] (a) Local time variation of Te in the plasma bubble. The letters A, B, C, D, E , and F denote the data obtained in the longitude bands of 0˚- 60˚, 60˚ - 120 ˚, 120˚ - 180˚, 180˚ - 240˚, 240˚- 300˚, and 300˚ - 360˚, respectively. In (b), the upper panel shows the total number of plasma bubble (grey shade), and that of the bubble inside which Te is higher than that of ambient plasma (black shade). The lower panel shows the locations where Te inside the plasma bubble is higher (triangular), and lower (circle). The size of the triangle and circle shows the degree of the Te difference from that of ambient plasma (after Oyama et al. 1988).
Above the height of 3,000 km, the measurement of Te and Ne using a conventional DC probe is only possible at night, and on rare occasions during the daytime in the shadow of a satellite because the number of secondary electrons from the electrode used for measurement is higher than that of ambient plasma (Rich et al. 1979). Secondary electrons from the satellite are mixed with electrons of the ambient plasma, although the energy of secondary electrons is higher than that of thermal electrons in ambient plasma (Grard 1973). This means that the current caused by secondary electrons is dominant on the I-V curve, on which current due to electrons in the ambient plasma is superposed. Past measurement was done at night, or when the electrode was in the shadow of the satellite during the daytime (Rich et al. 1979). As a result of this situation, the amount of data accumulated was small, and no systematic measurement was done before 1989 (Titheridge 1998). To overcome this problem, we applied a second-harmonic method to measure energy distribution function and finally calculated Te (with an instrument called TED, Abe et al. 1990).
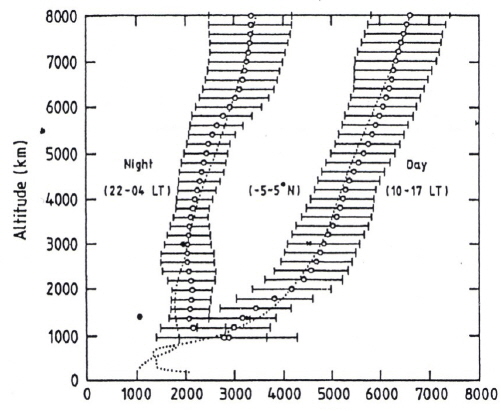
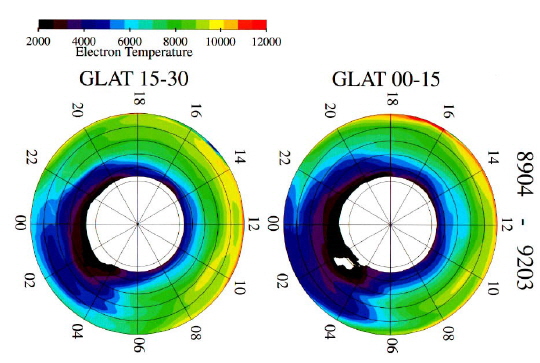
To measure the energy distribution of thermal/nonthermal electrons, the Druyvesteyn (1930) principle is applied, which states that energy distribution is proportional to the second derivative of the I-V curve, d2I/dV2. To get the second derivative, we superpose the sinusoidal signal (frequency of 2 kHz) of small amplitude to the probe voltage and pick up the second-harmonic components (4 kHz) from the distorted DC current. The second harmonic component I2ω is proportional to the second derivative of the I-V curve by a relation I2ω ~ a2/4 d2I/dV2, where a is the amplitude of the sinusoidal signal. Reliable measurement of energy distribution can only be obtained using a glass-sealed Langmuir probe (Oyama & Hirao 1976). The system makes it possible to measure Te even at high altitudes except mid-latitudes or high latitudes in the existence of secondary electrons from the electrode due to EUV. The secondary electrons from the satellite itself have much higher energy than thermal electrons, and they do not affect the Te value. The instrument was deployed in the Japanese auroral study satellite “AKEBONO”, and it produced the first systematic Te measurement up to 8,000 km (Balan et al. 1996a, b; Titheridge 1998; Kutiev et al. 2002). Figs. 7 and 8 show some of the results. As the satellite followed an eccentric orbit, data was accumulated for a long time. Fig. 7 shows the height profile during the day and night, respectively, over the geomagnetic equator. Fig. 8 shows the average local time variation for heights from 1,000 to 8,000 km in two geomagnetic latitude zones, namely, the 15°-30° (left-side) and 0°-15° (right-side) meridian planes.
[Fig. 8.] Plot of altitude/local time of Te at two geomagnetic latitude zones (GLAT 0°?15°, and GLAT 15°?30°), observed by the Akebono satellite. Altitude is indicated by circles every 2,000 km. Note that Te is about 8,000K at 22 LT at 4,000 km for GLAT 15°?30°, while for GLAT 0°?15° at 22 LT, Te at 4,000 km is < 5,000K. This suggests that the magnetic tube at GLAT 15°?30° is larger than that at GLAT 0°?15°, causing slow Te increase in the early morning, and slow decrease of Te at night at GLAT 15°?30˚, where heat capacity is larger than at GLAT 0°-15˚.
As described above, Te is still not properly measured on some occasions despite the long history of Langmuir probe measurement in space. As space missions require a tremendous amount of manpower, energy, time, and money, we should make the maximum effort to obtain accurate and reliable electron temperatures. This attitude is strongly required because some scientists are trying to improve International Reference Ionosphere (IRI) or to make ionosphere models with the belief that the data measured is accurate and reliable (Truhlik et al. 2009, 2012). Erroneous results can be avoided only by paying special attention to electrodes as well as to the electronics. Next, we present the issues that must be taken into account to achieve reliable measurements.
Ne in the ionosphere ranging from about 60km to above, is on the order of 102 to 106 els/cm3, depending on the altitude, local time, and latitude. In the mid-latitude trough, where Ne drops below 103 els/cm3 even at 2,000 km, Te appears to be in the range from 200K to about 3,000K. At higher altitudes above 3,000 km, Te can be higher, showing a gradual increase. Te and Ne are usually obtained by a DC probe. When sweep voltage is applied to an electrode in ionospheric plasma, current will flow into or out from the electrode, depending on electron or ion retardation. The current-voltage characteristic curve should take the same path when the direction of the sweep voltage is changed (increasing and decreasing directions). However, in almost all cases the current-voltage characteristic takes a different path, called hysteresis, as shown in Fig. 2. This phenomenon has been well known to researchers for a long time (Van Berkel 1938; Wehner & Medicus 1952; Winkler et al. 2000; Stamate & Ohe 2002), even when very few ionosphere scientists were aware of the problem of serious electrode contamination (Sturges 1973; Amatucci et al. 2001; Hirt et al. 2001; Steigies et al. 2005; Barjatya et al. 2007). The hysteresis decreases as the frequency increases, and disappears at higher frequency ranges (frequency dependence); hysteresis also increases at higher densities (density dependence). The mechanism of hysteresis is thought to be related to contaminants on the electrode surface, whose main constituent is water (Oyama 1976). The combination of the large dielectric constant of water (~80) and the thin contaminant layer in the range of 20-80 nm provides large capacitance of the order of 10-100 μF. The contamination layer is a parallel connection of the capacitor and a resister. The resistance is about 500 kΩ - 1 MΩ for the case of a cylindrical electrode 3mm in diameter and 20 cm in length.
To avoid undesirable effects of the contaminated layer on the measurement, Oyama & Hirao (1976) developed a way to keep the probe surface clean by sealing the cylindrical electrode within a glass tube until starting measurement. This device is called the glass-sealed cylindrical probe. Another way to remove the effect of electrode contamination is to sweep the DC probe voltage with a frequency high enough to remove the hysteresis. Usually a frequency of ~10 Hz is high enough. When the sweep voltage is changed quickly, a correct I-V (I in the vertical axis, and V in the horizontal axis) curve is obtained (the hysteresis disappears), although the horizontal axis shifts to a more positive direction. The Te values obtained by a fast sweep voltage agree with values obtained by a clean probe. A third way is to modulate a triangular wave by a short pulse, called a “pulse probe”. Its design was based on an equivalent circuit model. Because the pulse contains a high frequency component, the contamination effect disappears (Szuszczewicz & Holmes 1975). However, this method cannot be used when we try to measure the energy distribution function using the second-harmonic method (Boyd & Twiddy 1959). Instead, a glass-sealed Langmuir probe was used to measure energy distribution in the E region (Oyama & Hirao 1979a, b; Oyama et al. 1980; Oyama & Hirao 1985).
There is one more way, namely, to use an electron temperature probe (a modification of a DC Langmuir probe, see Hirao & Oyama 1970). In this approach, a low frequency sinusoidal signal is applied to the electrode, and the floating potential shift is picked up due to the nonlinearity of the I-V curve. The value can be measured from the shift. The advantages of using this probe are that the instrument is not influenced by electrode contamination (Oyama & Cheng 2013), it can be manufactured cheaply, and it consumes very little power. The probe was developed in the 1970s (Hirao & Oyama 1970) and was installed in five scientific satellites in Japan as well as more than 60 rockets, including rockets deployed in the Antarctic, US, India, Brazil, and West Germany. The probe was also carried in satellites, including those of Korea, Russia, and Brazil. Recently, the fixed-frequency oscillator was replaced with a varying frequency circuit, which changes the frequency from 500 kHz to 10 MHz. This allows both Te and Ne to be measured successively with one simple instrument (Oyama et al. 2015).
Operation of the DC Langmuir probe is based on the assumption that a counter electrode is infinite, compared with the surface area of the electrode. As satellites have become smaller, the conductive surface area of the satellite used as a counter electrode has become insufficient. As the voltage of the electrode increases with respect to the satellite frame, currents due to thermal electrons of ambient plasma increase. Accordingly, the satellite potential goes further negative to collect more ions from the ambient plasma, trying to cancel the electron current flowing out from the electrode. As a result, the I-V curve is not adequate to measure either Te or Ne. To overcome this problem, especially for small satellites, several possible solutions have been considered. For example, a satellite can be equipped with an electron transmitter, which will emit thermal electrons when the satellite potential becomes more negative, and as a result the satellite potential recovers. Although double-probe measurement (Johnson & Malter 1950) is free from the problem of conductive surface, problems associated with electrode contamination still remain. Another approach is to provide an instrument for which measurement is not influenced by a small conductive surface (Oyama et al. 2015). This instrument combines a small inlet electrode with an electron multiplier, which effectively increases the conductive surface area of the counter electrode (Shimoyama et al. 2011).
When we want to increase the spatial resolution of Te measurement, such as in a plasma bubble, we need to increase the frequency of the sweep voltage of the electrode. For 10 Hz and 100 Hz of the frequency, the horizontal space resolutions are ~ 700 and 70 m, respectively. However, as the frequency increases, the effect of stray capacitance around the first preamplifier becomes more serious. The sweep voltage is differentiated by a stray capacitor, and a square wave signal is obtained at the output voltage even when the electrode is not in a plasma environment. The amplitude of the square wave increases as the frequency of the sweep voltage increases, and it is much greater than that due to the probe current. This feature is overcome by taking several steps. To reduce stray capacitance, the same voltage should be applied to the shielding line of the coaxial cable that connects the electrode and the electronics box as that used as the sweep voltage. At the same time, a small capacitor should be added to cancel the imbalance in the frequency response of the preamplifiers. To get accurate and reliable values, laboratory experiments should be repeated so that information on the electronics and their plasma measurement is accumulated. It is stressed that every scientist should be aware of the fundamental problems involved in obtaining reliable data under close communication with the engineers who are in charge of measurement systems.
Measurements of Te in this region are still scarce, although since 1978 when Schunk & Nagy (1978) reviewed Te measurements in the F region, our knowledge has gradually increased. Measurements of Te and Ne, especially Te, might provide information on neutral wind systems with the help of computer simulation (Su et al. 1995, 1996).
Measurement of Te inside a plasma bubble has so far been difficult because high-resolution measurement is required, and an accordingly large down link is needed. So far, only three papers have reported electron temperature in a plasma bubble (Oyama et al. 1988; Oyama et al. 1993; Park et al. 2008). The measurement of Te at the plasma edge might provide a further interesting research subject regarding the current flowing at the edge of a plasma bubble. Recently, Huba et al. (2011), conducted a computer simulation using the SAM13/ESF simulation code. The result shows that cooling occurs just below a plasma bubble at the equator, and heating occurs at the foot of each hemisphere. Taking these new findings into account, further high space resolution observation by satellites and analysis of data which have been measured so far should be conducted.
The effect of sudden stratosphere warming (SSW) on the ionosphere has recently been studied, mainly using Total Electron Content (TEC) data (Jin et al. 2012; Oyama et al. 2014). Although SSW is a high latitude phenomenon that occurs around 10 hPa height, the ionosphere disturbance extends globally in longitude and latitude, maybe due to changes in the wind system of the thermosphere as well as the dynamo region atmosphere, which then changes the distribution of the electric field. Accordingly, Ne and Te satellite data (Lühr et al. 2012) are needed to study the SSW effect on a global scale, which TEC data does not provide. Data on Te in particular, might help us to understand the mechanism of ionosphere modification, because the neutral wind in the thermosphere and lower E region seems to play an important role in modifying the electric field in the equatorial region as well.
Recently, some scientists have started using Te and Ne satellite data to study atmospheric features preceding large earthquakes. Oyama et al. (2008c) reported the disappearance of afternoon overshoot in conjunction with three earthquakes. Such overshoot is usually found in the afternoon at low and middle latitudes. Ryu et al. (2014) reported that the equatorial ionosphere is influenced by large earthquakes (M > 6.5). The area disturbed by large earthquakes extends roughly 40° to the west and east from the epicenter (the total region is 80°), and 20° to the north and south (total 40°). Depending on the latitude, local time, and height, the features of ionospheric disturbance differ (Oyama et al. 1996); therefore, it is difficult to cover the entire area affected using ground-based experiments. Although many reports on the ionosphere precursor have appeared, we have not found a way to predict a large earthquake in the short-term (about 5-10 days). We believe that a constellation of satellites is needed to cover the whole globe, to establish the morphology of ionosphere features as we describe in detail in section 5.
We still do not have sufficient data regarding the downward flow of plasma that fills the inside of flux tubes during the daytime and flows down along magnetic line of force at night. The efficiency by which thermal electrons are heated by photoelectrons traveling along magnetic lines of force from the ionosphere below has not yet been measured (Balan et al. 1996b). There have been many theoretical papers on the heating of thermal electrons by electrons escaping from ionosphere; however, observation of these is rare and insufficient to study these issues. To do so, we first need to know the electron temperature from the F region upward to the plasmasphere, but systematic measurements are still rarely conducted. Inside the trough above 3,000 km is still not known because Ne drops to 102 els/cm3, making measurement by DC probe difficult. For measurement in low density we may combine a small retarding potential analyzer and an electron multiplier that operates by current measurement mode, not by particle counting mode (Shimoyama et al. 2011). The second-harmonic method is applied to the instrument, which removes the problem of the secondary electrons from the electrode and from the satellite wall.
There are still many issues that are not clear, and some are totally unknown. However to answer many questions, we need sounding rockets as well as satellites. We are now rapidly moving into an era of small satellites. Using a DC Langmuir probe or some modification of it on board tiny satellites (e.g., 10-50 kg total mass), we might be able to find answers to the questions discussed. It may even become possible, in the short term, to contribute to human safety by the study of atmospheric indicators of earthquakes. The tiny satellites (10-50 kg in total weight) should be in the regime of constellation missions, and the altitude of each satellite should be 250-300 km with a circular orbit and an inclination of about 40°. Although the launching cost would still be expensive, the cost could be shared among countries that would like to increase our knowledge of space, and to contribute to human society by study of the ionosphere/plasmasphere (Oyama et al. 2010). DC probes might be carried in orbiters of other planets, as planetary exploration evolves (Krehbiel et al. 1980). The experience we have acquired in earth orbiting satellites surely constitutes a foundation for successful planetary missions.


