Forbush Decreases (FD) are transient, sudden reductions of cosmic ray (CR) intensity lasting a few days, to a week. Such events are observed globally using ground neutron monitors (NMs). Most studies of FD events indicate that an FD event is observed simultaneously at NM stations located all over the Earth. However, using statistical analysis, previous researchers verified that while FD events could occur simultaneously, in some cases, FD events could occur non-simultaneously. Previous studies confirmed the statistical reality of non-simultaneous FD events and the mechanism by which they occur, using data from high-latitude and middle-latitude NM stations. In this study, we used long-term data (1971-2006) from middle-latitude NM stations (Irkutsk, Climax, and Jungfraujoch) to enhance statistical reliability. According to the results from this analysis, the variation of cosmic ray intensity during the main phase, is larger (statistically significant) for simultaneous FD events, than for non-simultaneous ones. Moreover, the distribution of main-phase-onset time shows differences that are statistically significant. While the onset times for the simultaneous FDs are distributed evenly over 24-hour intervals (day and night), those of non-simultaneous FDs are mostly distributed over 12-hour intervals, in daytime. Thus, the existence of the two kinds of FD events, according to differences in their statistical properties, were verified based on data from middle-latitude NM stations.
The intensity of cosmic rays (high-energy nuclei, mostly high-energy protons), changes over time. Periodic and nonperiodic changes in the intensity of cosmic rays is affected by solar activity (the solar modulation effect) (Parker 1961, Parker 1965, Sandstrom 1965, Sanderson 1983, Quenby 1967, Moraal 1993, Kudela 1997). Non-periodic changes in cosmic ray intensity are related to the phenomena called Forbush decrease (FD) and ground level enhancement (GLE). While FD events show a rapid decrease in the intensity of cosmic rays, GLEs show an increase in high-energy particles from the Sun. Both phenomena are monitored, and recorded, by neutron monitors (NMs) on the ground.
During an FD event, the intensity of cosmic rays incident on the Earth decreases rapidly due to the solar modulation effect, for a few days or for a week, when monitored by NMs (Forbush, 1938). The cause of the rapid reduction in the intensity of cosmic rays is the strong magnetic barrier against cosmic ray particles (Parker 1961, Hundhausen 1972, Lockwood et al. 1991) generated by interplanetary coronal mass ejections (Cane, 2000) and interplanetary shock (IP shock) near the Earth.
About 2–5 hours after the arrival of a strong IP shock, the main phase of the FD develops due to the strong magnetic perturbation in the sheath region (Lockwood et al. 1991). In some cases, enhanced particle scattering results in the accumulation of cosmic ray particles on the front surface of the shock wave. This is indicated by a small increase in the intensity of cosmic rays, just before occurrence of the FD. When magnetic clouds pass by the Earth (Klein & Burlaga 1982, Zhang & Burlaga 1988, Oh et al. 2008, Oh 2008) FDs may occur. In this case, continuous small scale (few %) FDs occur over a few days. When magnetic clouds and IP shocks pass, the cosmic ray intensity decreases, and if the perturbation is strong, a sharp drop in cosmic ray intensity occurs.
Oh et al. (2008), and Oh &Yi (2009, 2011), classified FDs observed using the NMs located at high latitudes (Inuvik, Magadan, and Oulu) into simultaneous and nonsimultaneous FD events. They explained that the main phase of the cosmic-ray-intensity profile of simultaneous FD events observed at these three NM stations, overlap in universal time (UT), while the main phase of non-simultaneous FD events overlap in local time (LT). Oh et al. (2008) explained that simultaneous FD events and non-simultaneous FD events occur depending on the intensity and direction of magnetic clouds. Thus, simultaneous FD events form when IP shocks and magnetic clouds with strong magnetic fields head directly for the Earth, and are distributed symmetrically, so that the Earth is at the center of the magnetic barrier. This mechanism was confirmed by Oh &Yi (2012). A simultaneous FD occurred on 18 February 2011, was formed by a CME headed for the Earth, and surrounded the Earth symmetrically.
Lee et al. (2013) classified simultaneous and non-simultaneous FD events using statistical methods based on the NM data of middle-latitude stations (Irkutsk, Climax, and Jungfraujoch) during the solar maximum (1998–2002). It was confirmed that FD events observed at middlelatitudes also showed differences in the onset times of the main phases, similar to events observed at high latitudes.
In this paper, in order to enhance the statistical reliability of the previous findings, we analyzed simultaneous and non-simultaneous FD events using long-term data from middle-latitude NM stations. We also compared the statistical properties of FDs observed at middle and high latitudes, for both simultaneous and non-simultaneous FD events, and clearly specified these properties.
FD events include a main phase and a recovery phase. In the main phase, there is a rapid decrease in the intensity of cosmic rays, and the recovery phase shows a gradual return to the original intensity.
During the main phase of the cosmic-ray-intensity profile of an event, the time of maximum intensity is designated as the onset time, and the time of minimum intensity is designated as the end time.
In this study, NM stations located at middle-latitudes were chosen that had cutoff rigidity of 3–5 GV, and that also could identify the onset times of simultaneous and nonsimultaneous FD events clearly. Using the cosmic-rayobservation data from the NM stations at Climax, Irkutsk, and Jungfraujoch (those chosen by Lee et al. 2013), FD events were selected from the period from 1971 to 2006.
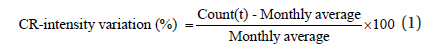
The variation in cosmic ray intensity is calculated using Equation (1). Among events with minimum cosmic ray intensity < −1.5%, those exhibiting a change in the intensity of cosmic rays (maximum to minimum) > −3.0%, were selected. Events with a decrease > −3.0%, and minimum intensity > −1.5% were not selected for analysis. The onset time was defined as occurring within six hours from the maximum, and the end time was defined as occurring within twelve hours from the minimum. In addition, during the main phase of each FD event, the difference between the maximum and the minimum was obtained to investigate the intensity and duration of the event.
The criteria used to select of simultaneous and non-simultaneous FD events was as follows. When the decrease in the cosmic ray intensity of the main phase on the FD event profile of neutron monitors overlapped in UT, the FD events were classified as simultaneous events. The events that did not overlap in UT were classified as non-simultaneous FDs. In other words, non-simultaneous FDs, showed an overlap in the main phase, in LT.
We selected 220 FD events with a cosmic ray intensity variation of at least 3.0%. Among the 220 FD events observed during the period from 1971 to 2006, 167 FD events were classified as simultaneous, and 53 FD events as non-simultaneous. In Table 1, the statistical properties of simultaneous and non-simultaneous FD events are summarized. During the main phase of these FD events, the average change in intensity of cosmic rays was −6% and −4% for simultaneous and non-simultaneous FD events, respectively. The results from the t-test show that this difference between the two kinds of events is statistically significant. However, the difference between the durations of the main phases of the two kinds of FD events was almost negligible.
[Table 1.] Statistical properties of simultaneous and non-simultaneous FDs

Statistical properties of simultaneous and non-simultaneous FDs
Fig. 1 shows the cosmic-ray-intensity profile of a simultaneous FD event recorded at the NM stations of Climax, Jungfraujoch, and Irkutsk on 24 March 1991. The main phases of the FD event recorded at each NM station overlapped on the cosmic-ray-intensity profile based on UT, regardless of the locations of the NM stations (Fig. 1a). Fig. 1b shows the cosmic-ray-intensity variation of three NM stations based on LT. As the local time of each NM differs, the main phases of the FD did not overlap, due to the time difference.
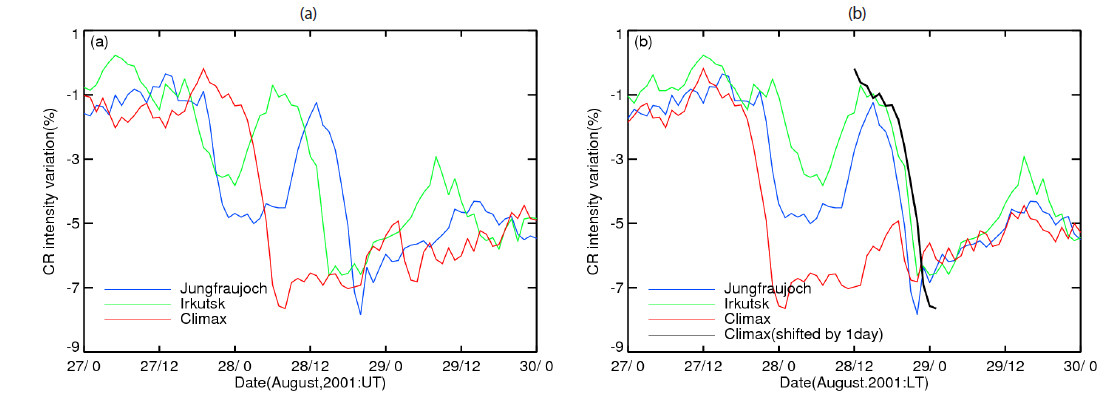
Fig. 2 shows an example of a non-simultaneous FD event that occurred on 28 August 2001. While the main phases of FD on the cosmic-ray-intensity profile did not overlap in UT (Fig. 2a), it was found that the main phases of the FD event overlapped in LT, regardless of longitude, as shown in Fig. 2b. The black solid line in the figure represents the profile of Climax shifted one day ahead and it is clear that the shifted profile, and the two other profiles, agree based on LT. This phenomenon is caused by the differences in time imposed by the different longitudes of the three neutron monitors.
Fig. 3 shows the change in cosmic ray intensity, and the distribution of onset times of main phases, for FD events recorded at Climax NM, based on LT. The radial component of the polar coordinate indicates the absolute value of the intensity of cosmic rays, and the angular component represents the onset times based on LT. While the distribution of the onset times of simultaneous FD events was spread over 24-hour intervals (day and night), those of non-simultaneous FDs mostly spread over 12-hour intervals, during the day.
This behavior also showed up in the data of the Irkutsk and Jungfraujoch NMs. In the case of non-simultaneous FDs, because the change in cosmic ray intensity during the main phase is less than that of simultaneous FDs, the change is more clearly affected by diurnal variation in the cosmic ray intensity (1–2%). Therefore, when the maximum diurnal variation of cosmic ray intensity occurs in the daytime, and the onset time of weak FDs overlap, it is observed as an FD. Thus, for non-simultaneous FDs, which are generally weak, onset times are restricted to daytime (Oh et al. 2008). The distribution characteristics of main-phase onset times found through statistical analysis are shown in Table 2.

Distribution of the local onset times of both types of FDs by Fisher’s exact test and Chi-square statistic test of the data from the Climax NM
Table 2 shows the result of the Fisher exact test to determine the statistical difference in the onset-time distribution of main phase for non-simultaneous FD events. This test directly calculates the probability based on hypergeometric distribution obtained using the number of simultaneous and non-simultaneous FD events, by dividing the onset times (LT) of main phase into day and night. For Climax NM, the probability that the onset times of simultaneous and non-simultaneous FD events would be distributed evenly over 24 hours (day and night) is 0.01 % (Chi-square test, 0.04%) according to the result of the Fisher exact test. In other words, simultaneous FDs and non-simultaneous FDs have different distributions in their onset times, with 99.99 % probability. To sum up, while the onset times of simultaneous FD events (strong FDs) are largely unaffected by the diurnal variation of cosmic rays, the main phase onset times of non-simultaneous FDs (weak FDs), are typically restricted to the 12 hours of daytime, due to effects from the diurnal variation of cosmic rays.
In this paper, we reported the results of our study of FD events recorded on neutron monitors at middle-latitudes (Climax, Irkutsk, and Jungfraujoch) from 1971 to 2006. There were classified into simultaneous and non-simultaneous FD events using overlapping main phases on the cosmic ray intensity profile, based on UT. During the period of analysis, 220 FD events occurred, 167 of them were classified as simultaneous, and the others (53) were classified as non-simultaneous. Based on these statistics, the properties of simultaneous and non-simultaneous FD events can be characterized as follows. First, the change in cosmic ray intensity is larger in simultaneous FD events, than in non-simultaneous FD events. Second, while the main-phase onset times of simultaneous FD events are distributed evenly over 24-hour intervals (day and night), those of non-simultaneous FD events are distributed mostly within 12-hour intervals, in daytime. In other words, non-simultaneous FD events, which are weak FDs, are affected by the diurnal variation of cosmic rays.
The comparison of our work to the results of Oh & Yi (2009), who analyzed the properties of simultaneous and non-simultaneous FD events recorded at high-latitude NMs, provided the following results. The scale of FDs (the change in intensity of cosmic rays during main phase) is about 1% greater at high latitudes than that at middle latitudes, and the duration of main phase is five hours longer at high latitudes. This can be explained by the difference in the energy of incident cosmic rays in relation to the geomagnetic latitude of the NM recording them. The higher the latitude, the greater is the intensity of low-energy cosmic ray particles. Hence, the shielding effect of magnetic barriers generated by IP shocks and magnetic clouds is larger. Regardless of geomagnetic latitude, the scales of simultaneous FD events are greater than those of non-simultaneous FDs. Moreover, the onset times of main phase for non-simultaneous FD events occur mostly in the daytime, indicating that this is a general characteristic of this type of FD event.
As cosmic rays incident on the Earth are affected by geomagnetic fields, the intensity of cosmic rays observed at high-latitude and middle-latitude NMs, varies in relation to latitude. In future investigations of the properties of simultaneous and non-simultaneous FDs, NM data with cutoff rigidity greater than 10 GV, recorded at low-latitude NMs, will be used for statistical analysis.