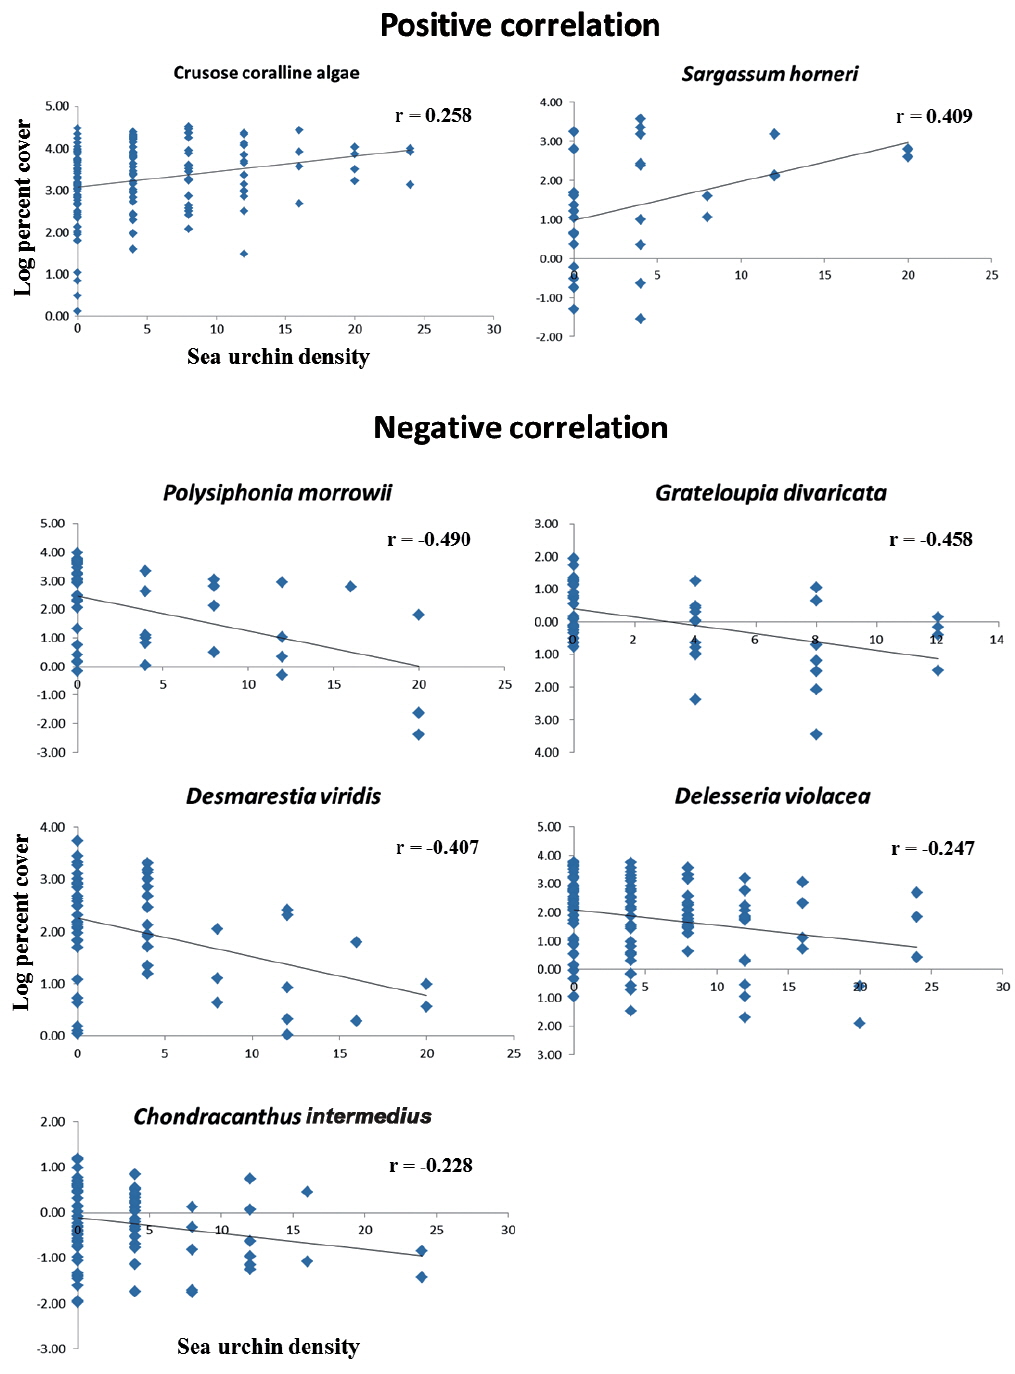
Urchin barrens have been a major issue of rocky coastal ecosystems in temperate regions. In South Korea, the east coast and Jeju Island have especially been a focus because the area of barren ground increases in spite of continual efforts to install artificial reefs. This study approached the urchin barrens issue in South Korea, by focusing on a correlational analysis of urchin and macroalgal abundance. Urchin density and algal species coverage were obtained using a quadrat image analysis. Subtidal sites were then classified into three groups according to the average densities of urchins to evaluate the characterization of the macroalgal community: no urchin (NU) zone; transition (TR) zone, 4 inds. m-2; and urchin (UR) zone, ≥8 inds. m-2. The average urchin density in the study site was 4.7 inds. m-2 and 57 macroalgal species were found in the study site. From the NU zone to UR zone, total species number, species diversity index and evenness gradually decreased, whereas the dominance index increased. The algae species with negative correlations were Grateloupia divaricata, Polysiphonia morrowii, Chondracanthus intermedius, Delesseria violacea, Desmarestia viridis; and those with positive correlations were the crustose corallines, Sargassum horneri. Other species were not significantly correlated with urchin density. The significant correlations indicate that the abundance of some macroalgal species is proportionally regulated by sea urchin density. This study also shows how macroalgal vegetation changes in response to an urchin’s density gradient in a natural condition; and there is a TR zone that existed with respect to an intermediate level of algal abundance.
Urchin barrens have been a major coastal environmental issue in temperate regions (Klumpp et al. 1993, Guidetti and Dulčić 2007, Privitera et al. 2008, Agnetta et al. 2013). Various factors have been raised for the reasons of the barren ground phenomena, such as climate changes, marine pollutions, intensive herbivory, etc. (Arai and Arai 1984, Watanabe and Harrold 1991). Regarding herbivory actions, a magnitude of sea urchin density has been closely related with the severity of barrens in many parts of coastal beds (Mann 1982, Guidetti and Dulčić2007, Privitera et al. 2008, Agnetta et al. 2013).
In general, the standing biomass of erect and fleshy macroalgae is low where urchins remain in a substantial density, and sometimes algal-rich beds have distinctively separated from those barren spots, even though the distance is only a few meters (Choat and Schiel 1982, Mann 1982, Dean et al. 2000, Wright et al. 2005, Stewart and Konar 2012). Despite strong grazing pressure, insufficient food supply has been proved in those biologically unprotected habitats because of low recruitment success and high mortality of young thalli (Harrold and Reed 1985, Agatsuma 2007, Yoo et al. 2007). Hence, the pattern often persists for a long time. Nevertheless, with regard to sea urchins distributional patterns, they tend to be gregarious in those barren spots with little food (Mann 1982, Vadas et al. 1986, Nakabayashi et al. 2006, Guidetti and Dulčić 2007, Stewart and Konar 2012); this leads to some further questions. Is it a group protection from predators? A good shelter from wave action? A certain behavioral pattern of sea urchins? (Mann 1982, Vadas et al. 1986, Dean et al. 2000, Dumont et al. 2006, Stewart and Konar 2012, Morse and Hunt 2013). Vadas (1977) and Mann (1982) claimed that macroalgae-herbivore interactions have led to important adaptations and strategies by both the sea urchins and algae, emphasizing algae’s temporal (e.g., short-lived) and spatial (e.g., patchy) escape and urchin’s efficient search and mobility for available prey. From another point of view, Agnetta et al. (2013) explained that sea urchin grazing often determined the formation and maintenance of two alternative states (coralline barrens and erect algal forests) of a macroalgal community in temperate rocky reefs. However, except for many researches dealing with urchin’s feeding experiments, field distributional patterns of sea urchins and their prey are still remained quite conceptual.
This non-manipulative experiment was carried out to understand the relationship between macroalgal abundance and sea urchin density in a natural habitat, where both coralline barrens and an erect algal forest exist with a transition zone between the two types. The present study provides a layout of the natural field conditions and further questions on feeding patterns and behavior of urchins in the particular barren subtidal habitat.
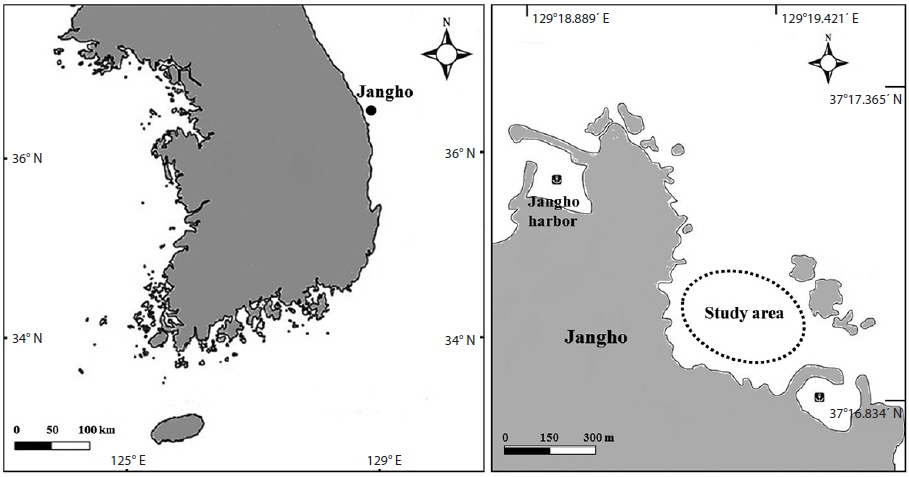
The study site is located in Jangho village, Samcheok City, Gangwon Province, South Korea (37°17.025ʹ N, 129°19.358ʹ E) (Fig. 1). The subtidal zone (6-10 m in depth) of this area, where the experiment was conducted, represents a typical urchin barrens habitat on the east coast of South Korea. The field data were collected from April 12 to May 23, 2013, using by means of SCUBA diving. Two species of sea urchin,
The ratio of the relative percent coverage of crustose coralline algae and erect foliose algae is 60 : 40 in average, with more foliose algae appearing in the shallower zone and more corallines in the deeper zone (Jeon 2013). The sea urchin density and macroalgal percent cover were obtained from a random quadrat (0.5 m × 0.5 m, n = 170), using a transect line marked with random points, which was placed along the urchin density gradient. The subdivided areas (0.25 m × 0.25 m) of a quadrat were photographed and analyzed for the quantification of organisms using an image-analyzing program (Image J, National Institute of Mental Health). The algal percent cover and urchin density and size were obtained via an analysis of the images. Additional photos were taken to better estimate the percent coverage of understory species where canopyforming macroalgae were predominant in the quadrat. An individual entity appearing on the border was taken into account if 50% of its holdfast was inside of a quadrat; the same rule was applied to sea urchins.
To examine the difference in the macroalgal assemblage according to urchin density gradient, we divided the habitat into 3 zones: 1) no urchin zone (NU zone): no sea urchin found; 2) transition zone (TR zone): average 4 inds. m-2; and 3) urchin zone (UR zone): ≥8 inds. m-2. Then, there was a comparison of the number of algal species, percent coverage of each macroalgal species, diversity (Hs = -∑
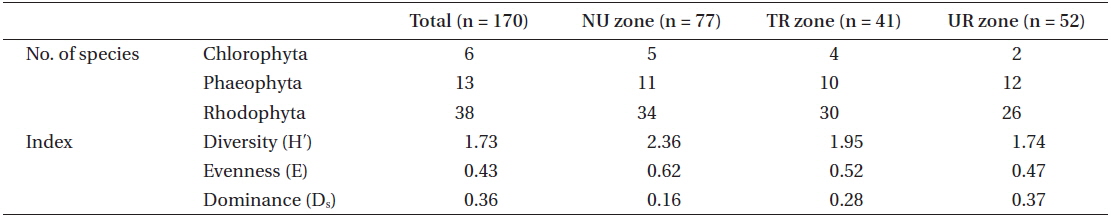
A total of 57 macroalgal species were found at the study site of the Jangho subtidal area: 6 Chlorophyta, 13 Phaeophyta, and 38 Rhodophyta. The indices of species diversity, evenness, and dominance were 1.73, 0.43, and 0.36, respectively (Table 1). The average density of sea urchins was 4.7 inds. m-2, consisting of 3.5 inds. m-2 for
[Table 1.] Macroalgal community characteristics and number of species in the 3 urchin zones

Macroalgal community characteristics and number of species in the 3 urchin zones
With regard to the three urchin zones, the NU zone had the highest number of macroalgal species, which was 50 species that was composed of 5 green, 11 brown, and 34 red, followed by the TR zone (44 species with 4 green, 10 brown, and 30 red), and the UR zone (40 species with 2 green, 12 brown, and 26 red). The NU zone also had the highest index value in species diversity (2.36) and evenness (0.62), followed by the TR zone (1.95 and 0.52, respectively) and the UR zone (1.74 and 0.47, respectively). However, the dominance index showed the opposite pattern; 0.37 for the UR zone, 0.28 for the TR zone, and 0.16 for the NU zone (Table 1).
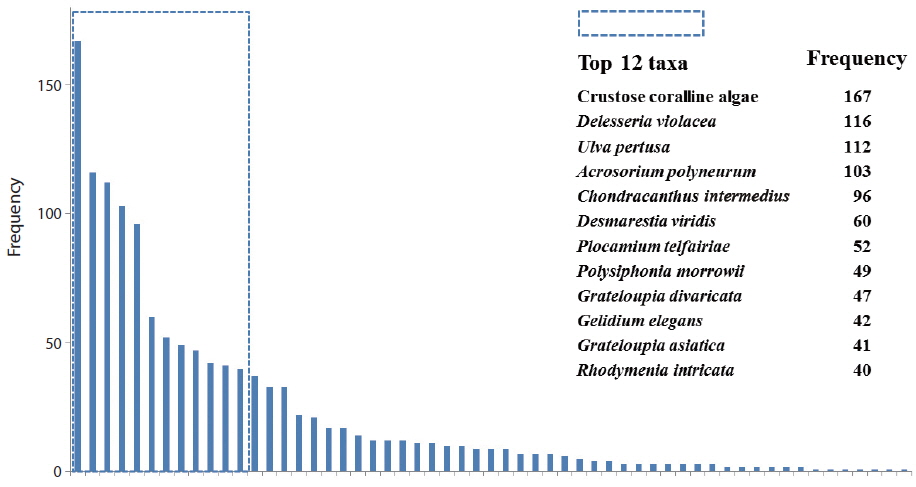
The relative frequency of macroalgal species was calculated, based on the field data from the total 170 quadrats surveyed (Fig. 2). Twelve species, of the 57 species, appeared in >40 quadrats. Crustose coralline algae (167 quadrats) showed the highest frequency, followed by
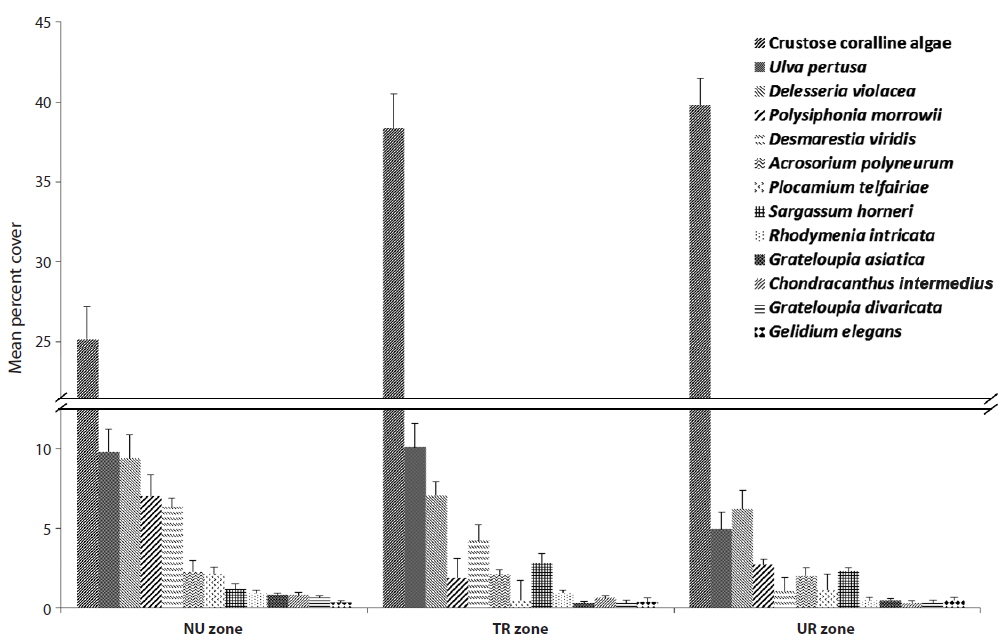
Among the species with higher frequency ranks from each urchin zone, crustose coralline algae had 25.15% coverage in the NU zone, but they increased up to 40% in both the TR and UR zones (Fig. 3).
Table 2 summarizes various changes in percent coverage at the algae species-level, along with urchin density gradient, regardless of the three zonation schemes. Crustose coralline algae showed an even distribution (around 40% coverage), except for the no urchin condition. Some foliose species (e.g.,
[Table 2.] Mean percent cover (±SE) of major algal species along with the urchin density gradient
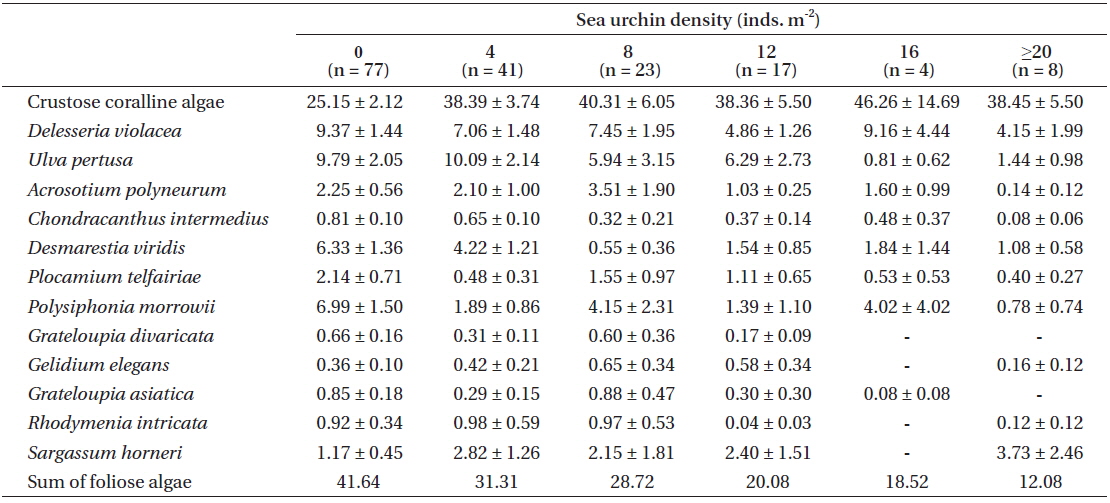
Mean percent cover (±SE) of major algal species along with the urchin density gradient
Correlational analyse revealed that seven algal species showed a significant relationship between algal coverage and urchin density. Crustose coralline algae and
The study area has been frequently investigated by other researchers (Choi et al. 2006, Shin et al. 2008
As hypothesized about the 3 zonation category of urchin density in this study, the macroalgal species diversity and the mean coverage decreased as urchin density increased within the field survey scale of ~40,000 m2 . This study did not manipulate the sea urchin density and distribution during the study, but nevertheless this negative correlation could be deduced by considering sea urchin’s slow moving speed about 4 cm m-1 (Morse and Hunt 2013), relatively narrow home range of mean 0.40 to 1.72 m d-1 (Harrold and Reed 1985, Dumont et al. 2006), and habitat limitation that is confined to rocky beds (Agatsuma 2007). However, taking into account the urchin’s nocturnal foraging behavior, further investigations are still needed about their timely (i.e., hourly) moving patterns and behavior in the field, especially because this SCUBA survey was only done in the daytime.
In many temperate regions, the rocky subtidal areas are often distinctively separated into macroalgal beds and urchin barrens, and thus much more urchins are found in barren grounds. This phenomenon has been known as a defensive behavior of sea urchins against predators (Mann 1982, Vadas et al. 1986, Stewart and Konar 2012). However, since there seems no natural predators (such as sea otter, sheephead fish, crab, lobster, etc.) of sea urchins, except starfish, on the east coast of South Korea, it is assumed to be a certain kind of foraging-related behavior, rather than defense. The gregarious tendencies of adult sea urchins in barren ground could be either an after-feeding phenomenon on foliose macroalgae or an on-going feeding stage of other types of foods, such as crustose coralline algae, filamentous algae, or capsulated eggs. If the former is the case, then further questions arise: Why do they crowd in the foodless spot of barren ground? Why don’t they move to food-rich algal beds nearby? Do they move to algal beds at night time and come back? No clear answers or evidence have yet been suggested.
The results of the urchin’s feeding preference tests in previous studies indicate that sea urchins usually prefer brown algae to other macroalgal groups (Vadas 1977, Seymour et al. 2013). However, a gut analysis of sea urchins, collected from natural habitats, revealed that there was a similar ratio of food contents between major preferred food species and crustose coralline algae (Vadas 1977, Harrold and Reed 1985, Lee et al. 1998, Nakabayashi et al. 2006, Seymour et al. 2013). Although some differences exist, depending on the sea urchin species and location, it is obvious that sea urchins do consume crustose coralline algae in substantial amounts. In the results of this study,
Extensive researches have been carried out to understand the sea urchin’s feeding preference by selectively supplying a food choice (Vadas 1977, Kim et al. 2007, Seymour et al. 2013), as well as gut analyses (Lee et al. 1998, Kim and Jang 2012). In addition to those studies, this research could be meaningful in clarifying some component species in the macroalgal community that gradually decreased as urchin density increased in a natural condition, vice versa. Furthermore, this study provides an answer as to how macroalgal vegetation changes in response to a density gradient of urchins; and there is a transition zone (TR zone) that existed with respect to an intermediate level of algal abundance. However, there are still unanswered questions. For those 5 species (