Ecklonia cava Kjellman is a common kelp found in shallow subtidal in warm-temperate waters in the northwest Pacific Ocean. This species has shown substantial morphological variation along with subsistence in different locations and local environments. We quantified the magnitude of morphological variation of E. cava from six populations along ~700 km of coastline from Jeju Island to Dokdo in Korea. In addition, we examined genetic distance among the populations using random amplified polymorphic DNA (RAPD) analysis. Most morphological characteristics investigated were significantly different among locations. Multivariate analyses indicated two phenetically distinct groups (nearshore, sheltered vs. offshore, exposed), indicating wave exposure with turbidity are presumably major factors for the separation. With RAPD data, results of Nei’s diversity (H) and AMOVA showed considerable variations in within- and between-populations. Pair-wise ΦST and Nm values indicated moderate gene flow between the six locations. Results of Nei’s analysis revealed three genetically distinct groups, not consistent with the morphological groupings, indicating that a time gap may exist between morphological and genetic variations. This study also suggests dispersal distance of this kelp may be longer than what is commonly thought and genetic similarity in the populations was largely reflected by the direction of ocean current rather than just geographical distance.
Within its geographic range,
Random amplified polymorphic DNA (RAPD) is a method that reveals genetic variability within a species and elucidates differences at the population level in diverse marine plants such as microalgae (Gómez and González 2001, 2004), seagrasses (Larkin et al. 2006), and seaweeds (Bouza et al. 2006). The strengths and weaknesses of RAPD method have been widely debated (e.g., Hadrys et al. 1992, Sunnucks 2000). Although some re-searches have been performed (e.g., Van Oppen et al. 1996, Coyer et al. 1997), the use of RAPD for small-scale geographical research is inadequate and, when a large number of markers are included and the analysis is restricted to taxa in which band homology assessments are confidently made (conspecific populations). The results of RAPD assessments may be successfully incorporated into evaluation of inter- and intrapopulation differentiation of natural populations (see reviews in Bouza et al. 2006).
Our preliminary surveys for
Sporophytes of

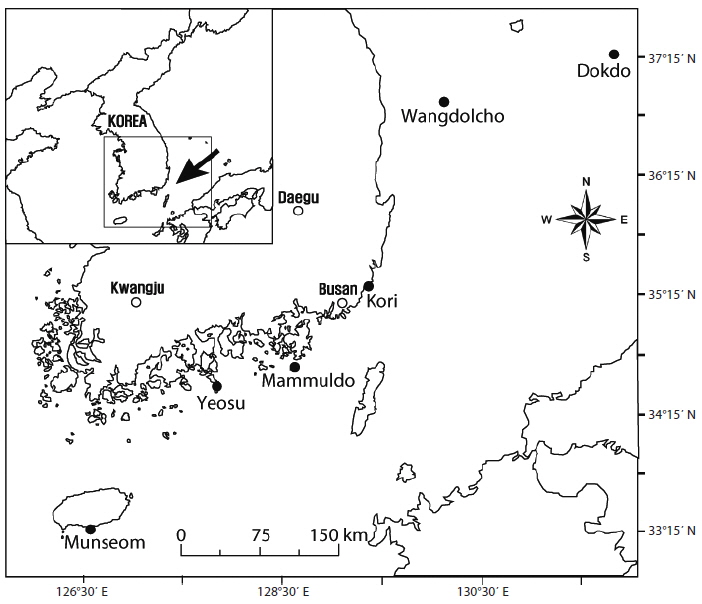
Sampling locations
>
Morphological characteristics
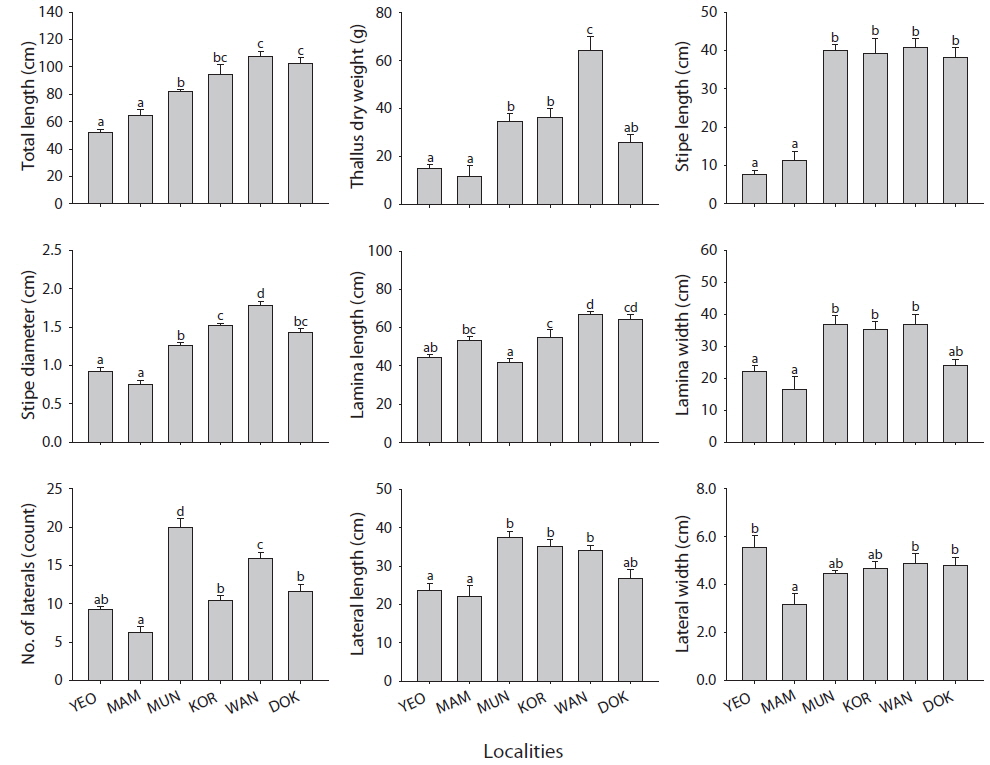
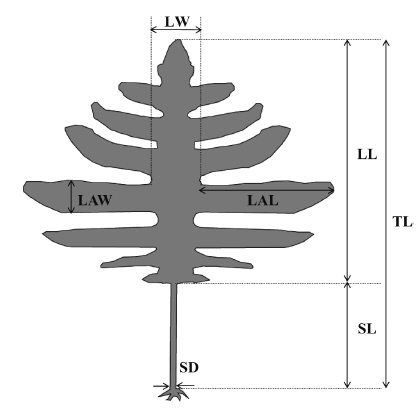
Nine common morphological parameters were measured for each thallus (Fig. 2). Morphological measurements includes total length, thallus dry weight, stipe length, stipe diameter (at the point of immediately above holdfast), lamina length, lamina width (mid-1/3 of the central lamina), number of laterals, lateral length, and lateral width. All measurements were done for 16-20 mature individuals (per location) sampled only in the spring from all six locations.
>
Genomic DNA extraction and RAPD assay
The 16-20 sporophytes collected at each location were used for RAPD analysis. Frond disks (25 cm2 ) placed on the mid-2/3 of the central lamina were cut, washed with 1% sodium dodecyl sulfate in distilled water and then blotted dry. Each sample was preserved with silica gel in the dark until used.
DNA was extracted from 200 mg of sample frond tissues ground in liquid nitrogen in a sterile mortar with a pestle. All extractions used the Pharmacia-Biotech kit (Accuprep Genomic DNA Extraction Kit; Bioneer Inc., Daejeon, Korea) according to the manufacture’s instructions. DNA samples were quantitated using a NanoDrop ND-1000 Spectrophotometer (NanoDrop Technologies, Wilmington, DE, USA), also according to the manufacture’s instructions.
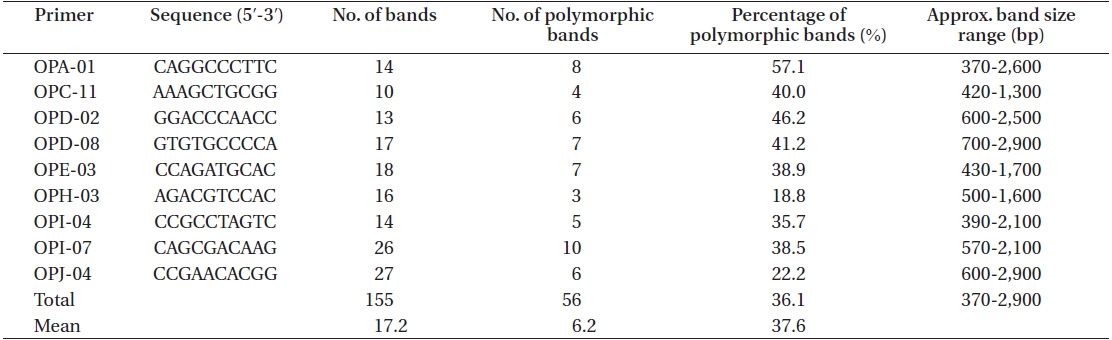
All samples were initially screened with 200 random, decamer primers (10-mer kits A-J; Operon Technologies Inc., Huntsville, AL, USA) to check their ability to generate reproducible, informative DNA amplification products. For each sample and primer, duplicate reactions and reactions with DNAs extracted independently from the same sample were used.
DNA amplification reactions were performed in 20 μL volumes containing 2.5 μL of 10× polymerase chain reaction (PCR) buffer, 2 μL of deoxyribonucleoside triphosphate (dNTP) mixture (TaKaRa Bio Inc., Otsu, Japan), 0.5 μM of the primer, 1 ng of genomic DNA, 1 unit of Taq DNA polymerase (TaKaRa Bio Inc.) and distilled water. Amplifications were run in PTC-200 PCR System (MJ Research, San Francisco, CA, USA) and gave optimal bands with an initial denaturation step of 94°C for 5 min followed by 40 cycles of 94°C for 0.5 min, 40°C for 0.5 min, 72°C for 1 min and finally, 72°C for 5 min, and stored at 4°C. The concentration of DNA used was found to be optimal with respect to reproducibility and minimization of secondary ghost banding (technique background). Reaction mixes without DNA were run as blanks in all RAPD amplifications. Nine primers gave optimally reproducible polymorphic bands and were thereby selected for further analysis. Amplification products were resolved by 1.5% agarose gel electrophoresis in TBE buffer (45 mM Tris-Borate and 1 mM EDTA) and visualized under ultraviolet light after ethidium bromide staining. Gels were photographed using a Kodak EDAS 200 digital camera documentation system (Kodak, New Haven, CT, USA).
To test whether each morphological character of
For RAPD analysis, only reproducible and distinctively well-resolved bands were scored for resolving. The presence of a band was scored as 1 and absence was scored as 0. After scoring, a matrix of RAPD phenotypes was then assembled across all individuals and locations. For each location, the gene diversity, measured as the expected heterozygosity (
To estimate components of variance among and within locations, gene frequencies were analyzed using a nested analysis of variance (analysis of molecular variance, AMOVA) (Excoffier et al. 1992). AMOVA allowed us to assess the partitioning of RAPD variation and sporophytic populations of
The gene flow (Nm, the number of migrants per generation) (Whitlock and McCauley 1999) was approximated as

, where ΦST values were available from a matrix of pair-wise combinations produced by Arlequin ver. 3.0 software.
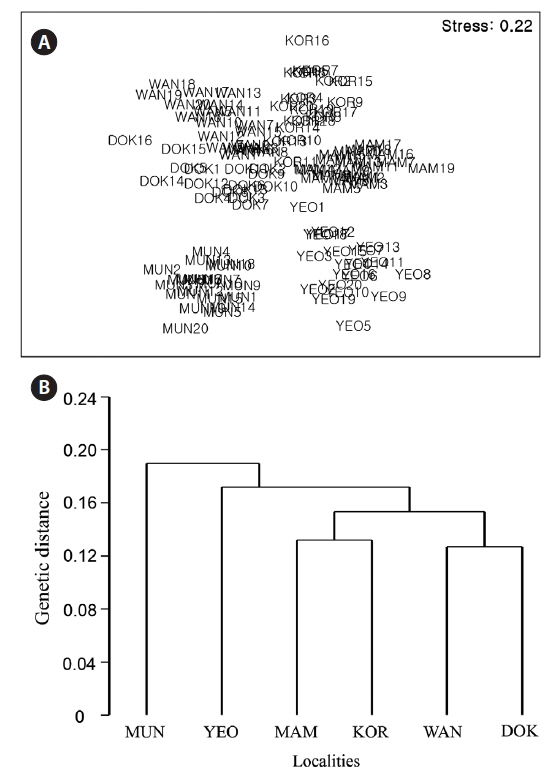
A genetic similarity dendrogram among locations was constructed using the matrix of pair-wise Nei’s genetic distances calculated from the program POPGENE 1.32 and the unweighted pair-group method with arithmetical averages (UPGMA) (Sneath and Sokal 1973) algorithm. Data were also represented graphically in nMDS plots using a Euclidean distance matrix based on the presence / absence data set on RAPD bands. nMDS was done using PRIMER v5.
To test whether the magnitude of genetic difference was a function of distance between locations, the genetic distance (ΦST) matrix and an among-location distance matrix generated from GPS co-ordinates (cf. Table 1) were analyzed using a Mantel test (Mantel 1967). In addition, we also conducted the Mantel test to test the significance of the correlation between the genetic distance (ΦST) matrix and a Euclidean distance matrix generated from the morphological data set pooled within each location. All Mantel tests were done using the software Arlequin ver. 3.0.
>
Spatial variability of morphology
All morphological characteristics investigated were significantly different (one-way ANOVA, p <0.005) among locations (Fig. 3). In most morphological parameters, except lamina length, No. of laterals, and lateral width, Yeosu and Mammuldo showed significantly lower values than Munseom, Kori, Wangdolcho, and Dokdo (Turkey’s multiple comparison, p < 0.05). In addition, most morphological characteristics showed considerable variation among locations. For example, total length differed by 49% between the means of the most extreme populations Wangdolcho and Yeosu. Similarly, there was 23% dry weight difference between the thallus biomass of individuals from Wangdolcho and Yeosu. Thallus dry weight was the most variable characteristics (coefficient of variation [CV] = 61%), whereas lateral width was the least variable one (CV = 17%).
Most morphological characteristics were moderately to highly correlated to each other (0.5 < r < 1.0) (Table 2). For example, total length was highly correlated to stipe length, stipe diameter, and lamina length (r > 0.8), and this could be somewhat expected as total length is the sum of stipe length and lamina length. In contrast, thallus dry weight was correlated to stipe diameter, lamina width, and lateral length with the value of r> 0.7, suggesting that total length should not be a good single factor to scale the allometry of thallus biomass of
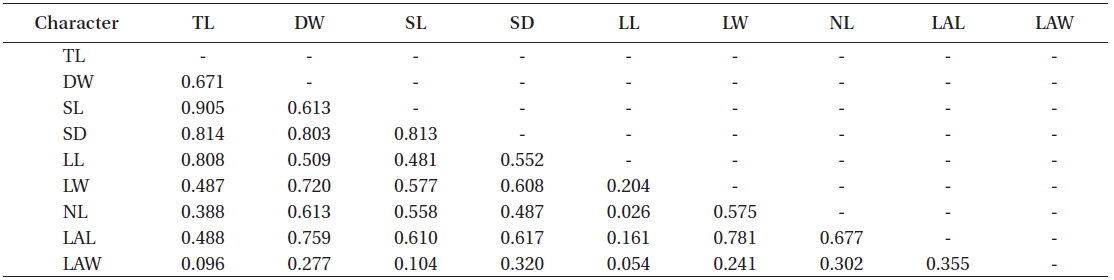
Correlation coefficients (Pearson product moment correlation) among the morphological characters on all the sampled individuals
The nMDS ordination based on all morphological characteristics (Fig. 4A) showed large separation (high dissimilarity) among locations (e.g., Wangdolcho and Yeosu) and very small separation (high similarity) among other locations (e.g., Yeosu and Mammuldo). There were also considerable within-location separations in a few places (e.g., Wangdolcho and Kori). In the dendrogram, the six locations were sharply separated into two groups (Yeosu and Mammuldo vs. Munseom, Kori, Wangdolcho, and Dokdo) (Fig. 4B).
Stipe length was by far the most important morphological parameters, on accounting for ~19% of the dissimilarity in
[Table 3.] SIMPER results on the two groups (YEO and MAM vs. MUN, KOR, WAN and DOK)
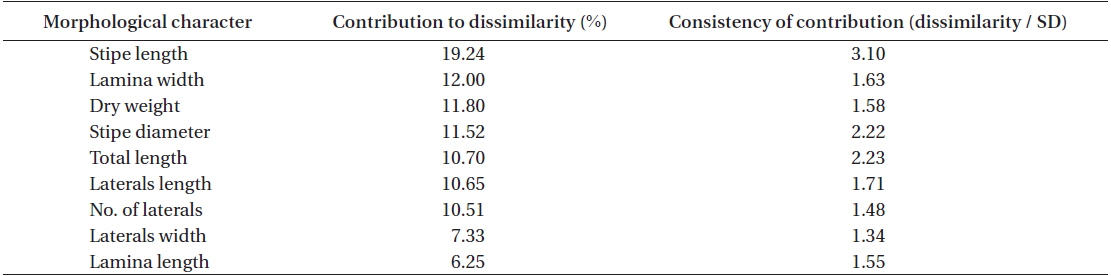
SIMPER results on the two groups (YEO and MAM vs. MUN, KOR, WAN and DOK)
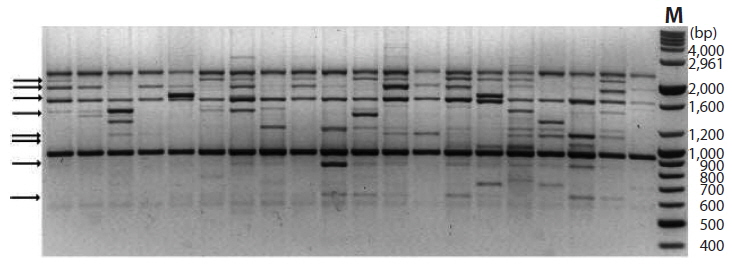
A total of 155 discernible and reproducible RAPD bands were generated with 9 selected primers across the 116 individuals of six locations, out of which 56 (36.1%) were polymorphic (Table 4). The bands ranged in size from 370 to 2,900 bp. Number of bands produced per primer ranged from 10 to 27 with an average of 17.2, and that of polymorphic bands per primer lied between 3 and 10 with an average 6.2. Fig. 5 shows the RAPD profile of 20 individuals amplified with primer OPA-01.

Primer sequence, number of bands per primer, number of polymorphic bands per primer, and the approximate band size range
Primers varied in their capability to detect variation within each location, with
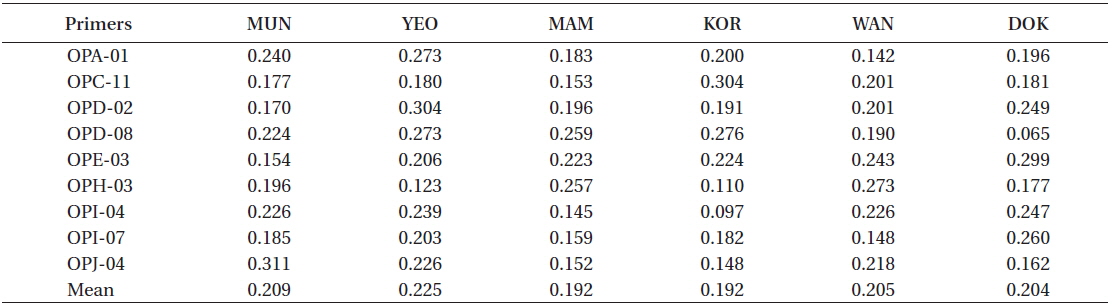
RAPD diversity (H)
The variance components of within and between locations detected with AMOVA were 65.8% and 34.2% of the total variance, respectively, which were both significant at a probability less than 0.001 (Table 6). Hence, it seems clear that while most of the variation is partitioned within populations, there is still considerable variation between populations.
[Table 6.] AMOVA for the six locations using 155 RAPD bands
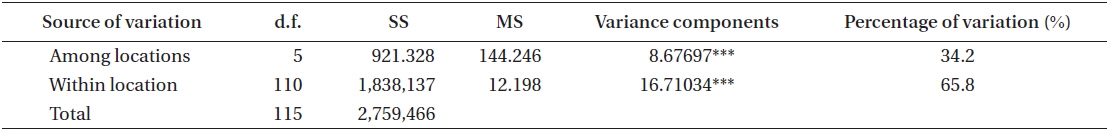
AMOVA for the six locations using 155 RAPD bands
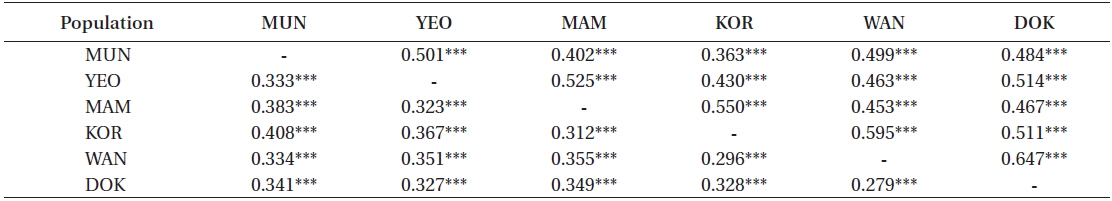
A matrix of pair-wise ΦST values, the significance and the effective number of migrants (Nm) between populations are presented in Table 7. Values of ΦST ranged from 0.279 (between Wangdolcho and Dokdo) to 0.408 (between Munseom and Kori) and were all significant at 0.001 level, suggesting that all locations may be considered different from each other, with Munseom and Kori being the most different from the others and Wangdolcho and Dokdo being the most similar. Values of Nm ranged from 0.363 to 0.647, but the majority of the values lied between 0.4 and 0.6, which indicated a moderate gene flow between the six locations.
[Table 7.] Pair-wise ΦST (below diagonal) and Nm (above diagonal) between the six locations

Pair-wise ΦST (below diagonal) and Nm (above diagonal) between the six locations
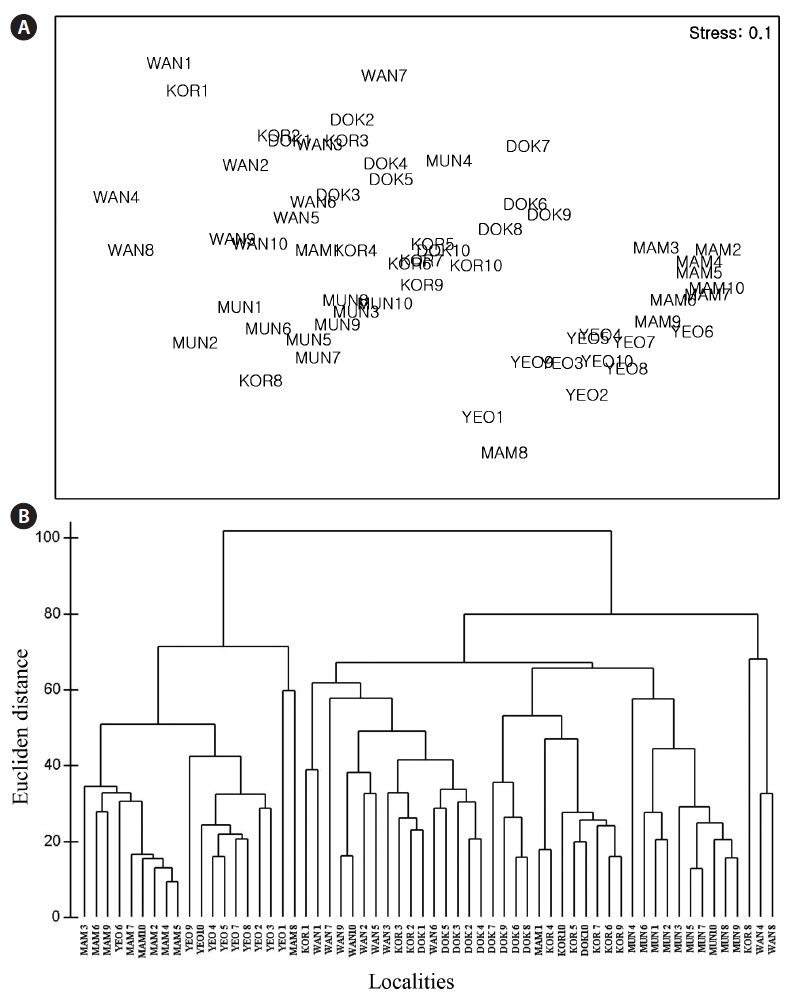
The nMDS ordination based on the RAPD presence / absence data (Fig. 6A) showed large separation (high dissimilarity) among locations (e.g., Wangdolcho and Munseom) and very small separation (high similarity) among other locations (e.g., Wangdolcho and Dokdo). In the dendrogram based on Nei’s genetic distances, the six locations were distinctively separated into three groups (Mammuldo, Kori, Wangdolcho, and Dokdo vs. Munseom vs. Yeosu) (Fig. 6B).
There was no correlation between genetic distance (ΦST) and geographical distance between locations (Mantel test, r = 0.24, p = 0.18). Likewise, the correlation between genetic distance (ΦST) and morphological dissimilarity between locations was not significant (Mantel test, r = 0.27, p = 0.17).
Our quantitative multivariate analyses indicated that, when all the morphological parameters were considered, a distinct hierarchy to the morphological variation. Stipe length was identified as the parameter most responsible for the hierarchical structure. Two phenetically distinct groupings of plants exist, one group with shorter stipe (Yeosu and Mammuldo) and the other with longer stipe (Munseom, Kori, Wangdolcho, and Dokdo). Such phenotypes of
Substantial morphological variation is a common phenomenon in kelp species (Lubchenco and Cubit 1980, Camus and Ojeda 1992, Serisawa et. al. 2002
RAPD markers, along with appropriate statistical procedures, are suitable for genetic variation analyses at both intra- and inter-population levels (e.g., Faugeron et al. 2001, Bouza et al. 2006, Larkin et al. 2006). In the present study, the marker technology has been employed in combination with morphological characteristics to detect genetic variation and population structure of
Genetic variation and partitioning among and within populations of a plant species are determined by a number of factors, of which reproductive biology system (outcrossing vs. self-fertilization) is most important (Hamrick and Loveless 1989). As shown by the AMOVA, the high level of RAPD variation in
The ordination based on the RAPD presence / absence data and the dendrogram based on Nei’s genetic distances indicate a distinct hierarchy to the genetic variation. Three genetically distinct groupings (Mammuldo, Kori, Wangdolcho, and Dokdo vs. Munseom vs. Yeosu) were recognized, not consistent with the quantitative multivariate analyses on morphological characteristics. Hence, no correlation was found between genetic distance (ΦST) and morphological dissimilarity between locations.
The environmental differentiations rather than genetic basis may be one reason for morphological variation. Morphological variation occurs over a broad range of physical environments (Sultan 2001). Within its geographic range,
The low correlation between locations is shown in many terrestrial pants such as tropical evergreen tree (Li et al. 2008), barley (Lund 2002), and potato (Veteläinen et al. 2005) and may be explained by the different molecular markers and morphological characteristics (Collignon et al. 2002, Navarro et al. 2005). Molecular markers are usually considered selectively neutral (Strauss et al. 1992) and do not necessarily reflect the diversity in functional characteristics (Karhu et al. 1996, Van Hintum and Van Treuren 2002). Furthermore, such a weak correlation implies the differences in the degree of genomic coverage between molecular markers and morphological characteristics (Veteläinen et al. 2005). Therefore, both morphological and molecular assays are comparably important in population diversity studies in
Likewise, there was no correlation between genetic distance (ΦST) and geographical distance between locations. Many studies (e.g., Miller et al. 2000, Roberson and Coyer 2004) have shown kelp to express genetic differentiation in response to differences in ocean climate. As pointed out by Rice et al. (1985), ocean climate is not continuously distributed in space over a large geographical scale. However, the genetic distance (ΦST) of the adjacent area populations were closer (e.g., Wangdolcho and Dokdo, Kori and Wangdolcho). This showed that ocean current in this area may also influence the dispersal of spores. As mentioned, Tsushima Warm Current (TWC) enters the South Sea from Jeju Island and moves eastward through the Korean Strait. And the cold shelf water originating from the Yellow Sea also enters the South Sea and moves eastward along the coast (Chang et al. 2000, Lee and Chao 2003). In fact, gene flow (Nm, the number of migrants per generation) was moving more in adjacent area populations (Table 7). Therefore, this RAPD data demonstrated that local populations of
In conclusion, we report the first assessment on the genetic diversity of