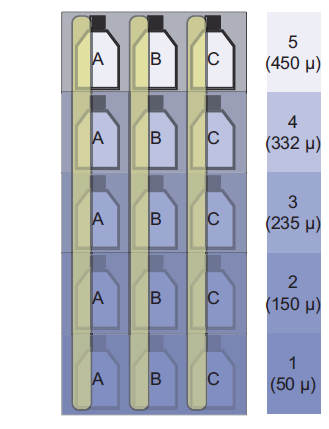
Photosynthetic rates of the large centric diatom Coscinodiscus granii were measured by means of multicolor variable chlorophyll fluorescence imaging, single cell 14C assimilation, and optical O2 sensor measurements during light acclimatization of cultures grown at five different irradiances: 50, 150, 235, 332, and 450 µmol photons m-2 s-1. Photo-acclimatization was evident from changes of cellular chlorophyll a content, growth rates, and light response curves. Each of the applied methods evaluates different parts and reactions in the photosynthetic apparatus, which makes a direct quantitative comparison of rates difficult, although a different degree of correlation were found between all three methods. However, when used in combination, they provide information about the internal relationship of photosynthetic pathways as well as the variation in photosynthetic capacity between individual cells within a single algal culture.
Aquatic photosynthesis is typically monitored as oxygen production determined by titration or with electrochemical or optical O2 sensors, uptake of dissolved inorganic carbon (DIC) with infra-red gas analyzers (IRGA), inorganic carbon fixation using radioactive or stable isotopes, or via variable chlorophyll fluorescence methods. All these methods have limitations and drawbacks, including assumptions on parameters in their calculation on photosynthetic activity (Falkowski and Raven 2007). The three most commonly applied techniques today are 1) inorganic 14C radiotracer fixation (Steemann Nielsen 1952), 2) O2 evolution (Qlark 1956, Pomeroy 1959, Delieu and Walker 1972), and 3) variable chlorophyll fluorescence (Papageorgiou and Govindjee 2004).
The 14C assimilation method for quantifying the photosynthetic inorganic carbon (DIC) fixation of phytoplankton was invented by Steemann Nielsen (1952). The method is based on the assumption that the uptake of added 14C-labeled DIC to the seawater is proportional to the uptake of unlabeled 12C DIC, when incubating a water sample in a closed container. Thus, knowing the initial DIC of a sample, the precise amount of 14C-labeled DIC added, as well as the amount of 14C incorporated in particulate organic matter during a known incubation-time, one can then calculate the rate of inorganic C fixation. As 14C is fixed by photosynthesis, some is also released again through respiration. Since the 14C assimilation method does not allow for simultaneous determination of respiration rates, it should thus be taken into account that only an intermediate value between gross and net photosynthesis can be obtained (Ryther 1955). Accordingly, the longer the incubation time, the higher the risk of underestimating gross 14C uptake, and potentially the same 14C molecule will pass through the cell several times. One should also be aware that heterotrophic respiration is also included in the measurements (Steemann Nielsen and Jensen 1957). This can be addressed by concentrating the phytoplankton biomass or increasing the amount of 14C added, as is done in the single cell version of the technique, and thus reducing the incubation time by increasing the phototrophic activity per volume of sample (Rivkin and Seliger 1981, Duarte and Ferreira 1997). One should also keep in mind the enclosed conditions in the flasks, “bottle effect,” which can lead to buildup of oxygen gradients in cases of low water movement or lack of stirring.
The O2 evolution method quantifies the net consumption / production of O2 in an incubated water sample over time. This can be done e.g., by simple Winkler titration (Strickland and Parsons 1972, Winkler 1888, Helm et al. 2009) of water samples taken at the beginning and end of incubation, or by following the change in O2 in the sample with an electrochemical or optical O2 sensor (Colman et al. 1998, Kühl 2005, Gloag et al. 2007, Woelfel et al. 2009). In recent years, especially optical O2 measurements have been applied for quantifying photosynthetic oxygen production in closed incubation containers equipped with a patch of an O2 sensitive fluorochrome on the inside, which can be monitored optically from outside; this alleviates the requirement for insertion of a probe into the incubation chamber (Warkentin et al. 2007, Woelfel et al. 2009, Cooper et al. 2011). There are several advantages of using optical O2 sensors: no O2 is consumed during measurements, and there is thus no stirring artifact in the measurements (Kühl 2005); they can also have a short response time, which makes them useful in experiments involving flow-through-chambers or other rapid changing conditions. However, one again needs to be aware of the potential “bottle effect”, as with the 14C assimilation method, in cases of low water flow or insufficient stirring. Another thing to keep in mind, especially during longer lasting experiments, is growth or sedimentation on the sensor surface. This can potentially lower their otherwise quick response time, or give false results. The O2 evolution method measures net O2 production or consumption in the incubation chamber and does not allow for measuring the respiration rate in the light, which is often assumed identical to the respiration in dark incubated samples. However, during measurements of a light response curve, light-dark shift measurements can be performed, thus measuring the net O2 production rate in light, as well as the post-illumination respiration rate in darkness. From such measurements, it is possible to estimate the gross photosynthetic rate (Beardall et al. 1994, Raven and Beardall 2003, Cooper et al. 2011, Kliphuis et al. 2011). Another potential limitation occurs when working with non-axenic cultures / samples, where it is difficult to distinguish between bacterial and phototrophic respiration.
Variable chlorophyll fluorescence measurements of photosynthetic activity are based on monitoring the fate of absorbed light energy trapped by the photosynthetic apparatus. Absorbed light energy can be dissipated through three pathways: emission of fluorescence from the photopigments, heat dissipation (non-photochemical quenching), and photochemical quenching driving the photosynthetic electron transport chain between PSII and PSI, which is linked to photosynthetic activity. Any change in the latter two dissipation mechanisms will affect the fluorescence emission causing a variable fluorescence yield, especially from PSII. Several techniques have been developed to assess the state of the photosynthetic apparatus by means of variable fluorescence (Papageorgiou and Govindjee 2004, Kromkamp et al. 2008, Suggett et al. 2011), two of which are often used in aquatic systems: 1) The so-called saturation pulse method (Schreiber 2004), which is based on the use of pulse-amplitude modulated (PAM) fluorometry that employ multiple turnover flashes of weak non-actinic measuring light, to assess the status of PSII from the changes in chlorophyll fluorescence yield,
Each of the above-mentioned methods evaluates different parts of the photosynthetic pathway, thus evaluations of photosynthetic capacity are established from different physiological responses. Consequently, each method displays a distinctive reaction to environmental factors, such as light and temperature, (Dubinsky 1980, Vavilin et al. 1994, Geel et al. 1997, Flameling and Kromkamp 1998, Morris and Kromkamp 2003). Many other studies have compared methods for measuring photosynthetic activity. Longstaff et al. (2002) showed deviation at higher irradiances between measurements of O2 evolution and ETR measured on macro algae. Demmig and Björkman (1987) found a strong correlation between O2 evolution and variable chlorophyll fluorescence measurements in leaves of terrestrial plants, and Genty et al. (1989) found a direct proportional relationship between CO2 assimilation and variable chlorophyll fluorescence measurements in terrestrial plants. However, only few studies to our knowledge have been done comparing all three methodologies commonly used in aquatic photosynthesis studies. Glud et al. (2002) found a reasonable linear correlation between O2 exchange measurements and 14C incubations measuring on ice algal communities, but their measurements of variable chlorophyll fluorescence showed non-linear relations at higher algal density. Hancke et al. (2008) found good correlations between the methods; O2 production, PAM, and 14C assimilation, according to relative responses to the effect of temperature on microalgae. Studies focusing on variation of photosynthetic performance between single cells in differently acclimated cultures are also very limited, however, see e.g., Gorbunov et al. (1999), Snel and Dassen (2000), and Ralph et al. (2005) for some examples.
The aim of this study was to investigate the correlation between the three most commonly applied techniques assessing photosynthetic performance, 14C incorporation, O2 evolution, and variable chlorophyll fluorescence measurements. To evaluate how the different photosynthesis measures correlate, we set up a light acclimatization experiment, exposing subcultures of the centric marine diatom
The complete experiment was repeated twice, i.e., there are two sub experiments, Exp. 1 and 2, for comparing the different methods. Exp. 1 was performed after a short acclimatization period of one week, while Exp. 2 commenced after an acclimatization period of five weeks. Due to contamination of a 14C stock solution in Exp. 1, comparison of all three methods has been limited to Exp. 2.
>
Algal culture and growth conditions
Cultures of
Subsamples of the
Cell abundance. All cells were gently resuspended in the culture flask by shaking, thereafter 1 mL subsample was transferred with a pipette to a 1 mL Sedgewick Rafter Counting Cell Slide (Graticules Ltd., Tonbridge, UK), placed on a compound microscope where cells were counted at 100× magnification. Each count was based on at least 400 cells, and cell counting was done in triplicate at all time points. The average cell count at each time point was used in the calculation of chlorophyll-specific photosynthetic parameters as described below. To estimate cells mL-1 at specific measuring days, we fitted a polynomial regression line to cell counts in cells mL-1 d-1. The growth rate (µ), was calculated from the change in cell numbers over time (d) as:

, where
>
Chlorophyll a (Chl a) measurements
Ten milliliter subsamples of each culture were filtered through a Whatmann GF/C filter by means of a vacuum pump, and the filters were transferred with a forceps to glass vials containing 10 mL ethanol (96%). The vials were then stored for 8 hours in darkness at 4°C for pigment extraction. After the extraction time, the vials were shaken and placed at room temperature for 1 h, and were then shaken again and spun down for 10 min at 4,000 rpm. The supernatant containing Chl
>
Variable chlorophyll fluorescence measurements
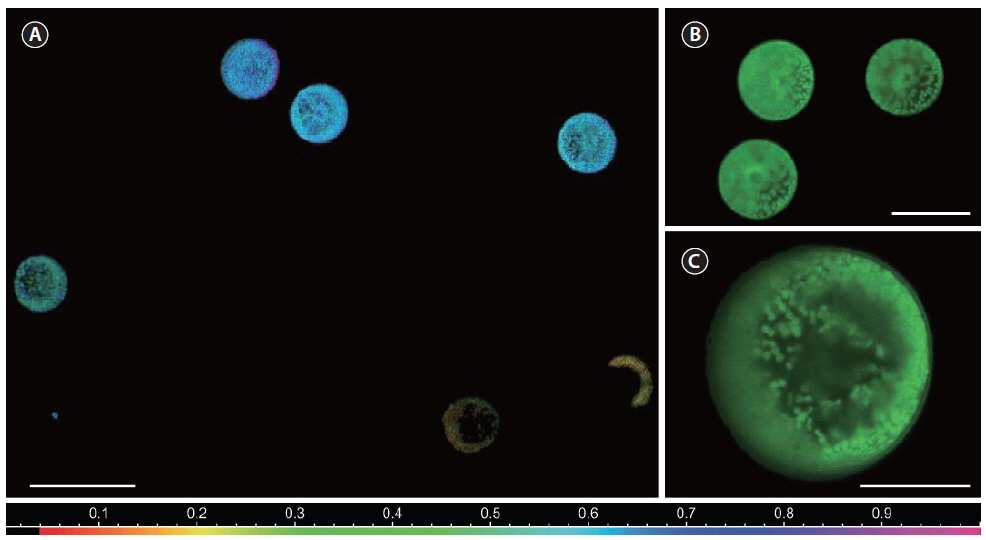
The photosynthetic capacity of individual cells in the culture samples was estimated as the rETR using variable chlorophyll fluorescence measurements with a new multicolor PAM microscope imaging system (RGB-ImagingPAM; Walz GmbH) (Trampe et al. 2011) controlled via a PC and the
Prior to measurements, subsamples were transferred with a pipette from culture flasks onto a microscope slide with a ~0.2 mm deep well, mounted with a cover slip, and placed on the microscope in a custom-built temperature controlled slide holder, set to 17°C (Trampe et al. 2011). After getting 4-12 cells in focus, using the halogen light-source build into the microscope covered by a 715- nm long-pass glass filter (RG715; Schott GmbH, Mainz, Germany), to avoid actinic effects on the sample during focusing, the sample was allowed to dark-adapt for 15 min before further measurements. The pulse-modulated measuring light was sufficiently weak (<0.5 μmol photons m-2 s-1) and therefore considered non-actinic during assessment of the minimal fluorescence yield,

, where K is a constant representing the distribution of light energy between PSI and PSII; here we assume K = 0.5, i.e., an equal distribution of absorbed light between the two photosystems.
RLC data from individual cells could then be analyzed, by defining areas of interest encircling whole
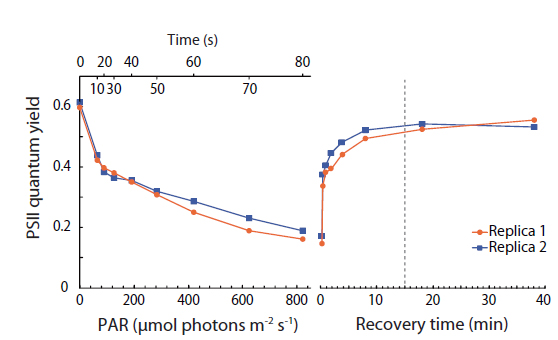
In order to determine sufficient dark adaptation periods for the I-PAM measurements, PSII quantum yield vs. irradiance curves were for all samples followed by time curves measuring the recovery of PSII quantum yield after return to darkness (Appendix 2). These measurements were performed with a small portable variable chlorophyll fluorescence analyzer (Junior PAM; Walz GmbH) connected to a PC running WinControl-3 Software (Walz GmbH). For measurements, measuring / actinic blue light at 450 nm was used to estimate Ф
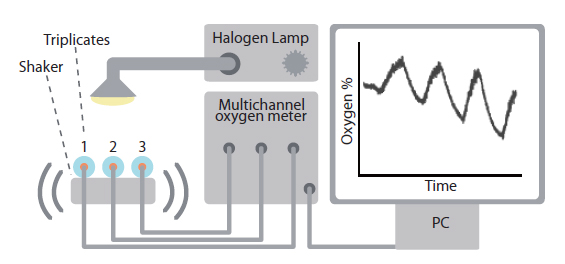
All O2 measurements were carried out as light response curves, using a multi-channel fiber-optic O2 meter (OXY-4 mini; Presens GmbH, Regensburg, Germany) connected to measuring chambers with three polymer optical fibers and controlled by a PC running
The O2 concentration in algal subsamples was monitored in small glass vials coated with an optical O2 sensor spot on the inside. To ensure durable attachment of the indicator spot, the vials were washed in dry acetone, placed in a glass tray, and dried in an oven at 110°C for 12 h. Subsequently, the glass surface in the vials was covered with a 7.5% solution of dimethyldichlorosilane (synthesis grade; Merck, Darmstad, Germany) in toluene for two hours, then washed twice in toluene and once in ethanol (96%). The O2 indicator material consisted of a solution of 75 mg Pt(II) meso-tetra(pentafluorophenyl)porphine and 4 g of polystyrene (Goodfellow Cambridge Ltd., Huntingdon, UK) dissolved in 40 mL of 1,1,2-trichloroethane (96% stabilized with 2-propanol; Sigma-Aldrich, St. Louis, MO, USA), filtered and diluted to 60 mL. The polymer-dye solution was applied onto the inside of the vials with a glass pipette, carefully positioning a thin drop in the center of the bottom, followed by drying at room temperature and a relatively high humidity (>80%) in order to prevent crack formation. This procedure resulted in vials with an even thin circular layer of indicator dye at their bottom.
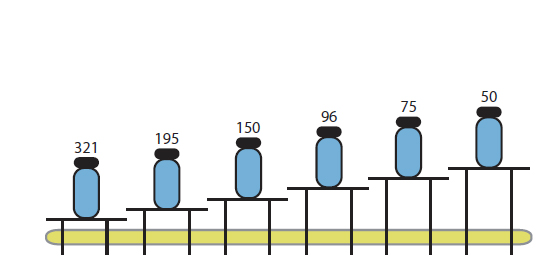
The vials were filled with culture sample to capacity and carefully closed with airtight lids avoiding formation of gas bubbles. Two glass beads, Ø1 mm, kept sufficient mixture in the sample during the shaking movements without damaging the delicate silica frustules enclosing the diatom cells. To prevent cell clumping and the development of O2 gradients, three 2 mL glass vials containing subsamples of culture were attached to the 3 fiber-optic light guides in a custom build shaking apparatus based on a commercial whirley mixer. For all cells to experience identical light conditions, the shaker was wrapped in aluminum foil to reflect light back through the vials. A fiberoptic halogen lamp equipped with a collimating lens (KL 2500 LCD; Schott) was used as actinic light source. All measurements were performed in a temperature-controlled laboratory at 17°C. Furthermore, to keep samples from heating during light exposure, a fan ventilated the whole setup. For calibration of the halogen lamp, a miniature spherical quantum sensor (US-SQS/A; Walz GmbH) connected to a quantum irradiance meter (LI-250A; LiCor Inc.) was placed inside a water filled glass vial, and positioned as a sample in the setup (Appendix 3).
Prior to every measurement, a two-point calibration of the O2 sensors was carried out. A zero O2 measurement was obtained with a solution of 1 g sodium sulfite (Na2SO3) dissolved in 100 mL of water, and a measurement at 100% atmospheric saturation was obtained with air saturated water. The O2 concentration in air saturated water at known salinity and temperature was calculated according to (Weiss 1970). Triplicate cultures from one light condition were assessed at a time. Samples were first allowed to dark-adapt for 15 min. Then light / dark response curves were carried out with 20 min cycles at increasing irradiances (53, 154, 245, 277, and 450 µmol photons m-2 s-1).
Photosynthesis / respiration rates were calculated from the linear change in O2 concentration (% air saturation) over time. Further calculations deducting absolute values of DO as O2 in mg L-1 were performed according to Weiss 1970, by including cell counts and the molecular weight of O2. The O2 evolution rate was quantified in units of nmol O2 cell-1 h-1. By adding the dark respiration measured immediately after each irradiance incubation to the net O2 production, the gross photosynthetic rate (
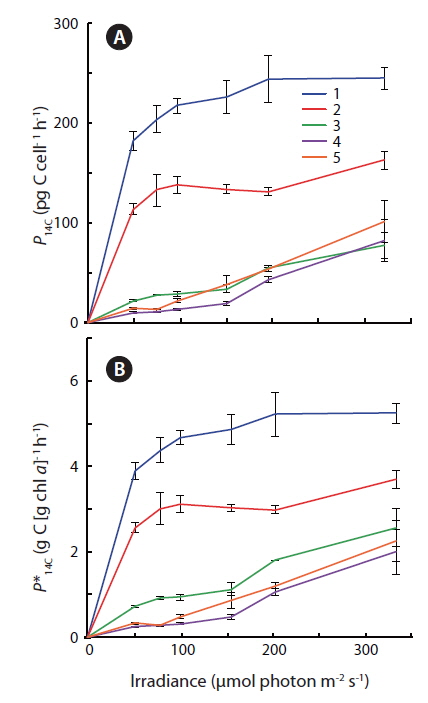
Photosynthetic carbon fixation of

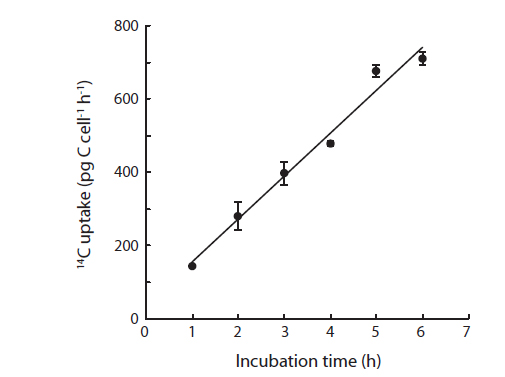
where DPM is the measured disintegration rate (disintegrations min-1 mL-1), DIC is the concentration of inorganic carbon (µg C mL-1), 14Cadded is the specific activity in disintegrations min-1 mL-1, and h is the incubation time in hours, and cells is the number of cells in the vials. Prior to the irradiance experiments, a first preliminary experiment was performed using the techniques described above to proof the linearity of 14C uptake of
DIC in all samples was measured in triplicates by adding 50 µL HgCl2 to 1.5 mL glass flasks filled with sample and sealed with a serum stopper in the lid. All samples were then analyzed for DIC concentration using an IRGA (225-Mk3; Analytical Development Corporation, Hoddesdon, UK). Using a bicarbonate standard for comparison, triplicate measurements were performed for each incubated sample. For each triplicate, three IRGA measurements were made with three measurements of a bicarbonate-standard before and three after.
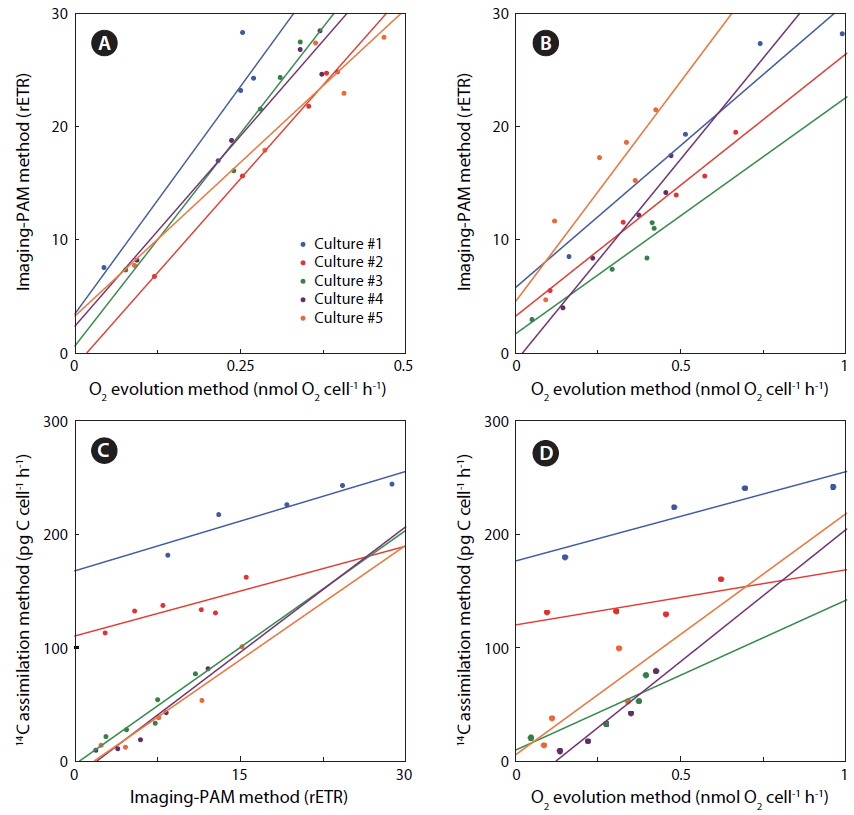
In order to evaluate the relationship between the three methods used in this study, rates of photosynthesis vs. irradiance for variable chlorophyll fluorescence-, 14C-assimilation- and optical O2-sensor-measurements were plotted as scatterplots against each other with simple linear regression to determine the strength and significance of correlation, as quantified by the correlation coefficient (r2 ). When the difference in irradiance were less than 5% between two methods they were used as equal values for correlation between their corresponding values of photosynthetic rates.
Semi-continuous cultures of
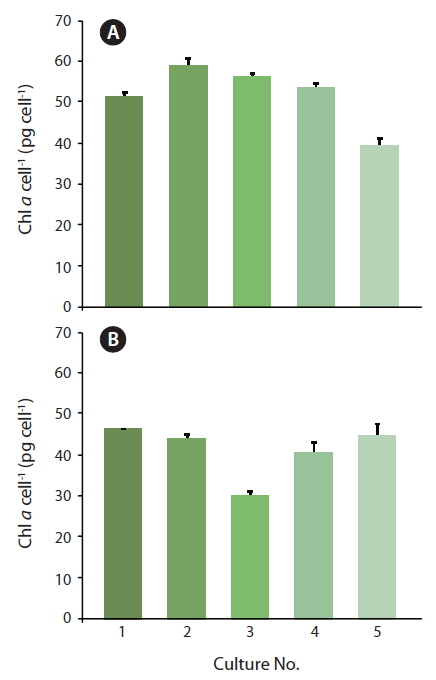
During the acclimatization of
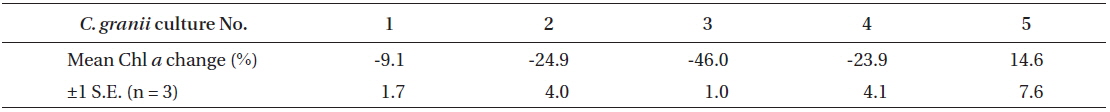
Percentages of changes in Chl a content of Coscinodiscus granii (pg Chl a cell-1) between Exp. 1 and 2
>
Optical O2 sensor measurements
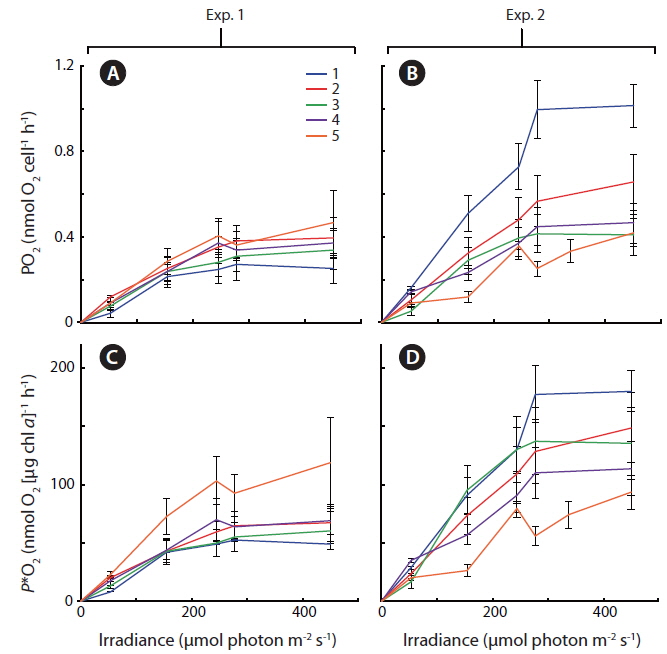
In Exp. 1 and 2, gross photosynthetic rates,
>
Variable chlorophyll fluorescence measurements
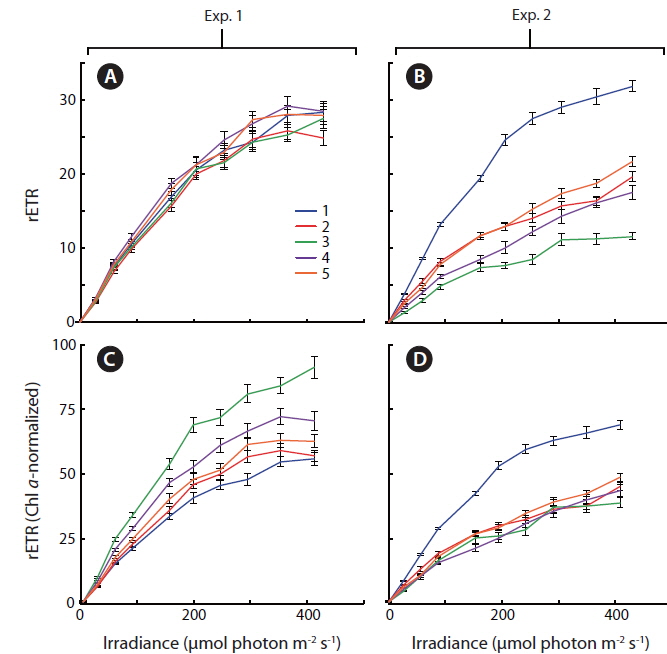
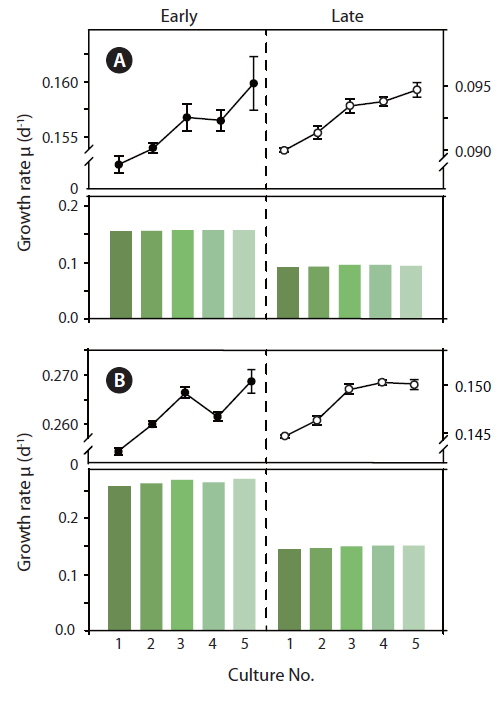
Light response curves displaying relative values of photosystem II electron transport rates (rETR) as a function of irradiance, were measured, (Fig. 5A & B) and normalized to the amount of culture specific Chl
Photosynthetic carbon fixation vs. irradiance curves showed that cultures #1 and #2 exhibited a significantly higher apparent
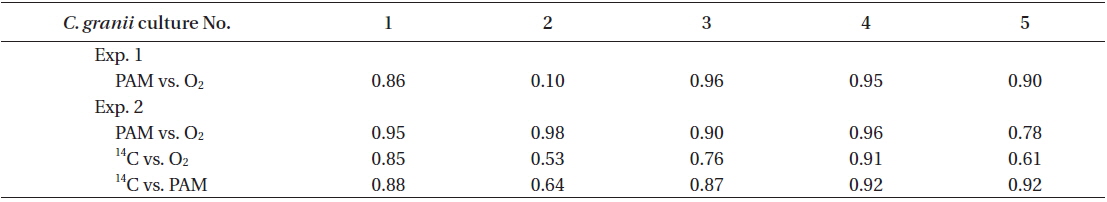
Rates of photosynthesis vs. irradiance as determined by variable chlorophyll fluorescence-, 14C-assimilationand optical O2-sensor-measurements, respectively, were plotted against each other to determine the strength and significance of linear correlation (Table 2, Fig. 7). We only used rate values obtained at quasi-similar irradiances; five pairs for PAM measurements vs. optical O2-sensor in both Exp. 1 and 2, and 14C vs. PAM measurements in Exp. 2, four pairs for 14C-assimilation vs. optical O2-sensor in Exp. 2. Generally, we found a good linear correlation (r2 ≥ 0.9) between data obtained with variable chlorophyll fluorescence and O2 methodologies in Exp. 1 and 2, except for culture #1 in Exp. 1, and culture #5 in Exp. 2 (Table 2, Fig. 7), showing a less strong correlation of r2 = 0.86 and r2 = 0.78, respectively. 14C vs. O2 measurements in Exp. 2 showed more variable correlations, with cultures #1 and #4 showing the strongest correlations of r2 = 0.85 and r2 = 0.91, respectively. In the comparison of 14C vs. PAM, cultures #1 and #3 showed a strong correlation with r2 = 0.87, where culture #2 has a modest correlation of r2 = 0.64, and culture #4 and 5 showed very strong correlation of r2 = 0.92.

Correlation between three different methods for photosynthesis measurements in Coscinodiscus granii
Cultures of
Because the initial growth rate between Exp. 1 and 2 was constantly increasing, one could expect that a lower level of Chl
During acclimatization, the cells slowly began to up regulate their photosynthetic apparatus, reaching a balanced light harvesting potential supplying sufficient energy required for optimum carbon fixation and growth rate at the given irradiance, without further photo inhibition. Among cultures #1-5, there was an increase in growth rate, corresponding to the increasing growth irradiance (Fig. 5). However, this change did not correlate with the amount of Chl
Some general patterns emerged from the measurements of photosynthetic rates vs. irradiance, with all three applied methods (Figs 4-6). Photosynthetic rates measured with O2 optodes, and variable chlorophyll fluorescence imaging, displayed an increasing variation inbetween the cultures from the first to the second experiment. Unfortunately, we cannot provide any data on this for 14C-assimilation measurements; however, we do see a significant variation between the cultures for the 14C-assimilation data from the second experiment, (Fig. 6).
All three methods for quantifying photosynthetic activity showed similar trends in the investigated cultures. However, we did not see a clear-cut trend in the variations between cultures from method to method. Variations between measurements can be attributed to several factors. Measurements were not performed on exactly the same days, and the duration of measurements varied between methods. We used three different methods, targeting three different parts of the photosynthetic apparatus. For example, when measuring photosynthetic capacity from variable chlorophyll fluorescence it correlates to the rate of charge separation in PSII reaction centers; however, this rate is not directly coupled to O2 evolution or 14C-assimilation (Jakob et al. 2005), hence estimations will vary between methods. The findings of Lavaud et al. (2002
The PSII reaction center activity monitored from variable fluorescence can deviate significantly from the measured O2 production rate (Falkowski et al. 1986, Geel et al. 1997, Gilbert et al. 2000, Figueroa et al. 2003). Low correlation between fluorescence based measurements vs. O2 measurements of photosynthetic capacity was observed both at low and high light intensities by Jakob et al. (2005). In parallel to the findings of Lavaud et al. (2002
Variations in the photosynthetic capacity between cells within each culture (shown as S.E. in Fig. 5) can to some degree be attributed to the internal rearrangement within the cells as described elsewhere (Trampe et al. 2011). Variation between cells according to age has also been shown for the dinoflagellates,
>
Correlations between different methods
We found very strong linear correlations between O2 evolution and variable chlorophyll fluorescence methods for all cultures, (Table 2, Fig. 7), except for culture #1 in Exp. 1, and culture #5 in Exp. 2, showing a slight reduction in correlation coefficients, but still with a strong linear relationship between the two methodologies. These results correspond well to the explanations and findings of others as described above.
The linear correlation of the 14C-assmilation measurements vs. both O2 evolution and the variable chlorophyll fluorescence measurements was weaker. This could be attributed to the duration of incubation time, which was significantly longer than for the variable chlorophyll fluorescence measurements, and about 25% longer than for O2 evolution measurements. The O2 evolution method also involves an interval of darkness before increasing the light intensity during PI measurements, this time allows for partial reduction of the photosynthetic apparatus, whereas the 14C-assmilation measurements were based on continuous light during the experiment, which could cause oxidative stress at increasing irradiance. The variable chlorophyll fluorescence method has some advantages above both the O2 evolution and 14C assimilation methods, due to rapid assessment of photosynthetic capacity. The effect of being incubated for longer periods, allowing for sinking / stacking of cells could be a pronounced source of error, as well as the longer duration at which the cultures were exposed to high irradiances could also alter the potential of photosynthetic capacity. Long incubation times furthermore allow for gradual adjustments of the photosynthetic apparatus during the measurement, i.e. cultures acclimated to low light had more time to acclimate to high light, and cultures adapted to high light had more time to down regulate.
The fact that cells are continuously suspended during measurements by the O2 evolution method, as compared to the stationary cells settling / stacking on the bottom of the 14C incubation vials, could somewhat lessen the significance of incubation effects on these cells. The O2 evolution method also eliminated the cells’ exposure to high O2 levels, since every change in irradiance was followed by a dark period. In contrast, the 14C method requires continuous light on the airtight incubation vials, potentially producing higher O2 concentrations towards the end of the incubation period, and thus potential oxidative damage. However, such inhibition is not apparent when comparing O2 production in Fig. 4B and D, where culture #1 is producing significantly more O2 than the rest of the cultures, with Fig. 6 showing that culture #1 at the same time is having the highest apparent
It should be noted, that our correlation analysis only compares whether the shape of the light curve, i.e., the relative response to increasing irradiance, correlates or not between methods. Thus, we do not attempt to obtain correlations between the absolute values of photosynthetic capacity. In order to do so, it would be necessary to normalize to a common unit, e.g., O2 evolution, C-incorporation, or absolute electron transport rates. However, this would rely on the strength of mathematical models as to predict one component of photosynthesis in relation to others. As described above, this includes many complex, often inaccurate, presumptions, and requires additional optical characterization of the samples, such as e.g., measurements of the absorption cross section of PSII, in order to convert rETR measures to absolute ETR values. Hancke et al. (2008) used the stoichiometric ratio of O2 evolved per electron generated in PSII, together with a bio-optical measurements of the absorbance of PSII. This enabled calculation of O2 production in absolute units directly from the measured PSII effective quantum yield. The calculation is based on assumptions of the amount of O2 evolved per electron generated, and the accuracy in measuring the absorption cross section of PSII, which was assumed to stay constant during measurements. The PSII absorption cross section can, however, vary with irradiance, e.g., during so called state transitions. This involves the detachment and attachment of LHCII and CP29 during high and low irradiances respectively, as caused by enzyme driven phosphorylation and de-phosphorylation, which lowers the actual absorption cross section (Suggett et al. 2011).
We present a detailed study of photosynthesis of