검색 전체 메뉴
PDF
맨 위로
OA 학술지
자기조직화지도(Self-organizing map)와 랜덤 포레스트 분석(Random forest)을 이용한 논습지에 도래하는 수조류 군집 특성 파악 Patterning Waterbird Assemblages on Rice Fields Using Self-Organizing Map and Random Forest
  • 비영리 CC BY-NC
  • 비영리 CC BY-NC
ABSTRACT
자기조직화지도(Self-organizing map)와 랜덤 포레스트 분석(Random forest)을 이용한 논습지에 도래하는 수조류 군집 특성 파악
KEYWORD
Habitat clustering , Random forest , Rice fields , Self-organizing map , Waterbirds
  • 서 론

    논습지(rice fields)는 많은 수의 조류가 이용하는 대표적인 인공습지로 잘 알려져 있다(Elphick, 2010). 개발로 인하여 사라져가는 자연습지를 대신하여 논습지는 다양한 수조류에게 서식지를 제공한다(Fasola and Ruiz, 1996; Elphick, 2000). 백로류 같은 일부 수조류 그룹에게 안정적인 개체군 유지를 위해 취식지로서 기능을 가지는 논습지의 분포는 필수적이다(Czech and Parsons, 2002). 논습지의 형태는 지역농업인의 관리에 의해 다양한 형태가 조성되기 때문에 논습지를 이용하는 수조류 군집의 구성이 연중 다양하게 형성된다(Maeda, 2001).

    수조류에게 안정적인 서식지 제공을 위해 서식지 관리 전략이 필요하고 이러한 서식지 관리 전략은 체계적인 보전 계획을 통해 수립된다(Breininger and Smith, 1990; Elphick and Oring, 1998). 일반적으로 수조류의 서식지 보전은 저어새 Platalea minor나 재두루미 Grus vipio와 같은 멸종위기종에 초점을 맞추는 경향이 있다. 그러나 생물다양성 보전을 위해서는 멸종위기종 뿐만 아니라 흔히 관찰되는 종에 대한 보전 계획도 수립되어야 한다(Lee et al., 2010). 흔히 관찰되는 수조류 종들이 이용하는 서식지에 대한 평가는 수조류 무리(assemblage)의 특성 파악을 통해 확인 할 수 있다 (Canterbury et al., 2000). 다양한 형태의 서식지에서 나타나는 수조류의 군집내의 종과 개체수는 생물학적 특성과 생태적 가치의 척도로 이용되기도 한다(Bradford et al., 1998; Browder et al., 2002). 비록 복합적인 조류 군집이 보전 전략을 명확히 설명하지 못하더라도 흔히 관찰되는 종들의 분포 특성을 통해 서식지 보전 가치에 대한 일반적인 평가가 이루어지는 경우가 있다(Lee et al., 2010).

    생물 군집의 분포 패턴 파악은 서식지 관리 전략 수립에 중요한 과정이다(Park et al., 2003; Dimitrovski et al., 2012). 생물 종의 무리에 대한 여러 연구 결과에서 무리의 특성이 생태적 서식지 상태의 평가에 유용함을 보여준다 (Dufrêne and Legendre, 1997; Hamer et al., 2003). 시공간적 생물 무리의 패턴 연구에 새로운 방법적 접근이 생태적 특성 파악에 효과적이다(Lasne et al., 2007). 최근에는 컴퓨터의 발전과 더불어 새로운 분석 기법을 이용한 생태적 상태(ecological status)를 평가하는 방법이 주목을 받고 있다(O'Connell et al., 2007; Lee et al., 2010). 자기조직화지도(self-organizing map, SOM) 분석 방법은 많은 종 무리의 분포 특성 연구에서 훌륭한 특성 도출 결과를 보여준다 (Lek and Guegan, 1999; Piscart et al., 2010). 자기조직화 지도는 동반 출현하는 종에 대한 유형화에 적합하도록 설계되어 있으며 기존의 다른 다변량 분석 방법보다 훨씬 효율적이라고 알려져 있다(Olden et al., 2006; Park et al., 2006). 랜덤 포레스트(random forest) 분석 방법 역시 패턴이 가지는 특성 파악에 효과적인 특성을 보여준다(Kampichler et al., 2010; Dimitrovski et al., 2012). 최근 들어 랜덤 포레스트 분석 방법은 생태학 분야에 많이 접목되는 방법으로 복수의 의사결정나무를 이용하여 단일 의사결정 분석의 과적합(overfitting) 문제를 피할 수 있다는 장점을 가진다(Breiman, 2001).

    본 연구는 한국 중서부지역 논습지에 도래하는 수조류 군집의 분포 패턴을 파악하는데 초점을 두고 있다. 수조류 군집 데이터를 바탕으로 연중 논습지 이용 패턴의 다양성을 평가하였다. 총 4년의 수조류 도래 자료를 자기조직화지도에 접목하여 수조류를 분류하였고 랜덤 포레스트와 지표종 분석(indicator species analysis)을 통해 분류된 수조류 무리의 세부적인 특성을 확인하였다. 계절성뿐만 아니라 공간적 분포를 고려하여 모델의 결과를 해석하였다. 이를 통해 논습지에 도래하는 수조류의 서식지 보전에 관한 유용한 정보를 제공하고자 하였다.

    조사 방법

      >  조사 지역

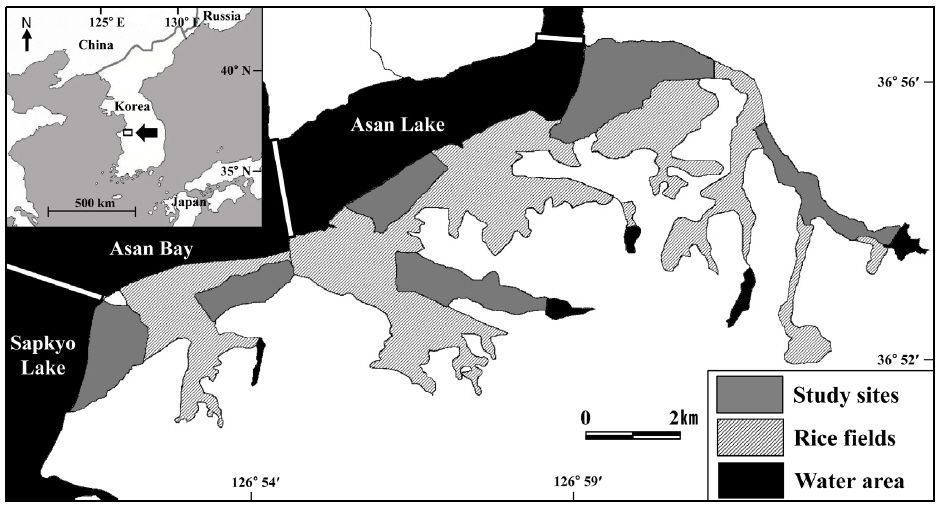
    본 연구는 한국 중서부지역에 위치한 아산호와 아산만 남단 지역의 논습지에서 수행되었다(36°54′N, 126°56′E) (Fig. 1). 이 지역은 봄철 이동시기에는 도요물떼새류, 여름철에는 백로류, 겨울철에는 오리기러기류와 같이 다양한 조류가 도래하는 중요한 지역이다. 백로류의 경우 번식 개체군으로 왜가리, 중대백로, 중백로, 쇠백로, 황로, 해오라기 등이 조사 지역 주변에 대단위 번식을 한다(Choi et al., 2007; Choi and Yoo, 2011). 더군다나 연구 지역은 동아시아-대양주 철새이동경로(East Asian-Australian Flyway)상에 위치하고 있고 이 경로로 멸종위기조류종이 이용하고 있어 보전에 중요하다(BirdLife International, 2005).

    아산만 남단 지역의 논습지를 모두 조사한다는 건 사실상 불가능하기 때문에 아산만 남단 지역을 대표할 수 있는 6개의 구역을 설정하여 조사를 수행하였다. 각 조사 구역은 약 250개의 필지로 구성되어 있다. 필지는 논둑이나 농로로 나뉘어져 있으며 평균 100 m×45 m 의 크기로 이루어져 있다. 필지는 지역농업인의 관리에 따라 연중 크게 변한다. 4월말이 되면 필지는 수로를 통해 물이 공급된다. 1-2주 뒤 필지는 써레질과 모내기가 이루어지고 9월까지 벼가 성장하여 약 1 m 높이를 형성한다. 9월말에서 10월 중순까지 수확이 이루어지고 수확이 이루어진 후에 필지에 그루터기가 형성된다. 그리고 4월까지 지속적으로 땅을 갈아엎는다.

      >  조류 조사 및 필지 별 영농법 확인

    2009년 4월부터 2010년 3월, 2011년 4월부터 2014년 3월까지 총 4년간 월 2회씩 격주로 수조류 조사를 수행하였다. 조사는 조사 대상 조류가 충분히 활동적인 맑은 날에 오전 6시부터 정오(12:00 pm)까지 실시하였다. 쌍안경(ApoTelevid, Leica, New York, USA)이나 망원경(Ultravid, Leica, New York, USA)을 이용하여 농로를 따라 이동하면서 인접한 필지에 분포하는 조류를 관찰, 동정하였다. 전깃줄이나 전봇대 등과 같은 인공구조물에서 관찰된 조류는 조사 대상에서 제외하였다. 필지의 서식지 타입을 확인할 수 없는 눈이 많이 내린 날에는 조사를 수행하지 않았다.

    조류 조사 시 관찰된 조류가 이용한 필지의 서식지 타입을 함께 기록하였다. 서식지 타입은 다음과 같이 크게 5가지로 나누었다. (1) 모내기 전 물을 댄 필지(flooded and uncultivated fields, FU), (2) 모내기 한 필지(rice transplantation fields, RT), (3) 벼가 성장한 필지(tall rice plant fields, TP), (4) 수확 후 그루터기 형성 필지(post-harvested fields, PH), (5) 갈아엎은 필지(plowed fields, PL). 서식지 타입은 담수 유무, 토양의 물리적인 상태(평탄화, 논갈이), 벼 식생 성장정도, 수확 후 짚단 처리 방법에 따라 나누었다. “모내기 전물을 댄 필지”의 경우 4월말에서 5월초에 형성되는 형태로 모내기를 위해 물을 댄 필지로 갈아엎은 다음 바로 물을 댄 형태나 물을 대고 써레질을 통해 평탄화 작업을 한 경우 모두를 포함하였다. “모내기한 필지”는 5월초부터 중순 기간 동안 써레질을 통해 평탄화 작업이 끝난 필지에 모를 심은 경우로 정의하였다. “벼가 성장한 필지”는 모내기 후 전체 필지에서 벼의 피복도가 50% 이상인 경우로 하였으며 주로 6월 중순 이후에 나타난다. “수확 후 그루터기 형성 필지”는 10월 초반이나 중반부터 형성되며 논갈이 전 벼를 수확한 필지로 짚단을 그대로 둔 경우와 짚단을 수거한 경우 모두를 포함하였다. “갈아엎은 필지”는 수확 후 논갈이로 필지 표층이 갈아 엎은 형태를 형성하는 경우로 11월부터 3월까지 지속적으로 형성된다.

      >  자료 분석

    논습지에 분포하는 수조류 군집의 분류(classifying)와 배열(ordering)을 위해 자기조직화지도를 이용하였다(Kohonen, 1982). 자기조직화지도는 동물집단의 종 분포나 구조를 확인하기 위해 사용하는 분석법으로 탐색적 자료 분석에 효율적이고 강력한 특성을 나타낸다(Chon, 2011). 자율학습 신경망(unsupervised neural network)인 자기조직화지도는 계층적인 시스템이 아니며, 일반적으로 입력층과 출력층으로 구성되어 있다. 출력층은 통상 육각형의 격자단위인 뉴런으로 구성된다. 모든 연결들은 입력층에서 출력층의 방향으로 되어있으며 각각의 뉴런은 출력결과를 전혀 예측할 수 없는 자율학습을 통해 갱신되는 연결강도를 가진다. 이 연결강도는 입력 패턴과 가장 유사한 출력층 뉴런이 승자가 된다. 출력층 뉴런은 승자 독식 구조로 승자만이 출력층 뉴런에 나타나며, 승자와 유사한 연결강도를 갖는 입력 패턴이 동일한 출력 뉴런으로 배열된다. 출력층의 뉴런은 일반적으로 2차원으로 보여준다.

    관찰된 각 수조류 종 (총 32종×92회 조사 자료)의 개체수는 각 종별 개체수 차이가 크게 나타났기 때문에 로그치환하여 자기조직화지도의 입력층에 할당하였다. 32종은 조사기간 동안 논습지에서 관찰된 전체 수조류 종을 의미하고 92회 조사는 눈이 많이 내리는 4회의 조사시기를 제외한 조사 횟수를 의미한다. 출력층 뉴런의 크기는 가로 6개, 세로 8개로 나타냈다. 출력층 뉴런의 크기는 휴리스틱 규칙(heuristic rule)에 의해 선택되었다(Vesanto et al., 2000). 뉴런의 수는 5√n 로 결정한다. 여기서 n 입력층에 입력되는 데이터 수를 의미한다. 본 연구에서는 92개 데이터 수에 휴리스틱 규칙을 적용하면 48개(8×6)의 출력 뉴런이 생성된다.

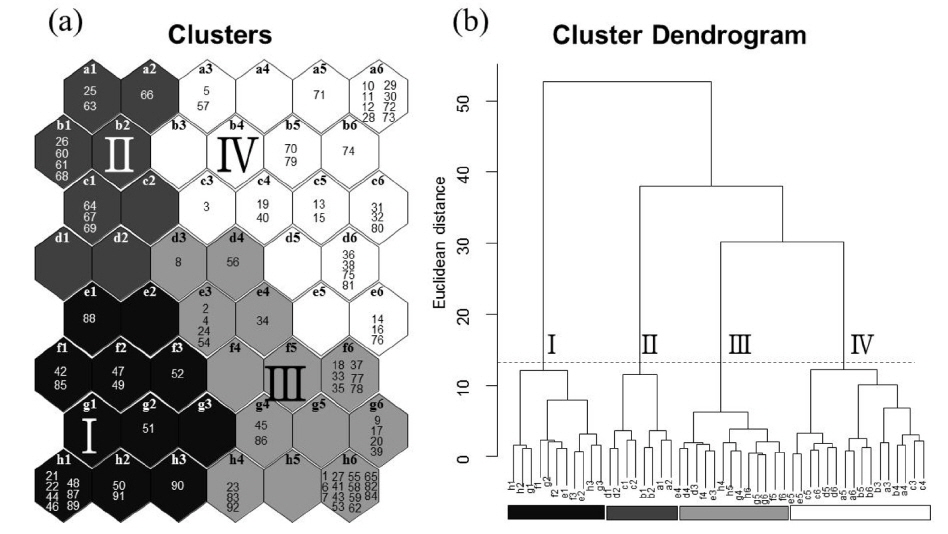
    자기조직화지도의 자율학습 후 각 뉴런이 가지는 유사성을 이용하여 각 그룹을 분류하였다. 뉴런의 거리 측정은 Euclidean distance를 사용하였고 그룹의 분류는 Ward linkage 방법을 이용하였다(Park et al., 2003). 각 그룹간의 유의성 평가를 위해 다수응답순열절차(multi-response permutation procedures, MRPP) 검정을 수행하였다. 다수응답순열절차는 비모수적인 통계방법으로 이미 나누어진 2개 이상의 그룹의 비교에 많이 사용되는 방법이다(McCune and Grace, 2002). 다수응답순열절차의 결과는 유의값(P)과 A값(chancecorrected within-group agreement)으로 보여지며, 유의성이 확인되면 그룹간에 서로 이질적이라고 할 수 있다. A값은 그룹간의 유사성을 나타내고 그 값은 0에서 1까지 값으로 나타낸다. A값이 클수록 각각의 그룹이 가지는 성향이 유사함을 나타낸다.

    자기조직화지도의 분석은 R 통계프로그램의 diatSOM package를 이용하였다. diatSOM package는 복잡한 군집 구조 분석에 장점을 가진다(Bottin et al., 2014). 연중 논습지에서 관찰된 수조류는 서식지 이용이 중복되거나 종 별 이용 패턴이 급격하게 변하기 때문에 이 같은 군집 구조 분석에 diatSOM package가 유용하게 이용될 수 있다.

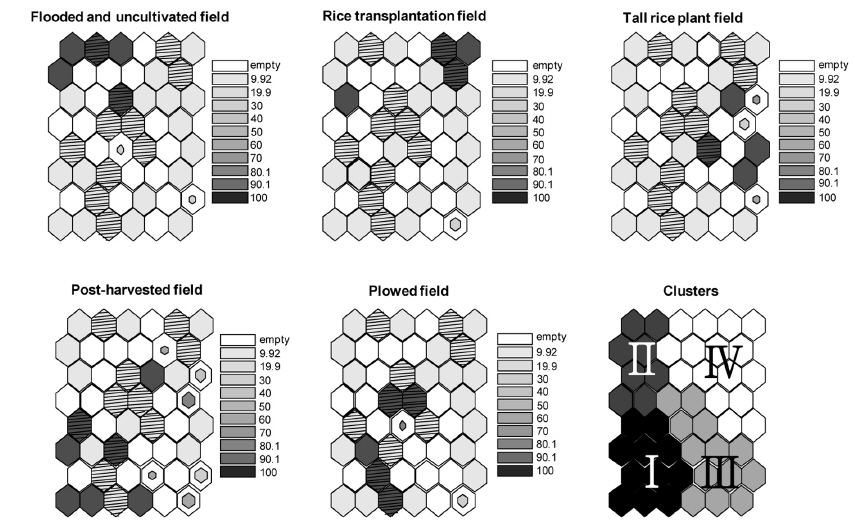
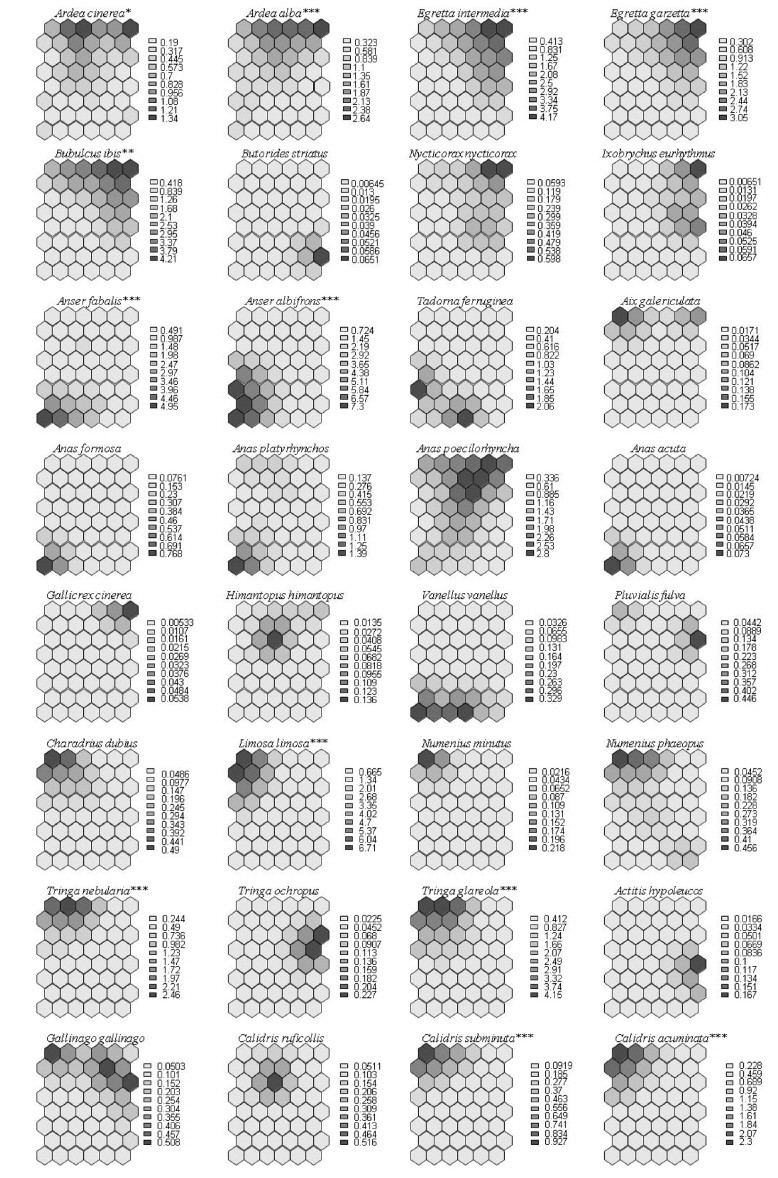
    자기조직화지도에 의해 표현된 출력층의 뉴런에 영농법의 중요성을 나타냈다. 각 뉴런 단위 별 영농법의 평균 수치를 grey scale과 뉴런의 크기로 표현하였다. 중요성은 비율 자료로 표현하였으며 짙은 색으로 갈수록 영농법의 중요성이 높음을 의미한다. 뉴런의 크기는 뉴런 단위 별로 계산된 분산값의 역의 비율로 나타냈다. 즉, 뉴런의 크기가 작을수록 분산값이 큼을 의미한다.

    자기조직화지도에 의해 나누어진 각 그룹을 대표하는 종을 분석하기 위해 지표종 분석을 수행하였다. 지표종 분석은 출현한 종들의 상대 밀도와 상대 빈도의 곱으로 계산된 지표값(indicator value, IndVal)을 통해 지표종을 평가하는 방법이다. 지표값의 유의성을 결정하기 위해서 몬테카를로 검증을 사용하였다. 총 1,000번의 시뮬레이션을 통해 유의성을 확인하였다.

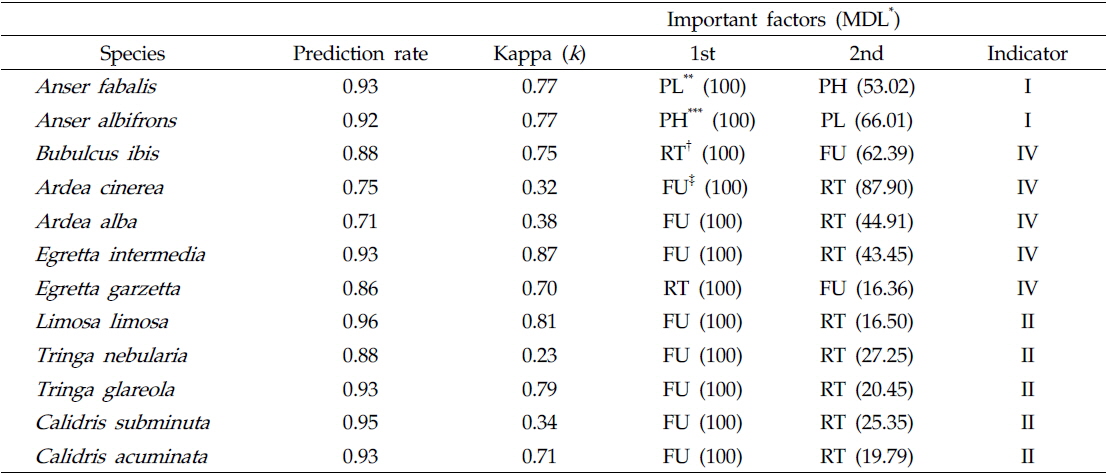
    각 그룹과 영농법의 관련성을 확인하기 위해 랜덤 포레스트 모델을 사용하여 할당된 그룹을 평가하였다. 영농법에 따라 출현한 조류 종들을 이분형 자료(0과 1)로 나타냈으며 이를 이용하여 램덤 포레스트 모델에 적용하였다. 랜덤 포레스트 모델은 다수의 분류 나무를 생성시켜 이용하는 방법으로 CART(classification and regression trees)의 불안전성을 보완하고 있으며 정확한 분류를 할 수 있는 학습 알고리즘 중 하나로 간주된다. 랜덤 포레스트 모델은 학습과정을 통해 각 인자의 중요도를 계산한다. 이는 각 분류 나무 마디마다 변수값들이 분류의 정확성에 미치는 정도를 기초로 하여 측정되는 값으로, 변수의 중요도를 파악하는데 유용하게 이용된다. 랜덤 포레스트 모델의 중요도는 minimum description length (MDL)로 나타냈다. MDL의 경우 분류에서 각 변수의 중요성을 서열화로 보여주는 값으로 0에서 100까지 범위의 수치로 변환하여 사용했으며, 모델의 적합성은 Prediction rate와 Kappa 값(k)을 이용하여 평가하였다. Prediction rate와 Kappa 값은 0에서 1로 표현되며, 0에 가까울수록 예측이 무작위성을 띄고 1일 경우 완벽한 예측이 이루어졌음을 뜻한다.

    수조류 그룹(도요물떼새류, 백로류, 수금류)별 종수와 개체수의 차이는 Kruskal-Wallis (K-W) 검증을 이용하였고, 사후검증으로 Nemenyi-Damico-Wolf-Dunn 검증을 이용하였다. 모든 분석은 R 통계 프로그램을 이용하였다(R Development Core Team, 2012).

    결 과

      >  자기조직화지도를 이용한 패턴 분석

    논습지에서 관찰된 32종의 수조류를 기초로 한 92회의 조사 자료를 자가조직화지도에 적용하여 분석한 결과 크게 4개의 그룹(I-IV)으로 나눌 수 있었으며, 이들 그룹들 간에는 유의한 차이가 나타났다(Fig. 2; MRPP, A=0.37, P < 0.001) 계층적 군집 분석을 세부적으로 살펴보면 그룹 I과 나머지 그룹(II, III, IV)이 크게 나뉘는 것을 확인 할 수 있었으며, 나머지 그룹에서 II과 III, IV 그룹에서 차이가 있음을 알 수 있었다(Fig. 2b).

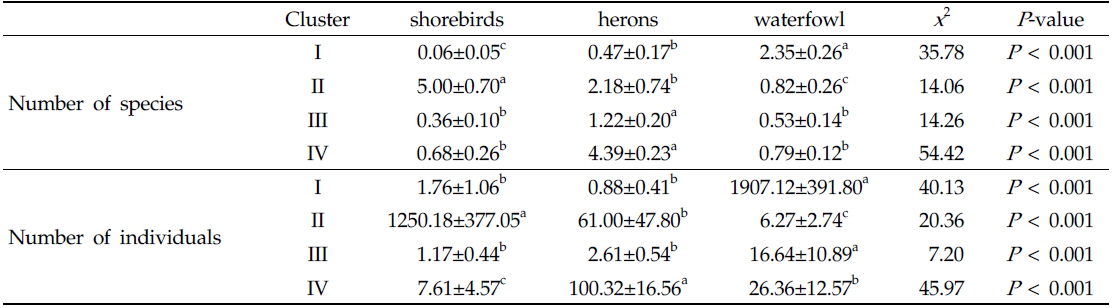
    자기조직화지도 분석에서 각 수조류 그룹별 차이는 Table 1에 나타냈으며, 수조류 그룹에서 차이를 잘 반영함을 알 수 있었다. 그룹 I이 위치한 자기조직화지도 결과의 좌측 하단부는 오리기러기류의 종수와 개체수가 높게 나타났고(종수: x2 = 35.78; P < 0.001; 개체수: x2 = 40.13; P < 0.001), 좌측 상단부에 위치한 그룹 II는 도요물떼새류(종수: x2 = 14.06; P < 0.001; 개체수: x2 = 20.36; P < 0.001), 우측 상단부에 위치한 그룹 IV은 백로류가 뚜렷하게 종수와 개체수가 높게 나타났다(종수: x2 = 54.42; P < 0.001; 개체수: x2 = 45.97; P < 0.001). 우측 하단부의 그룹 III의 경우 종수는 백로류, 개체수는 오리기러기류가 높게 나타났다(종수: x2 = 14.26; P < 0.001; 개체수: x2 = 7.20; P < 0.001).

    [Table 1.] Comparison of number of species and individuals in relation to self-organizing map clusters. Data are expressed as mean±S.E. Different letters (a, b, c) indicate significant differences among clusters based on Nemenyi-DamicoWolf-Dunn test (P < 0.05)

    label

    Comparison of number of species and individuals in relation to self-organizing map clusters. Data are expressed as mean±S.E. Different letters (a, b, c) indicate significant differences among clusters based on Nemenyi-DamicoWolf-Dunn test (P < 0.05)

    그룹 I의 경우 마른 논의 형태인 수확 후 그루터기를 형성하는 필지와 갈아엎은 필지가 많이 나타났고 그룹 II, III, IV는 담수형태의 논습지의 형태가 많이 분포하는 것을 확인 할 수 있었다(Fig. 3). 특히 그룹 II는 모내기 전 물을 댄 필지가 주를 이루었으며, 그룹 IV는 모내기 한 필지나 벼가 성장한 필지가 우세하게 분포하였다.

    겨울철 논습지를 이용하는 큰기러기 Anser fabalis (IndVal = 65.5)와 쇠기러기 Anser albifrons (IndVal = 100)는 그룹 I에서 확인된 지표종으로 두 종 모두 갈아 엎은 필지나 수확 후 그루터기 형성 필지를 이용하는 오리기러기류였다. 대표적인 통과조류인 도요물떼새류인 흑꼬리도요 Limosa limosa (IndVal = 100), 청다리도요 Tringa nebularia (IndVal = 65.0), 알락도요 Tringa glareola (IndVal = 84.0), 종달도요 Calisris subminuta (IndVal = 45.5), 메추라기도요 Calidris acuminate (IndVal = 89.3)는 그룹 II에서 확인된 지표종으로 모내기 전 물을 댄 필지나 모내기 한 필지의 논습지 형태를 주로 이용하는 것을 확인 할 수 있었다. 여름철 논습지를 이용하는 백로류인 황로 Bubulcus ibis (IndVal = 46.0), 왜가리 Ardea cinerea (IndVal = 27.8), 중대백로 Egretta alba modesta (IndVal = 50.9), 중백로 Egretta intermedia (IndVal = 81.8), 쇠백로 Egretta garzetta (IndVal = 82.2)는 그룹 IV에서 확인된 지표종으로 담수논습지의 형태를 고르게 이용하는 것을 알 수 있었다. 그룹 III에서는 특징적인 지표종은 나타나지 않았다(Table 2Fig. 4)

    [Table 2.] Prediction of waterbird species and evaluation of important feature of farming practices for each indicator species using random forest model. Indicator is based on the IndVal in indicator analysis

    label

    Prediction of waterbird species and evaluation of important feature of farming practices for each indicator species using random forest model. Indicator is based on the IndVal in indicator analysis

    고 찰

    본 연구 결과를 통해 논습지를 이용하는 수조류 군집의 분포 패턴은 연중 다양한 형태로 나타나고 각 시기별로 구성된 수조류 군집은 필지의 서식지 타입과 밀접한 관련이 있었다. 논습지는 영농방법에 따라 필지의 상태가 담수논과 건논이 반복하여 나타난다(Elphick, 2010). 이러한 변화 양상이 결국 수조류 군집 분포에 결정적인 요인으로 작용하는 것을 확인할 수 있다(Nam et al., 2015). 자기조직화지도에 의해 4개의 그룹으로 분류된 결과를 기초로 랜덤 포레스트 모델과 지표종 분석을 적용했을 때 이러한 패턴은 뚜렷이 확인된다. 겨울철 논습지는 건논의 형태를 띠고 이때 큰기러기와 쇠기러기를 포함한 오리기러기류가 논습지를 월동지로 이용한다(그룹 I). 무논이 조성되는 통과 시기에는 흑꼬리도요나 알락도요를 포함한 도요물떼새류에게는 중간기착지로(그룹 II), 황로나 중백로 같은 백로류에게는 여름철 번식에 필요한 에너지를 획득할 수 있는 취식공간으로 이용한다(그룹 IV). 1년을 주기로 지속적으로 변하는 논습지는 다양한 수조류에게 여러 형태의 서식지를 제공하는 것을 확인 할 수 있었다(Fujioka et al., 2010; Nam et al., 2012).

    모내기 전에 이루어지는 논습지의 담수는 수심이 평균 약 10cm 내외로 유지된다(Nam et al., 2012). 이러한 수심이 형성되는 필지의 서식지 타입은 “모내기 전 물을 댄 필지”, “모내기한 필지”, “벼가 성장한 필지”가 있다. 3가지 형태의 서식지는 식생의 유무와 밀도에 따라 큰 차이를 나타낸다. 담수 서식지를 선호하는 도요물떼새류와 백로류는 자기조직화 지도를 이용한 분석에서 각각 그룹 II와 IV에서 많이 나타났고, 지표종 분석과 랜덤 포레스트 분석에서 “모내기 전 물을 댄 필지”나 “모내기한 필지”를 선호하는 것을 알 수 있었다 (Table 2). 자기조직화지도 결과를 바탕으로 수조류 그룹이 출현한 논습지의 서식지 타입의 패턴을 확인해 보면, 도요물떼새류는 “모내기 전 물을 댄 필지” 타입에서, 백로류는 “모내기한 필지”에서 주로 확인되는 것을 알 수 있었다(Fig. 3). 도요물떼새류에게 “모내기 전 물을 댄 필지”는 갯벌과 유사한 특성을 가져 도요물떼새류가 주로 선호하는 취식방법으로 사냥에 용이하다(Nam et al., 2015). 백로류의 경우 도요물떼새류보다 몸 크기가 큰 종들로 일정 높이의 벼가 자라도 충분히 먹이 사냥을 할 수 있는 특성을 가진다(Choi et al., 2007). 두 서식지 모두 얕은 담수형태를 띠지만, 식생의 구조에 따라 수조류 그룹의 이용에 차이가 있음을 확인 할 수 있다(Nam et al., 2015).

    그룹 III에 나타난 수조류 무리는 논습지에 도래하는 수조류 군집의 강한 계절성을 보여 주며, 필지 타입의 변화의 시점에는 수조류의 이용성이 낮아지는 것으로 나타났다. 그룹 III에서 확인된 도요물떼새류, 백로류, 오리기러기류의 종수와 개체수가 낮았고, 상대적으로 그 차이가 작다(Table 1Fig. 2). 또한 특정 필지 타입이 뚜렷이 나타나기 보다는 여러 필지 타입이 분포하는 특성을 가진다(Fig. 3). 따라서 그룹 III의 수조류 무리 특성은 도요물떼새류, 백로류, 오리기러기류와 같은 수조류 그룹들의 도래가 끝나거나 다시 시작되는 시기로 판단된다. 논습지는 인간에 의해 물리적 화학적 요인이 급격히 변하기 때문에 논 생태계는 높은 역동성을 가진다(González-Solís et al., 1996). 이러한 변화에 따라 생물 군집 역시 크게 변하는 것으로 생각된다((Forrés and Comin, 1992).

    자연습지와 비교하여 논습지는 공간의 이질성이 적은 단순한 형태를 가진다(Elphick, 2010). 단일 식물 종(벼 Oryza sativa)이 대부분을 차지하고 있으며, 얕은 깊이의 수심이 일정기간 동안 유지된다(Fujioka et al., 2010). 뿐만 아니라 논습지는 필지라는 단위로 구성되고 유사한 형태의 필지가 반복하여 나타난다(Blaustein and Steven, 2001). 따라서 자연습지에 비해 단조로운 형태를 형성하는 논습지에 도래하는 수조류 군집의 생태적 특성 파악은 자연습지를 포함한 다양한 서식지에 도래하는 수조류에 대한 이해도를 높여 줄 수 있다(Elphick, 2010). 영농법에 따라 조성된 필지의 5가지 타입에 도래하는 수조류 그룹의 패턴은 복잡한 형태적 특성을 형성하는 자연습지와 수조류 군집의 관련성을 상대적으로 단순화하여 보여 준다.

    자기조직화지도와 랜덤 포레스트 모델, 지표종 분석의 통합적인 사용은 데이터를 탐색적인 접근으로 생태적 정보를 추출하기에 효율적이었다(Bae et al., 2011). 자기조직화지도의 학습과정을 이용한 분석은 연중 논습지를 이용하는 수조류군집의 특성을 분류하여 효율적으로 특징지었으며, 시각화에 효과적인 방법으로 나타났다(Park et al., 2003). 자기조직화지도를 이용한 분류를 바탕으로, 랜덤 포레스트 모델과 지표종 분석의 적용은 수조류군집의 특성 확인에 훌륭한 분석력을 가지는 것으로 나타났다(Kwon et al., 2012). 이는 자기조직화지도가 가지는 특성 때문으로 판단된다. 다변수를 포함한 데이터는 노이즈가 발생할 가능성이 상당히 높은데 자기조직화지도는 학습을 통해 발생하는 노이즈를 효과적으로 제거할 수 있다(Park et al., 2013). 따라서 자기조직화지도는 데이터가 가지는 생태적인 특성을 훨씬 명확히 표현해 주고 이를 바탕으로 이루어진 랜덤 포레스트 모델과 지표종 분석 역시 강력한 분석력을 보여줄 수 있었다(Kwon et al., 2012).

    본 연구는 논습지에 서식하는 수조류의 시공간적 분포 특성을 확인하기 위해 격주로 조사된 4년간의 수조류 군집 자료를 이용하였다. 총 32종의 수조류가 논습지에서 관찰되었으며, 이들은 뚜렷한 계절성과 함께 논습지에 조성된 공간에 대한 수조류 그룹의 이용 패턴에 차이가 있음을 확인 할 수 있었다. 수조류 군집 자료를 자기조직화지도와 랜덤 포레스트 모델, 지표종 분석에 적용한 결과 명확한 결과를 도출할 수 있었다. 논습지는 담수의 유무로 수조류 그룹이 크게 차이가 있음을 확인하였고 담수논에서도 식생의 밀생 정도에 따라 수조류 그룹의 이용 형태가 달라지는 것을 알 수 있었다. 이러한 수조류 그룹의 서로 다른 분포 패턴은 결국 각 수조류 그룹의 서식지 선호성과 높은 관련성을 가진다.

참고문헌
  • 1. Bae M. J., Kwon Y., Hwang S. J., Chon T. S., Yang H. J., Kwak I. S., Park J.H., Ham S.A., Park Y. S. 2011 Relationships between three major stream assemblages and their environmental factors in multiple spatial scales [In Annales de Limnologie International Journal of Limnology] Vol.47 P.91-105 google cross ref
  • 2. Blaustein L., Schwartz S. S. 2001 Why study ecology in temporary pools? [Israel Journal of Zoology] Vol.47 P.303-312 google cross ref
  • 3. Bottin M., Giraudel J. L., Lek S., Tison-Rosebery J. 2014 diatSOM: a R-package for diatom biotypology using self-organizing maps [Diatom Research] Vol.29 P.5-9 google cross ref
  • 4. Bradford D. F., Franson S. E., Neale A. C., Heggem D. T., Miller G. R., Canterbury G. E. 1998 Bird species assemblages as indicators of biological integrity in Great Basin rangeland [Environmental Monitoring and Assessment] Vol.49 P.1-22 google cross ref
  • 5. Breiman L. 2001 Random forests [Machine Learning] Vol.45 P.5-32 google cross ref
  • 6. Breininger D. R., Smith R. B. 1990 Waterbird use of coastal impoundments and management implications in east-central Florida [Wetlands] Vol.10 P.223-241 google cross ref
  • 7. Browder S. F., Johnson D. H., Ball I. J. 2002 Assemblages of breeding birds as indicators of grassland condition [Ecological Indicators] Vol.2 P.257-270 google cross ref
  • 8. Canterbury G. E., Martin T. E., Petit D. R., Petit L. J., Bradford D. F. 2000 Bird communities and habitat as ecological indicators of forest condition in regional monitoring [Conservation Biology] Vol.14 P.544-558 google cross ref
  • 9. Choi Y. S., Yoo J. C. 2011 Factors affecting feeding activity of grey herons in a reservoir during the breeding season [Journal of Ecology and Environment] Vol.34 P.357-363 google
  • 10. Choi Y. S., Yoo J. C. 2007 Foraging habitat preferences of herons and egrets [Journal of Ecology and Environment] Vol.30 P.237-244 google
  • 11. Chon T. S. 2011 Self-organizing maps applied to ecological sciences [Ecological Informatics] Vol.6 P.50-61 google cross ref
  • 12. Czech H. A., Parsons K. C. 2002 Agricultural wetlands and waterbirds: a review [Waterbirds: The International Journal of Waterbird Biology] Vol.25 P.56-65 google
  • 13. Dimitrovski I., Kocev D., Loskovska S., Dzeroski S. 2012 Hierarchical classification of diatom images using ensembles of predictive clustering trees [Ecological Informatics] Vol.7 P.19-29 google cross ref
  • 14. Dufrene M., Legendre P. 1997 Species assemblages and indicator species: the need for a flexible asymmetrical approach [Ecological Monographs] Vol.67 P.345-366 google
  • 15. Elphick C. S. 2000 Functional equivalency between rice fields and seminatural wetland habitats [Conservation Biology] Vol.14 P.181-191 google cross ref
  • 16. Elphick C. S. 2010 Why study birds in rice fields? [Waterbirds] Vol.33 P.1-7 google
  • 17. Elphick C. S., Oring L. W. 1998 Winter management of Californian rice fields for waterbirds [Journal of Applied Ecology] Vol.35 P.95-108 google cross ref
  • 18. Fasola M., Ruiz X. 1996 The value of rice fields as substitutes for natural wetlands for waterbirds in the Mediterranean region [Colonial Waterbirds] Vol.19 P.122-128 google cross ref
  • 19. Fores E., Comin F. A. 1992 Ricefields, a limnological perspective [Limnetica] Vol.8 P.101-109 google
  • 20. Fujioka M., Don Lee S., Kurechi M., Yoshida H. 2010 Bird use of rice fields in Korea and Japan [Waterbirds] Vol.33 P.8-29 google cross ref
  • 21. Gonzalez-Soli J., Bernadi X., Ruiz X. 1996 Seasonal variation of waterbird prey in the Ebro Delta rice fields [Colonial Waterbirds] Vol.19 P.135-142 google
  • 22. Hamer K. C., Hill J. K., Benedick S., Mustaffa N., Sherratt T. N., Maryati M. 2003 Ecology of butterflies in natural and selectively logged forests of northern Borneo: the importance of habitat heterogeneity [Journal of Applied Ecology] Vol.40 P.150-162 google cross ref
  • 23. Kampichler C., Wieland R., Calme S., Weissenberger H., Arriaga-Weiss S. 2010 Classification in conservation biology: a comparison of five machine-learning methods [Ecological Informatics] Vol.5 P.441-450 google cross ref
  • 24. Kohonen T. 1982 Self-organized formation of topologically correct feature maps [Biological Cybernetics] Vol.43 P.59-69 google cross ref
  • 25. Kwon Y. S., Li F., Chung N., Bae M. J., Hwang S. J., Byoen M. S., Park S. J., Park Y. S. 2012 Response of fish communities to various environmental variables across multiple spatial scales [International Journal of Environmental Research and Public Health] Vol.9 P.3629-3653 google cross ref
  • 26. Lasne E., Bergerot B., Lek S., Laffaille P. 2007 Fish zonation and indicator species for the evaluation of the ecological status of rivers: example of the Loire basin (France) [River Research and Applications] Vol.23 P.877-890 google cross ref
  • 27. Lee C. W., Jang J. D., Jeong K. S., Kim D. K., Joo G. J. 2010 Patterning habitat preference of avifaunal assemblage on the Nakdong River estuary (South Korea) using self-organizing map [Ecological Informatics] Vol.5 P.89-96 google cross ref
  • 28. Lek S., Guegan J. F. 1999 Artificial neural networks as a tool in ecological modelling, an introduction [Ecological Modelling] Vol.120 P.65-73 google cross ref
  • 29. Maeda T. 2001 Patterns of bird abundance and habitat use in rice fields of the Kanto Plain, central Japan [Ecological Research] Vol.16 P.569-585 google cross ref
  • 30. McCune B., Grace J. B., Urban D. L. 2002 Analysis of ecological communities P.187-197 google
  • 31. Nam H. K., Choi S. H., Choi Y. S., Yoo J. C. 2012 Patterns of waterbirds abundance and habitat use in rice fields [Korean Journal of Environmental Agriculture] Vol.31 P.359-367 google cross ref
  • 32. Nam H. K., Choi Y. S., Choi S. H., Yoo J. C. 2015 Distribution of Waterbirds in Rice Fields and Their Use of Foraging Habitats [Waterbirds] Vol.38 P.173-183 google cross ref
  • 33. O'Connell M. J., Ward R. M., Onoufriou C., Winfield I. J., Harris G., Jones R., Yallop M.L., Brown A. F. 2007 Integrating multi-scale data to model the relationship between food resources, waterbird distribution and human activities in freshwater systems: preliminary findings and potential uses [Ibis] Vol.149 P.65-72 google cross ref
  • 34. Olden J. D., Poff N. L., Bledsoe B. P. 2006 Incorporating ecological knowledge into ecoinformatics: An example of modeling hierarchically structured aquatic communities with neural networks [Ecological Informatics] Vol.1 P.33-42 google cross ref
  • 35. Park Y. S., Cereghino R., Compin A., Lek S. 2003 Applications of artificial neural networks for patterning and predicting aquatic insect species richness in running waters [Ecological Modelling] Vol.160 P.265-280 google cross ref
  • 36. Park Y. S., Chang J., Lek S., Cao W., Brosse S. 2003 Conservation strategies for endemic fish species threatened by the Three Gorges Dam [Conservation Biology] Vol.17 P.1748-1758 google cross ref
  • 37. Park Y. S., Chung Y. J. 2006 Hazard rating of pine trees from a forest insect pest using artificial neural networks [Forest Ecology and Management] Vol.222 P.222-233 google cross ref
  • 38. Park Y. S., Chung Y. J., Moon Y. S. 2013 Hazard ratings of pine forests to a pine wilt disease at two spatial scales (individual trees and stands) using self-organizing map and random forest [Ecological Informatics] Vol.13 P.40-46 google cross ref
  • 39. Piscart C., Bergerot B., Laffaille P., Marmonier P. 2010 Are amphipod invaders a threat to regional biodiversity? [Biological Invasions] Vol.12 P.853-863 google cross ref
  • 40. 2012 R: A language and environment for statistical computing google
OAK XML 통계
이미지 / 테이블
  • [ Fig. 1. ]  Map of study areas. Total rice field areas in the southern part of Asan Bay, Korea, are indicated by the grey and shaded areas. Regions of water are indicated in black.
    Map of study areas. Total rice field areas in the southern part of Asan Bay, Korea, are indicated by the grey and shaded areas. Regions of water are indicated in black.
  • [ Fig. 2. ]  (a) Distribution of samples through the learning process of self-organizing map (SOM). Samples are distributed according to 32 waterbird species. Waterbird communities at each sample (total 92 samples) were assigned to 48 SOM output neurons and arranged in a two-dimensional lattice (8×6). The numbers in each cell indicate samples that are randomly assigned. Neighboring samples on the SOM share similar waterbird species. Roman numerals indicate (sub) cluster. (b) Clusters and subclusters (I, II, III, and IV) of neurons were identified based on hierarchical cluster analysis with the Ward linkage method using Euclidean distance. The smallest branches are indicated by a combination of letters and numerals in the dendrogram and correspond to the SOM neurons.
    (a) Distribution of samples through the learning process of self-organizing map (SOM). Samples are distributed according to 32 waterbird species. Waterbird communities at each sample (total 92 samples) were assigned to 48 SOM output neurons and arranged in a two-dimensional lattice (8×6). The numbers in each cell indicate samples that are randomly assigned. Neighboring samples on the SOM share similar waterbird species. Roman numerals indicate (sub) cluster. (b) Clusters and subclusters (I, II, III, and IV) of neurons were identified based on hierarchical cluster analysis with the Ward linkage method using Euclidean distance. The smallest branches are indicated by a combination of letters and numerals in the dendrogram and correspond to the SOM neurons.
  • [ Table 1. ]  Comparison of number of species and individuals in relation to self-organizing map clusters. Data are expressed as mean±S.E. Different letters (a, b, c) indicate significant differences among clusters based on Nemenyi-DamicoWolf-Dunn test (P < 0.05)
    Comparison of number of species and individuals in relation to self-organizing map clusters. Data are expressed as mean±S.E. Different letters (a, b, c) indicate significant differences among clusters based on Nemenyi-DamicoWolf-Dunn test (P < 0.05)
  • [ Fig. 3. ]  Characteristics of habitat types by farming methods for each cell. The importance of each habitat type is represented by grey scale and size in each cell. Dark cells, which are derived from mean value of samples in each neuron, represent high importance. White and hatched cells indicate no environmental data and only one data set, respectively. Cell size is inversely proportional to the standard deviation of the mean for the cell. The presence of the Clusters panel is to remind the reader about the division of the self-organizing map into (sub)clusters.
    Characteristics of habitat types by farming methods for each cell. The importance of each habitat type is represented by grey scale and size in each cell. Dark cells, which are derived from mean value of samples in each neuron, represent high importance. White and hatched cells indicate no environmental data and only one data set, respectively. Cell size is inversely proportional to the standard deviation of the mean for the cell. The presence of the Clusters panel is to remind the reader about the division of the self-organizing map into (sub)clusters.
  • [ Table 2. ]  Prediction of waterbird species and evaluation of important feature of farming practices for each indicator species using random forest model. Indicator is based on the IndVal in indicator analysis
    Prediction of waterbird species and evaluation of important feature of farming practices for each indicator species using random forest model. Indicator is based on the IndVal in indicator analysis
  • [ Fig. 4. ]  Self-organizing map illustrating the distribution patterns of 32 waterbird species. The degree of shading represents the occurrence of waterbird species, ranging from low (light shading) to high (dark shading). Dark cells indicate a strong association in sites located in a neuron. The self-organizing map is the same as that used in Figure 3. The shading is independently for each waterbird species. Species with identical self-organizing map patterns represent similar habitat requirements. The highest IndVal recorded for a given species, and the respective significance level (*P < 0.05; **P < 0.01; ***P < 0.001), are shown for each species. Values are presented as log scales.
    Self-organizing map illustrating the distribution patterns of 32 waterbird species. The degree of shading represents the occurrence of waterbird species, ranging from low (light shading) to high (dark shading). Dark cells indicate a strong association in sites located in a neuron. The self-organizing map is the same as that used in Figure 3. The shading is independently for each waterbird species. Species with identical self-organizing map patterns represent similar habitat requirements. The highest IndVal recorded for a given species, and the respective significance level (*P < 0.05; **P < 0.01; ***P < 0.001), are shown for each species. Values are presented as log scales.
(우)06579 서울시 서초구 반포대로 201(반포동)
Tel. 02-537-6389 | Fax. 02-590-0571 | 문의 : oak2014@korea.kr
Copyright(c) National Library of Korea. All rights reserved.