The effectiveness of Official Development Assistance (ODA) is an important issue for academic researchers and policy-makers of government. The main interest of previous literature is placed on whether ODA has a positive effect on economic development in the recipient country or not. Prior studies show different and contrasting conclusions on the effectiveness of ODA on the recipient country (Clark, 1991; Islam, 2003; Radelet, 2006; Berthelemy, 2006; Clay et al., 2009; Haaparanta and Virta, 2007; Mori et al., 2009).
However, the donor’s benefits from ODA are a different, but important, issue. Early studies on ODA had been carried out for an insight into the donor’s political and economic effectiveness of ODA, and the results were used as a basis for the justification of ODA participation (Hyson and Strout, 1968; Hopkin, 1970; Levitt, 1970; Toye and Clark, 1986; Fitzpatrick and Storey, 1988; Clark, 1991; Jepma, 1991).
However, as global economic recession is prolonged and problems of sovereign risk and needs for supporting domestic lower-income classes have arisen in the donor countries, some scholars argued that the legitimacy and effectiveness of ODA should be re-examined (Zarin-Nejadan et al., 2008; Clay et al., 2009). Under these circumstances, the Republic of Korea joined the Direct Assistance Committee in 2010, and changed from the status of a recipient to that of a donor. Thereafter, many researchers and policy-makers in the Republic of Korea have begun to show their interests in the government ODA programs. Considering the domestic economic situation, however, they argue that ODA should be effective and beneficial for the Korea economy in addition to being pure aid for the lower-income recipient country. This point of view requires a more strategic approach. In reality, recent ODA tends to change from pure aid to parallel pursuit of donor’s interests (Berthelemy, 2006; Martinez-Zarzoso et al., 2009). The United States declared that the purpose of ODA is to maintain national security and promote domestic economic gain (Wagner, 2003).
However, some recent studies argue that ODA does not necessarily help donor economy (Tajoli, 1999; Johansson et al., 2006). ODA to less-developed countries (LDCs) may be good for the donor. For developing countries with some level of economic power, however, lower tariffs and support for trade with more market opportunities might be better than ODA for the donor (Clark, 1991). Both aid mechanisms and internal political and economic conditions of the recipient country could be parameters determining the effectiveness of aid (Johansson et al., 2006; Johansson and Pettersson, 2009). And so some donors that pursue economic benefits from ODA supports would like to assist developing countries with some level of their economic development (Clark, 1991; Johnson et al., 2003; Berthelemy, 2006).
Like this prior literature has suggested, the donor’s economic benefits from ODA vary with the recipient’s political and economic situations and their national systems of innovation. This point formed the basis of further research, and so the objective of this study is to examine the factors that increasingly benefit the donor’s economic interests from its ODA support. To do so, this study focuses on the characteristics of the recipient country, particularly on the level of its absorption efforts and technological innovation efforts based on science and technology (S&T) in the recipient country along with the different technology level of the donor’s product exports.
Section 2 reviews prior studies and develops the hypothesis. Section 3 describes the research methodology, section 4 discusses the results, and section 5 concludes the study.
II. Literature Review and Hypothesis
The ODA programme, initiated purely for economic support to laggard countries, has transformed as a mechanism to simultaneously serve the donor’s interests and domestic requirements (Berthelemy, 2006; Martinez-Zarzoso et al., 2009; Wagner, 2003). From this point of view, donors may intend to promote economic development of recipient countries through ODA and help them to become important trade partners with human and natural resources. Eventually, ODA is expected to contribute to sustainable development of the donor economy.
At the same time, the donors can use their surplus human and natural resources along with their ODA programs. Ireland’s case in the 1980s is a typical example (Fitzpatrick and Storey, 1988). However, increase in exports to the recipient countries could be the largest economic benefits for donors (Arvin and Choudhry, 1997; Zarin-Nejadan et al., 2008). In particular, if aid is directly linked to mutual trade, the influence on the donor’s exports becomes larger (Zarin-Nejadan et al., 2008). An old ODA study on the United States showed that income growth in recipient countries results in an increase in imports from abroad, including from the donor country, indicating a positive relationship between income increase and import volumes from the donor country (Hyson and Strout, 1968). Recent research also analyses effects of ODA on the export of the donor country, showing that exports increase by 35 cents per dollar from a direct effect and by 98 cents from an indirect effect (Wagner, 2003).
For ODA, the donor provides its goods and services at much lower prices compared to normal prices through international organizations such as the World Bank, EDF, etc., but the aid may generate considerable benefits to the donor and contribute to the donor’s international balance of payments (Jepma, 1991; Toye and Clark, 1986) and expand the market share of firms within the donor economy in the recipient country (Fitzpatrick and Storey, 1988; Clark, 1991; Tajoli, 1999; Lloyd et al., 2001; Osei et al., 2004; Zarin-Nejadan et al., 2008).
ODA can affect trade directly and indirectly. The direct effect is subject to critical opinion (Vogler-Ludwig, 2002; Martinez Zarzoso et al., 2008), but in most cases ODA is directly linked to trade contracts as, for example, in tied aid and thus suppliers from the donor country can have an advantage against their competitors and increase their market share (Clay, 2009; Nilsson, 1997; Wagner, 2003; Nowak-Lehmann et al., 2008).
Recently, however, indirect benefits to the donor economy through pure aid without conditions have been receiving more attention (Clay, 2009). The indirect effects may attribute to mainly goodwill from the recipient country, a deeper understanding about the recipient country’s culture, and better knowledge on its markets (Arvin and Baum, 1997; Vogler-Ludwig et al., 1999; Zarin-Nejadan et al., 2008). Arvin and Baum (1997) suggest that the recipient country purchases more products and services if it receives greater support, and this is supported by Vogler-Ludwig et al. (1999) and Zarin-Nejadan et al. (2008) who show that unconditional German ODA has a positive relationship to its credit and export.
Through the ODA programme, the donor may understand the political and economic situations, the culture, and markets in the recipient country more easily. Information barriers could be reduced with trade in goods and services through ODA (Zarin-Nejadan et al., 2008). Political, social, and environmental information on the developing country often influences policy changes in the donor country (Clay, 2009).
Although there is evidence that ODA could contribute to the donor’s exports to recipient countries directly and indirectly, Arvin et al. (2003) showed there might be various factors determining the relationship between ODA and the donor’s export to the recipient. For example, the donors may increase the recipients’ dependence on them by supporting development of technical standards and infrastructures through technology transfer to recipient countries. This particularly happens in IT sectors in which standards and network effects play an important role (Zarin-Nejadan et al., 2008). The research implies that the effects of ODA and their results might be different by sectors, between high-tech and medium-and-low-tech sectors. Thus we will verify the hypothesis as follows:
H1 ODA effects on donor’s exports to recipient country differ by sectors (high-tech vs. low-and-medium tech).
Meanwhile, a series of studies show that in the early stage of economic development, ODA helps economic growth of the recipients, but without continuous internal absorption efforts, the recipient country’s competitiveness is weakened and subordinated to the donor country’s interests (Johansson, 1994; Aitken and Harrison, 1999; Hu and Jefferson, 2002; Tu et al., 2011). In addition, when the national innovation system is vulnerable to political and socioeconomic problems in the recipient countries, ODA might not contribute to their economic development (Guillamont and Chauvert, 2001) or might be an obstacle in some cases (Radelet, 2006). For example, Malaysia with a relatively high R&D investment (0.7%) compared to its neighbours has successfully achieved economic development by exploiting ODA support from advanced countries (Chandran-Govindaraju and Wong, 2011). Singapore and Hong Kong have successfully caught up by absorbing advanced S&T from foreign countries and by expanding their knowledge base of S&T for economic development (Santamaria et al., 2008).
On the other hand, Vietnam with a low national R&D investment rate has experienced difficulty in achieving a high level of industrialization because of the low level of its efforts for developing a national capacity of innovation by utilizing foreign resources through ODA (Mori et al., 2009). Thailand with a low level of R&D investment (0.2%) also has faced obstacles in the development of production industries because of its failure to successfully absorb advanced technology in spite of enormous FDI from advanced economies (Intarakumnerd et al., 2002). These researches imply that the effectiveness of ODA in the recipient country might be dependent on its absorption capacity or internal efforts that are closely linked to the national innovation system (Cohen and Levinthal, 1989; Burnside and Dollar, 2000; Hansen and Tarp, 2001; Johnson et al., 2003; Berthelemy, 2006; Radelet, 2006; Haaparanta and Virta, 2007).
On the other hand, the recipient countries with a good national innovation system could substitute imported products with their locally manufactured goods through internal learning efforts like reverse engineering, which could be a ladder for economic catch-up (Haaparanta and Virta, 2007; Lee and Lim, 2001; Fu et al., 2010). Rather, in this case the increase of purchase power in the recipient countries may negatively influence the exports of donors. And the effects of external aid on the recipients’ imports from the donors could be interplay with the recipients’ internal S&T innovation efforts to appropriate for their industrial needs (Mori et al., 2009; Intarakumnerd, 2011).
From the review of above researches, the following hypotheses can be suggested on the relationship between the donor’s exports and the developing country:
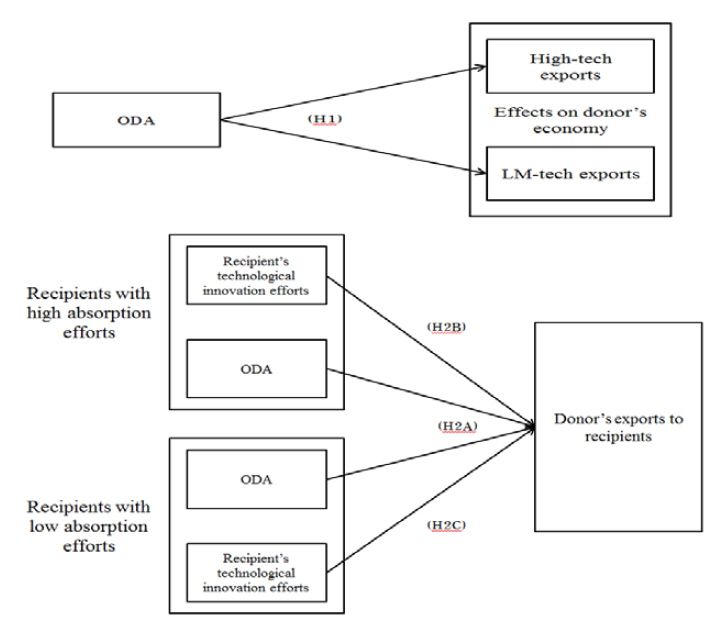
H2A ODA to recipients with higher technological innovation efforts has negative effects on the donor’s exports to the recipient country. H2B For the recipient country with high level of absorption efforts, the higher level of technological innovation efforts in the recipient country negatively influence the donor’s exports to the recipient. H2C For the recipient country with low level of absorption efforts, the higher level of technological innovation efforts in the recipient country positively influence the donor’s exports to the recipient.
This study verifies these hypotheses empirically according to the conceptual model shown in Figure 1.
The data for this study was collected from the World Bank, IMB, Census, and UN Comtrade databases for the period 1999 to 2009. The data include information on USA’s ODA to 31 countries including Argentina, Bangladesh, Bolivia, Brazil, Burkina-faso, Cameroon, Chile, China, Columbia, Croatia, El Salvador, Ethiopia, India, Indonesia, Jamaica, Jordan, Lebanon, Madagascar, Malawi, Malaysia, Mexico, Moldova, Morocco, Oman, Pakistan, Panama, Philippines, Senegal, Thailand, Uganda, and Vietnam. Missing values in the time series of variables were presumed in the most reasonable and rational way. For example, the average of the preceding and succeeding values was considered for a missing value. When two consecutive values were missing, the value was imputed to change every year proportionately. All values were converted to real values by eliminating the inflation effect of the US dollar and changes in the currency exchange rate.
Quantitative variables such as size of ODA, GDP, level of technological innovation efforts, and FDI are also based on per capita values (that is, total amount divided by population). This method lowers the possibility of multicollinearity due to labor cost differences in the recipient countries. The level of external support and recipient’s absorption efforts was measured by a generally used method, and this value has a high correlation with another value of interest, level of technological innovation efforts. Thus two groups were considered for high- and low-absorption efforts of recipients. The criterion used was the average of R&D investment per capita from 1999 to 2011.
2.1 Dependent Variables
The dependent variable was measured for high-tech and medium-to-low-tech imports from the United States. US exports to recipients were calculated by country for high-tech and LM-tech products of international standard (Zhu et al., 2011). Per capita values were considered to eliminate the effect of population change on international trade, and 1990 currency units were used to control for exchange rate and monetary value changes.
2.2 Independent Variables
This study focuses on two independent variables: the size of ODA and the level of technological innovation efforts of recipients. The size of ODA from US to recipients was measured on per capita basis. In the case of technological innovation efforts of recipients, the R&D intensity of a country was usually used as a proxy for its technological innovation efforts. However, there were so many missing values of R&D intensity of the recipient countries, so we considered an alternative for R&D intensity. Oyelaran-Oyeyinka (2006) and Coccia (2010) also used the number of journal papers per 1,000 people and R&D intensity together for indicating the level of S&T of a country. In addition, Wang and Huang (2007) also used the number of S&T journal papers as a direct output of technological innovation activities of a country. Therefore, in this paper the number of journal papers per 1,000 people, which has high correlation with R&D intensity of a country, was used as a proxy for the technological innovation efforts of recipients.
2.3 Control Variables
There could be many factors influencing the effects of the ODA on the exports (Hyson and Stout, 1968; Clark, 1991; Vogler-Ludwig, 2002; Wagner, 2003; Zarin-Nejadan et al., 2008, Martinez Zarzoso et al., 2008). In addition, the exports of an economy could be affected by many other factors. Therefore, we incorporated those factors as the control variables into our empirical model. First of all, FDI size per capita, GDP per capita, and the entrance rates of advanced education institutions in a country are indexes indicating the level of the country. In particular, GDP per capita is a proxy variable for average level of income and is related to the purchasing power. The number of documents for import clearance and the US dollar exchange rate are closely related to the recipient’s trade. Our dataset also showed that these variables are highly correlated to the exports of both the high-tech and medium-to-low-tech products. So these variables were used to control for the potential effect on the donor’s exports.
Meanwhile, the size of the other country’s ODA could also directly influence the imports of the recipient countries. Thus, the remaining ODA (i.e. total ODA minus US ODA) divided by the population of the recipient country was considered as a control factor. Finally, some countries, e.g. so-called BRICs (Brazil, Russia, India, and China) which is both a recipient and a donor, could have specificity and be differentiated from other least developing countries in terms of impacts on global economy, size of international trade, and the industrial development stage. Thus we controlled these countries by using the BRICs as dummy variables. In addition, a country’s absorption efforts could be typically measured by the R&D intensity of that country (Cohen & Levinthal, 1990). As mentioned above, however, there were many missing values of R&D intensity of the recipients and those values would have high correlation with the number of science and engineering papers. So we considered the recipients’ R&D intensity by dividing two groups of recipients, i.e. recipients with high absorption efforts and low absorption efforts. To do so, we used the mean value of the R&D intensity by recipients from 1999 to 2011 as the critical value for dividing the recipients group.
3. Characteristics of the Sample
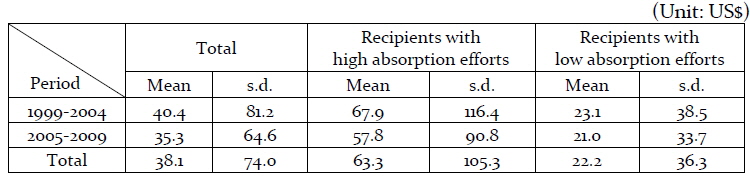
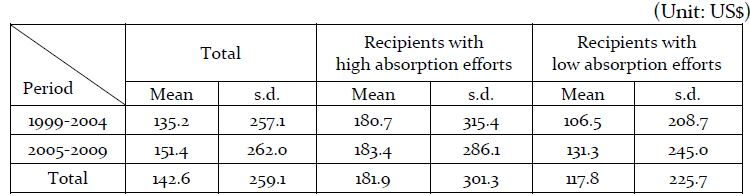
The exports of high-tech products from US (donor) to recipient countries decreases on average, and the standard deviation of it also decreased in total. However, the size of the decreased exports of high-tech products of US was larger to recipient countries with high absorption efforts than to recipient countries with low absorption efforts (see Table 1). In contrast, the exports of LM-tech products from US to recipients were increased in total (see Table 2).
[Table 1] Per capita high-tech exports of US to recipients

Per capita high-tech exports of US to recipients
[Table 2] Per capita LM-tech exports of US to recipients

Per capita LM-tech exports of US to recipients
Table 1 shows that high-tech product exports per capita of US (donor) dropped in both average and standard deviation for different countries over both periods. The fall in exports to low-R&D countries was smaller than the decrease in exports to high-R&D countries. In contrast, Table 2 LM-tech product exports of US to recipients have increased on average during the investigating period, the rate of increase being larger in recipients with low absorption efforts than those with high absorption efforts.
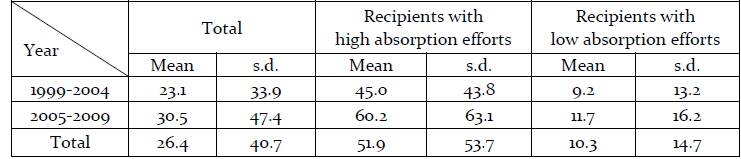
Considering that the number of papers published in S&T journals is the proxy variable for the technological innovation efforts of recipient countries, the level of the technological innovation efforts of recipients with high absorption efforts is higher than that of recipients with low absorption efforts over the overall period since 1999.
As shown in Table 3, the technological innovation efforts of the high absorption efforts group of recipients increased 30% faster from 2005 to 2009 compared to the period 1999 to 2004. However, in the low absorption efforts group, the rate of increase is just 10%. This suggests that recipients with high absorption efforts are much more interested in learning S&T knowledge and in absorbing it from advanced industrial countries.
[Table 3] Number of papers published in S&T journals per 1,000 people

Number of papers published in S&T journals per 1,000 people
The panel data used in this study is listed by year and country. The Hausman-Taylor test was performed to choose a proper model for parameter estimation, showing that the null hypothesis for the random effect model was rejected and thus the fixed effect model proved adequate. In addition, the autocorrelation in the error term could be a problem in the efficiency of parameter estimation. A Wooldridge hypothesis test showed a first-order autocorrelation in the error term. From these results, a fixed effect model with first-order autocorrelation was finally estimated.
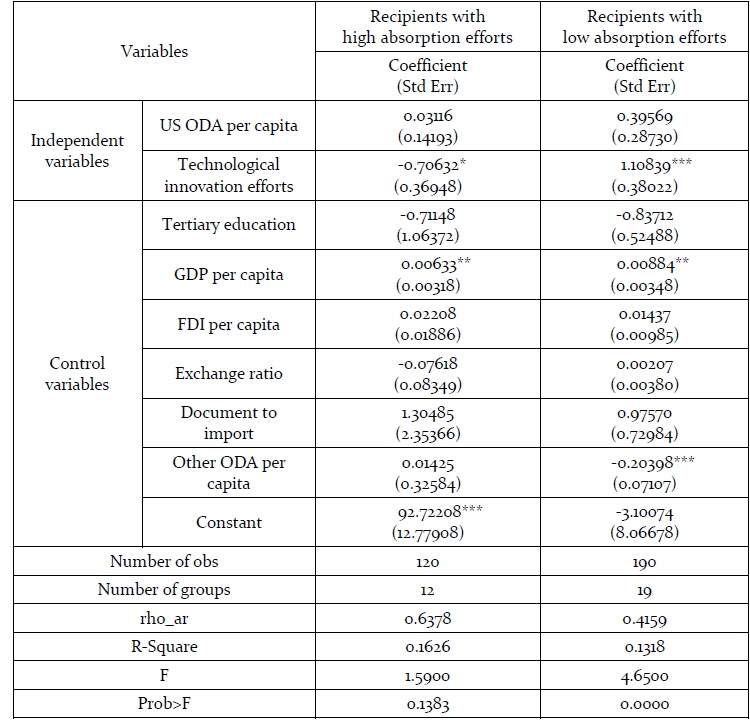
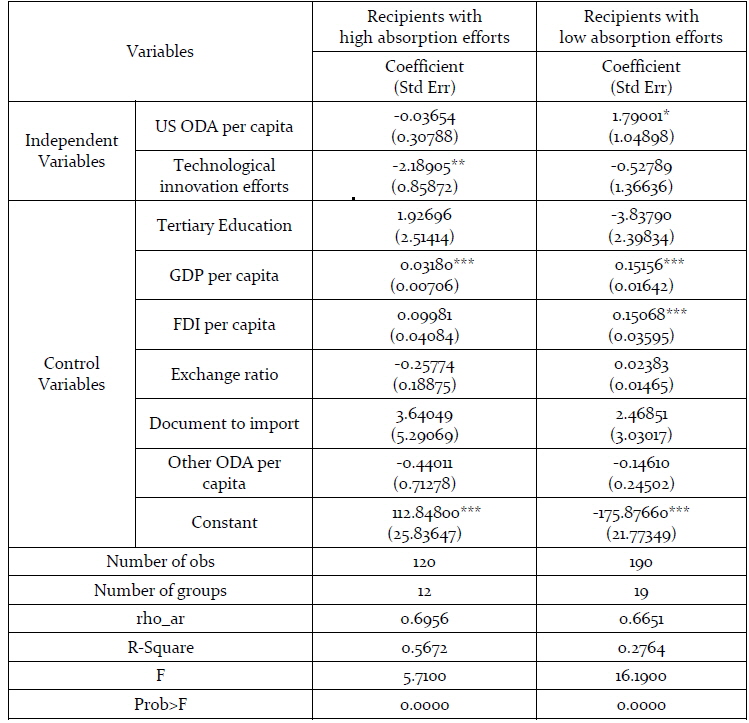
Table 4 shows the estimation results of high-tech product exports of US as a donor to recipients. From the estimation results, both recipients with high absorption efforts, i.e. above-average R&D investments relative to GDP and recipients with low absorption efforts do not show any statistical evidence regarding a relationship between ODA volume and high-tech imports from US at the 10% significance level. However, with respect to the estimated coefficients of the ODA volume from the US, the coefficient for the high absorption efforts group of recipients is much larger for the low-R&D group. This implies that ODA donor’s high-tech exports to recipient countries with relatively low absorption efforts could be more advantageous than to those with relatively high absorption efforts.
[Table 4] High-tech exports per capita of US (Donor) to recipients

High-tech exports per capita of US (Donor) to recipients
Interestingly, although ODA from other donor countries except the United States is used as a control factor, ODA from other donor countries except the US has a strong negative relationship, with high-tech exports from the US in particular, to the relatively low absorption efforts group of recipients at the 1% significance level. Zarin-Nejadan et al. (2008) showed an existence of a strong competitive relationship in terms of donors’ exports to a recipient among ODA donors, which is also supported by the results in this paper.
Meanwhile, Table 4 shows evidence of a strong relationship between the level of technological innovation efforts of recipients and the high-tech product exports from the US donor, and interestingly the relationship goes in the complete opposite direction between the two groups of recipients. That is, when the ODA recipients is above average absorption efforts, the relationship between the level of technological innovation efforts of recipients and the high-tech product exports from the US donor was negative at the 10% significance level. This suggests that the technological innovation efforts of recipients results in substitution of foreign product imports (Haaparanta and Virta, 2007; Amsden and Chu, 2003; Islam, 2003; Collier and Dollar, 2004).
On the contrary, the relationship was strongly positive for recipients with low absorption efforts at the 1% significance level. This result could be understood as the low absorption efforts group of recipients is more dependent on the imports of high-tech products from donor countries for their technological innovation activities. This is not only because less developed recipient countries are typically oriented to simple manufacturing by OEM, placing them at a low end in the value chain (Intarakumnerd et al., 2002; Mori et al., 2009) and but because thus their technological innovation efforts are mainly focused on the manufacturing activities, generally increasing the imports of capital goods that are difficult to be substituted with domestic products (Dai and Jin, 2011). In fact, there are some previous researches showing cases that an ODA program causes the crowding-out effects and so recipients are more dependent on its imports of technology and/or products from foreign countries (Aitken and Harrison, 1999; Hu and Jefferson, 2002; Amsden and Chu, 2003). Additionally, this paper indicates the empirical evidence suggests that such crowding-out effects could be particularly relevant to hi-tech products.
Investigation regarding the relationship between exports of LM-tech (low-and-medium-tech) products to recipients from a donor country and independent variables is shown in Table 5. The estimation result shows directly the evidence that the relationship between ODA size per capita and the LM-tech products exports from the US donor depends on the absorption efforts level of the recipients. We cannot find any evidence of such relationship for the high absorption efforts groups of recipients, but it is certainly positive for the recipients with low absorption efforts at the 10% significance level although the statistical significance is weak. This result indicates that the ODA could produce an affirmative positive effect on the low-and-medium sectors of the donor economy as well as when the ODA is supported to the recipients with low absorption efforts rather than to those actively engaged in learning from advanced countries. Unlike the high-tech sectors, LM-tech products exports from US ODA to the recipients do not show any difference in regard to the recipient’s absorption efforts in the case of non-US ODA.
[Table 5] LM-tech exports per capita of US (Donor) to recipients

LM-tech exports per capita of US (Donor) to recipients
On the other hand, we found an affirmative difference regarding the effects of technological innovation efforts of recipients on LM-tech product exports with performance of the US, and this result is quite distinct from the case of its high-tech product exports. For the recipients in the group with above average absorption efforts, US exports of LM-tech products is affected more strongly and negatively by technological innovation efforts compared to US exports of high-tech products at the 5% significance level.
More interestingly, with respect to the low absorption efforts group of recipients, the estimation coefficient of the technological innovation efforts is reversed from positive to negative for US exports of the LM-tech products although it is not statistically significant at the 10% level. In general, S&T activities in developing countries result in substitution of foreign product imports, particularly in the low-and-medium sectors (Haaparanta and Virta, 2007; Amsden and Chu, 2003; Islam, 2003; Collier and Dollar, 2004), and so many developing countries that want to catch up to advanced countries tend to select the target sectors for primarily catching up (Findlay, 1978; Fu and Gong, 2008; D’Agostino and Santangelo, 2012).
In addition, firms fallen behind may successfully catch up by using skilled employees and establishing manufacturing capabilities in the LM-tech sectors in spite of moderate learning and absorption efforts (Metcalfe, 1988; Bender and Laestadius, 2005; Laestadius et al., 2005). Actually, Fu and Gong (2008) showed that Chinese laggards successfully caught up to the western firms and passed ahead in some LM-tech sectors. The estimation result of this paper could be understood at the same level of these prior researches.
ODA has recently been receiving increasing attention. As Korea joined the DAC in 2010, it changed from a recipient to a donor. In the present study, unlike in most studies based on the recipient’s viewpoint, economic benefits of donors from ODA were analysed and verified for recipient countries with different characteristics. The implications for an ODA strategy were developed with a balanced perspective. The results are summarized as follows:
First, economic benefits (particularly exports performance) that a donor can get from ODA supports vary with the recipient’s absorption and localization efforts. Second, in the case of high-tech exports to ODA recipients, there is no special difference between high- and low- absorption effort groups, but we found that there is an affirmative and positive effect on the LM-tech product exports of the US particularly to recipients characterized by relatively low absorption efforts from the ODA support. Third, in both high-tech and LM-tech sectors, exports of the US as a donor to recipients tend to be substituted with local products by recipients’ increase of technological innovation efforts in the high absorption efforts group, but if a recipient in the low absorption efforts group increased technological innovation efforts, it also interestingly increased the donor’s high-tech products exports to the recipient.
This study empirically provides an important policy implication: it is advantageous to provide ODA to countries with low absorption efforts from the strategic viewpoint of the donor. However, data for all donors and recipients were not available, and only the relationship between US ODA and its recipients was analysed and verified. In a future study, ODA data for all donors and recipients needs to be analysed and relevant hypotheses verified.
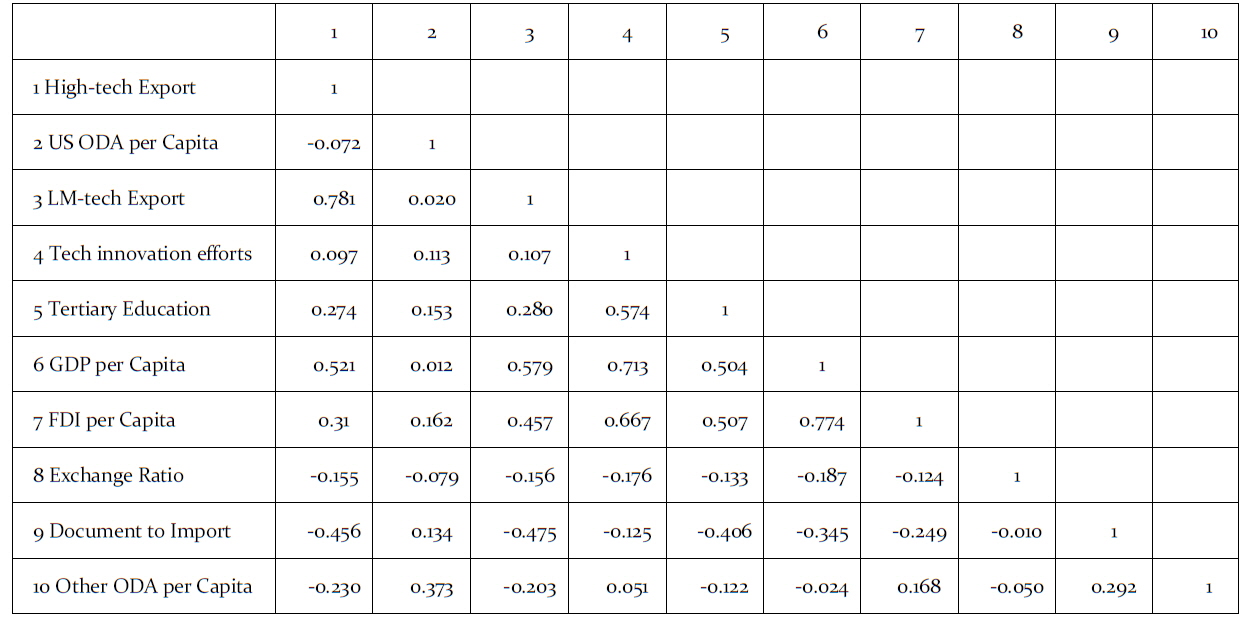
[Table A1] Correlation among variables

Correlation among variables