The purpose of this study is to find what competence determines the employment of college students using data from the K-CESA (Korea Collegiate Essential Skills Assessment) of a Korean university during 2009-2014. This test comprises of 6 categories of competence: self-management, global readiness, interpersonal relationship, resource/information/technology handling, communication and comprehensive reasoning. In addition to these competences, we add the comprehensive variable, grade point average. In order to identify the qualities of employment, employment was classified into 3 types: all employment, employment in decent jobs and employment in the top 500 companies. Results are as follows: For all employment and decent jobs, GPA and comprehensive reasoning were the meaningful variables. However in case of the top 500 companies, interpersonal relationship was added. Based on the analysis, this study suggests the fundamental concepts of college students’ job competence: job specific competence, job basic competence, and basic competence.
Korea’s college enrollment rate has remained about 70% since 2010. However, the employment rate of college graduates remains in the range of 52-56% since 2010. Furthermore, the employment rate of graduates in humanities and social science is 45.5%, while that of science and engineering is 65.6% (KEDI, 2014).
Enrollment rate is fairly high compared to international level, but employment rate is very low. The enrollment rate was 69% in 2012, which is 11% higher than that of the OECD average of 58% (MOE, 2014). The employment rate of Korea was 78.1%, and the average of OECD was 84.2%. Those of Australia, Finland, England, Japan were above the average, and France, Canada, USA were below the average (OECD, 2014).
Thus, the employment rate of college students is due to each university’s agenda as well as a national agenda. Furthermore, it is the problem of graduates and the fact that the employment market is worsening makes this problem more difficult.
First, the age of retirement begins generally near 55 years old and 180 companies, but under a new law the age will be expanded to 60 from 2016. According to a survey of the Federation of Korean Industry, the bill will reduce new recruits in 72.4% of companies (DongA Newspaper, Dec 12 2014)
Moreover, the resignation rate of new employees within a single year was 25.2% in 2014 and the rate has continued to rise. While the biggest reason is ‘failure of adaptation to organization (47.6%)’, this rate is still increasing (Korea Employees Federation, 2014). In short, 52-56% of graduates are hired but one-fourth of them resign within their first year. Therefore, both job competence of students and hiring competence of companies must be checked.
Until now, according to the critique of the employment market, students regarded résumé, also known as so-called “spec”, as the key condition for employment. However major companies are leaning toward the direction of evaluating practical competence. For example, the largest conglomerate, Samsung, announced their recruit policy will be reorganized drastically from the fall of 2015. In addition to the traditional paper test, they want to strengthen the interview process and diversify the selection criteria along with the job description (Economist, Nov 17 2014). It is expected that other companies, following Samsung, will shift towards evaluating the applicant's practical competence starting from the fall of 2015.
Unlike conglomerates, small enterprises have smaller human resources or recruiting offices, or the offices open only during hiring season. Thus it is impractical for many small and medium companies to deal with or develop their own job competence models; Building selection criteria for a job, competence-focused recruiting system and avoidance of risks of early resignation are few examples of the model.
In order to support these problems, Korean government developed and distributed ‘The Core Competence Evaluation Model’ since 2013, and its application is increasing: 30 companies in 2013, and 180 companies in 2014. About 70.8% of these companies are satisfied with the model and 77% have responded that they will positively continue to use the model (Money Today, Dec 15, 2014). This fact proves that recruiting based on job competence is spreading.
Due to the spread of the new hiring trends focused on competence, 58.2% of the college students feel burdensome. The reasons they feel are “more to prepare for (37.2%)”, “what to prepare is ambiguous (32.7%)”, “it is hard to define what companies want (24.5%)”, and that “private education fees for preparation will increase (5.6%)” (Digital Times, Feb 24, 2014)
Colleges cannot neglect the duty of educating job competence of students. It is necessary for each college to set detailed education tracks for desired job competence. In particular, they need to prepare special or non-curriculum courses for the students of liberal science, and other activity support programs. However, it is a prerequisite to understand competence, and what competence is needed to fit the job description. Employment education based on scientific and objective evidences must be conducted.
Therefore, this study investigates the core competence that decides college students’ employment. This study requires data of students’ core competence as well as employment statistics. We got data from a university located in the capital area of Korea. Data on job competence evaluation was acquired through students who took the K-CESA (Korea Collegiate Essential Skills Assessment), a tool developed by the Korea Education Development Institute. In short, the purpose of this study is to find out the core competence of university students for employment, analyzing data of students who took the K-CESA in the university A.
Employment studies utilizing college data are Jung and Lee (2005), Cho (2011), Cho, Kim and Kim (2008) and Choi (2012). Also studies utilizing K-CESA are Jin, Son and Chu (2011), Paik (2013), Jin (2013), Lee (2012), Cho (2014), Kim and Lee(2014), Kang and Cheon (2014) and Lee and Kim (2014). However studies linking K-CESA with employment are not found.
This study consists of the following: Section 2 introduces theoretical origin and development progress of competence, core competence and K-CESA. Section 3 discusses research data and analysis method; and section 4 presents analytical results. Section 5 summarizes research results, and adds theoretical discussions and the issue of practical implementation.
1. Competence and Core Competence
While the word competence refers to ability to do something and competency as God-given ability, the definition of competence varies based on the context. Theory on competence starts from individuals, and evolves to the issues of organization through the concept of core competence, and currently the term competence and core competence are used at both the individual and organization level.
The scholar who built the research fundamentals of competence at the individual level is McClelland (1973). He compared the difference between ‘superior performers’ and ‘average and/or poor performers’ to prove characteristics related to superior performance.
The literatures and definitions of competence at individual level in the order of appeared time are as follows:
Competence is a domain of knowledge and skill that has economic effect in producing specific field (McLagan, 1989). Competence is defined as personal characteristics that are effective and having superior performance when evaluated in specific situations or jobs. It comprises of knowledge, skill, self-concept, trait and motive (Spencer and Spencer, 1993). Competence is an assembly of knowledge, skill, and attitude necessary to effectively accomplish duty or task under various conditions (Dubois, 1993). Competence is composed of 3 dimensions (knowledge, skill, attitude), and is classified into individual competence (job competence), management competence and organizational competence (core competence) (Sparrow, 1996). Competence is traits in knowledge, skill and ability that allow the distinction of superior performer from average performer (Mirabile, 1997). Competence is ability, skill, knowledge, attitude and experience necessary to perform successfully in a certain job (Jung, 2004). It is an ability that creates competitive edge through integration of various skills or skill sets, rather than a specific skill or performance (Lim, 2004). Competence is ‘a set of internal traits necessary to exhibit superb outcome’ (Ministry of Employment and Labor (MOEL), Core Competence Assessment Model, 2013). Competence is ‘a continuous and secure trait of each individual, such as activity, knowledge, skill, experience and value that are related to accomplishing a quality outcome under an organization’s internal/ external condition (Korea Employment Information Service (KEIS), Youth Employment Competence Program Manual, 2014).
At first the concept of ‘core competence’ was not for the level of individual competence, but rather was initially proposed for marketing strategy to find superior factors from competing companies (Hamel and Prahalad, 1990). In case of an organization or a company, core competence is the accumulated source of competitions, and the expression of such source of competitions is represented in the form of products. In other words, core competence is not the specific product but rather it is the hidden comprehensive ability that helps the appearance of such products (Seol, 2011). Due to the concept of core competence,
Due to the concept of core competence, recent debates on individuals have been subdivided into categories such as core competence and job competence. Because we are focused on individual competence, let us discuss the existing studies and definitions of core competence of the individual.
Out of all competencies the minimum common required competence for all organization members is core competency (Dubois, 1993). In order to investigate core competence for individuals' successful life and social contribution, DeSeCo (Definition and Selection of key Competence) project was pushed forward by OECD; core competence was divided into three categories, each of which was subdivided into 3 competences. So a total of 9 core competences were proposed (OECD, 2005). Core competence is not a distinct or special ability possessed by each student, but it is rather a basic and universal ability that all must learn through college education (Park, 2011). Core competence is defined as fundamental competence required for any position or duty. As the social requirement for what to do and not what to know is emphasized, the importance of core competence is highlighted (Jin, 2013).
Besides, competence is recognized by Korean institutions as follows:
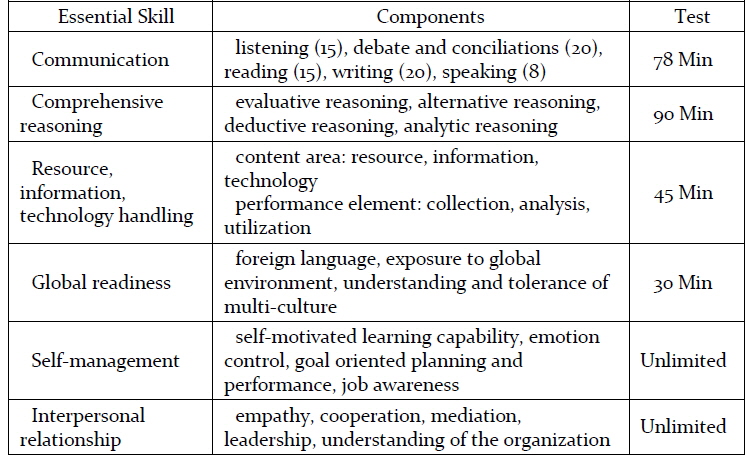
Competence can be divided into detailed competences which depend on jobs and common competence not related to job. Common competence includes mathematics, target consciousness, building interpersonal relationships, teamwork, understanding organizations, problem solving skill, defiance spirit, self-improvement, global mind, information and technology utilizing skill, communication and ethics awareness (MOEL, Core Competence Assessment Model, 2013). Common competence refers to basic attitude and ability of organi-zational members and it is also required for the people being employed regardless of their job rank or occupational category (KEIS, 2014). Essential skills are commonly required knowledge, skills and attitude in successfully performing duty in most jobs. And they can be divided into communication, comprehensive reasoning, resource information tech-nology handling, global readiness, self-management and interpersonal relationship (KRIVET, 2007; K-CESA Homepage, 2015).
The K-CESA (Korea Collegiate Essential Skills Assessment) is a tool developed by MOE (Ministry of Education) and KRIVET (Korea Research Institute for Vocational Education and Training) in order to measure the basic job ability of college students and to ultimately support their employment. Essential skills in their terms can be defined as knowledge, skill and attitude commonly required in successfully performing tasks regardless of occupational categories or positions given. And essential skills are composed of communication, comprehensive reasoning, ability of resource/information/technology handling, global readiness, interpersonal relationship and self-management (K-CESA Homepage).
2. Studies on Correlation between GPA and Employment
There are fair numbers of studies showing no correlation between GPA (grade point average) and employment (Chung and Lee, 2005; Choi, 2012; Lee and Kim, 2008; Kim and Seo, 2013; Cho, Kim and Kim, 2008; Noh, Park and Huh, 2011). No correlation has backed up by several reasons: higher GPA results in vanity, leading to overlooking employment preparation; the discrimination of GPA due to GPA inflation; companies considering more factors than GPA; low GPA students making downward applications that give them a higher chance of getting hired. On the contrary, there are many studies showing the positive effect of GPA on employment (Cho, 2011; Hwang and Paik, 2008; Kim, 2009; Chae and Kim, 2009; Nam, Yoon and Lee, 2010; Park, 2011).
Regarding correlation between GPA and big companies, many studies point out that GPA has positive effects on employment (Chung and Lee, 2005; Hwang and Paik, 2008; Park and Chun, 2009; Choi, 2012; Nam, Yoon and Lee, 2010; Park, 2011; Moon and Noh, 2013). Also some studies argue the opposite (Lee, Lee and Lim, 2014; Nam, Yoon and Lee, 2010; Chae, 2007).
There are a few studies that utilized the database of each college in Korea (Chung and Lee, 2005; Cho, Kim and Kim, 2008; Cho, 2011; Choi, 2012). These studies were mixed on the correlation between GPA and employment.
In brief, existing studies on correlation between GPA and employment or GPA and employment for big companies lack consistency. The reason may be because the existing studies did not analyze the differences of GPA by major. To support this, the GPAs of employed and unemployed graduates of university A from 2010~2014 were compared. As shown in Table 2, in case of engineering students, the GPA of employed graduates were higher than that of unemployed graduates, but in case of humanities’ graduates the GPA of employed and unemployed showed almost no difference. Hence, GPA may affect employment for engineering but not for humanities.
[Table 2] Difference between employment and GPA
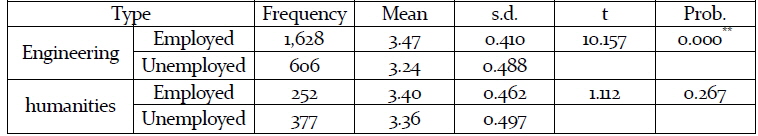
Difference between employment and GPA
3. Studies Based on K-CESA Result
The studies analyzing K-CESA can be divided into two kinds. The first one is related to correlation analysis between K-CESA competence level and college students’ individual factors (Jin, Son and Chu, 2011; Paik, 2013). Usually the relationships among grade, major, location and gender are analyzed. Especially Jin (2013) showed that higher the grade is, higher the competence score.
Second is the comparative study between assessment scores and actual competence of students. Although Lee (2012) analyzed the relationship with study achievements, there were no statistically accepted results. Cho (2014) analyzed relationship with self-efficacy. Kim and Lee (2014) analyzed relationship between multi-cultural experience and K-CESA global readiness; and Kang and Chung (2014) analyzed the relationship between nursing students’ K-CESA score and clinical nursing capability. Lee and Kim (2014) analyzed correlation between college students’ personality types and K-CESA emotional core competence.
Although K-CESA is a measuring tool related to college students’ employment ability, there were no studies that analyzed relationship with employment. In order to raise the effectiveness of K-CESA, empirical research for employment is necessary.
This is a study of 260 students who took the K-CESA and graduated between 2010~2014 from university A, located in the capital area of Korea. The reason for such a small number of students is because employment data is caught few years after taking the K-CESA test. 49.4% of the students are male and 50.4% are female. The percentile of major-fields is engineering 40.0%, humanities and social science 46.9% and natural science 13.1%. The employment rates are: 61.2% for all companies, 37.7% for decent jobs and 20.8% for the top 500 companies. The employment rate for top 500 companies was relatively high for males and in engineering.
Moreover, the evaluation on the qualitative level of employment could be unreasonable depending on each individual, in addition to whether if the materials used in evaluating the job was collected in a secure and objective manner. Therefore, in this study, each of the independent variables was selected for the presence of employment envy in the workplace group and in the largest 500 companies in order to analyze the impact on the quality of employment. In this study, we determined quality of job as either employment in decent jobs or in the largest 500 companies.
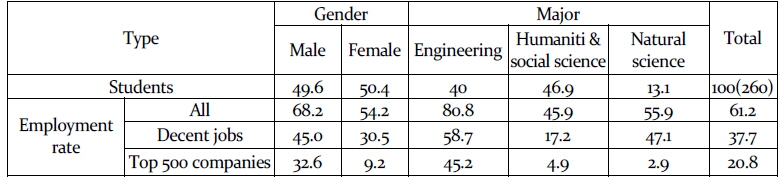
Data (%)
The decent jobs refer to jobs including top 1,000 companies, public institute/hospital, finance/insurance/securities companies, specialized jobs, schools, public servants, public enterprise, non-profit corporation, association and press. The top 500 companies and 1,000 companies refer to the companies within 500th and 1,000th in total sales in the KorCham DB.
All data is from the university's internal source. But the value of variables used in the analysis is in various types, so the original values should be transformed to comparable types. For example, the perfect score of GPA is 4.5 and the K-CESA competence index is in percentile. Therefore they were standardized (
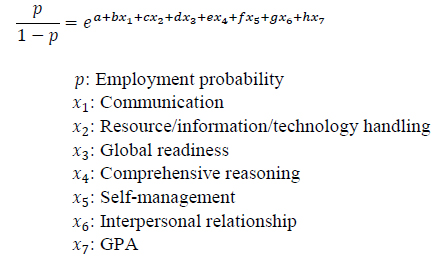
The analysis was done under 3 definitions of employment: all employment, decent job employment and employment in the top 500 companies. Each definition of employment was used as dependent variables in regression analysis with 7 independent variables: 6 competence variables as shown in table 1 and GPA.
[Table 1] Components of K-CESA

Components of K-CESA
Before the regression analysis, whether the employment definitions with competence variables were statistically acceptable was evaluated through the t-test. The logistic model was used for regression analysis, since the data value are 1 (employed) or 0 (unemployed) according to the employment state. Therefore the regression analysis was conducted separately for the 3 job definitions. Also each regression analysis started with 7 independent variables to find variables with statistical significance. Specifically, logistic regression analysis was performed applying the WALD method (backward removal).
The results of regression analysis were converted into the employment response function to identify the effect on employment of the changes in each competence value. In other words, the employment response function was recomposed using coefficient values. In this function, employment effect of each competence variable was calculated.
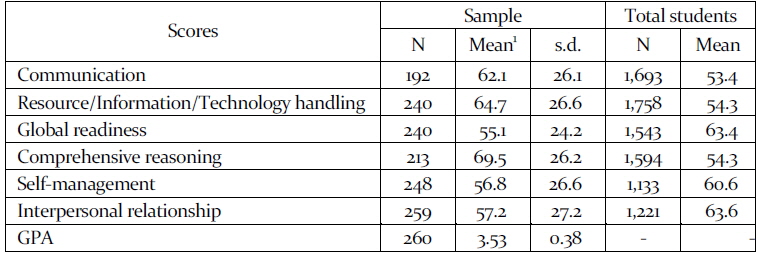
Among 260 students selected at an earlier stage, the data for insincere respondents in each evaluation region of the K-CESA were removed. The GPA mean is 3.53. The highest competence is “comprehensive reasoning” (69.52) and the lowest is “global readiness” (55.10) as shown in Table 4. Each means value of sample data and all the students of the university A, who took K-CESA during 2011~2014, was compared. The mean values of “communication” and “resources/information/technology handling” of the sample data were relatively higher and “global readiness”, “self-management” and “interpersonal relationship” were relatively lower than that of the students who took K-CESA.

Basic statistics
In order to identify the samples’ competence level, we measured that of all the students nationwide. If we set the T value of each competence of nation-wide college students as 50, the means of T value of the university students is as follows: communication 50.7, resource/information/technology handling 53.5, global readiness 51.9, comprehensive reasoning 53.2, self-management 50.7 and interpersonal relationship 52.1. The university's competence levels are higher than those of nation-wide students.
2. Significance Test of Employment by Variables
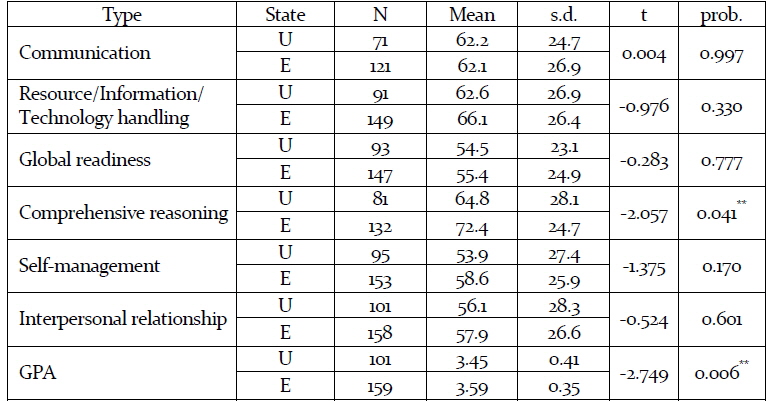
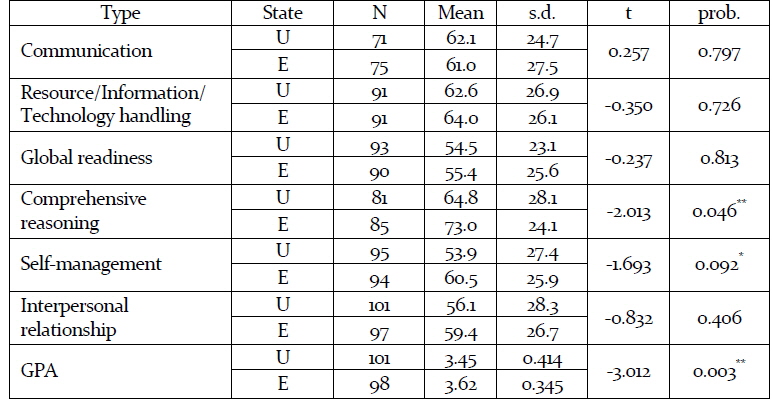
Table 5 shows the difference of significance tests of K-CESA’s 6 competences and GPA on employment. Only GPA and comprehensive reasoning were significant between employed and unemployed. Comprehensive reasoning which was statistically acceptable of employed was 72.39, and that of unemployed was 64.83. The GPA of employed was 3.59, slightly higher than that of unemployed of 3.45.
[Table 5] Significance tests of competences on employment

Significance tests of competences on employment
Table 6 verifies the statistical significance of the relationship between competences and employment at the decent jobs. Similar to employment to all companies, GPA and comprehensive reasoning were statistically significant. Additionally self-management competence showed statistical significance. Students who got decent jobs had a higher GPA, comprehensive reasoning and self-management competence than those of unemployed.
[Table 6] Significance tests of competences on decent jobs
Significance tests of competences on decent jobs
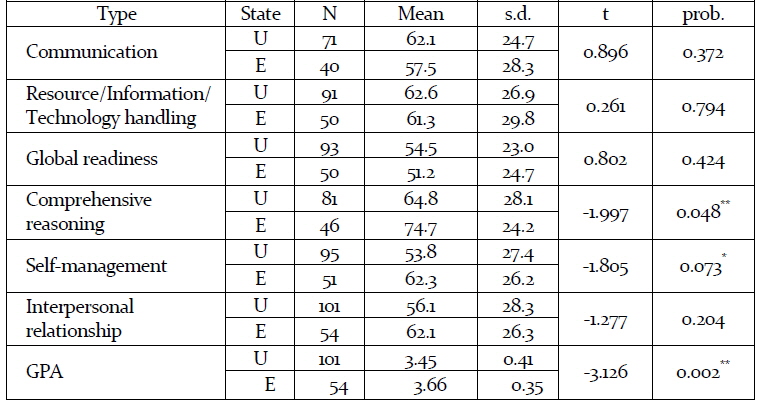
As shown in Table 7, as for the employment state of the top 500 companies, GPA, self-management and comprehensive reasoning competence proved to have statistical significance. Also employed proved to have higher GPA, self-management and comprehensive reasoning competence over the unemployed.
[Table 7] Significance tests of competences on the top 500

Significance tests of competences on the top 500
3. Logistic Regression Analysis
3.1 Employment in All Companies
Next, this study analyzed the logistic regression model that used each competence variable as independent variables. Because dependent variable takes the form of employed (1) or unemployed (0), the logistic model was selected as the optimal form of the regression analysis.

Before starting logistic regression analysis with state of employment, the classification accuracy of data was measured. The result was 64.7%, a satisfactory level.
In the regression analysis, a total of 7 independent variables were used. However, considering the means difference tests that showed some variables with no statistical significance, 6 stage tests were done to find which set of independent variables was appropriate for the regression model.
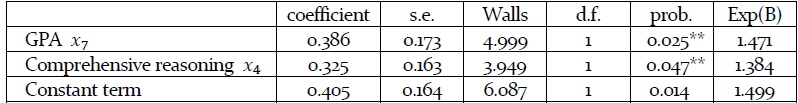
The 6 step test was done in the following sequence. First, all the 7 variables were assumed as independent variables and the least statistically significant variables were eliminated, and reassumed. This process was repeated 6 times and the final result is shown in Table 8. In the final model, GPA and comprehensive reasoning were significant within 5% significant level.
[Table 8] Decisive competence for employment
Decisive competence for employment
The logistic response function based on this result was formed in the following manner.
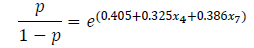
Also the function can be restructured for employment probability as below.
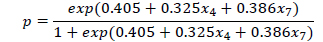
The function represents that 1% increase in comprehensive reasoning means 1.384% increase in employment probability, and 1% increase in GPA means 1.471% increase in employment probability. Hence, considering the fact that perfect GPA of 4.5 is converted into 100, 0.045 increase in GPA results in 1.471% increase in employment probability.
3.2 Employment at the Decent Jobs
The logistic regression analysis was conducted for the employment at the decent jobs as well. The data classification accuracy was at a fair level of 59.4%. And the regression analysis was done with 5 steps but it showed very little difference from all employment. That is, only GPA and comprehensive reasoning showed statistical significance within 5%.
[Table 9] Decisive competence for decent jobs
Decisive competence for decent jobs
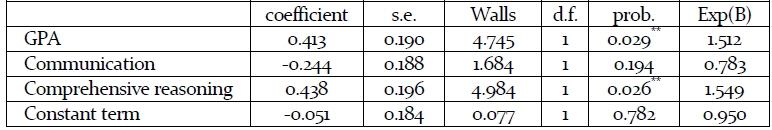
As the result of logistic regression analysis, employment probability in the logistic response function with two variables is shown below. This represents that 1% increase in comprehensive reasoning means 1.549% increase in employment probability, and 1.512% in GPA.

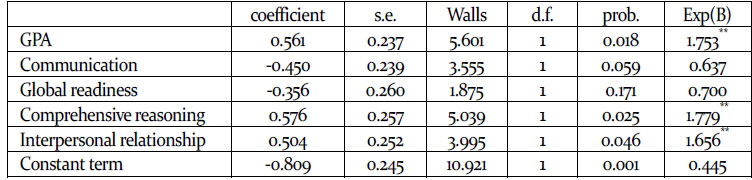
[Table 10] Decisive competence for top 500 companies

Decisive competence for top 500 companies
3.3 Employment at the Top 500 Companies
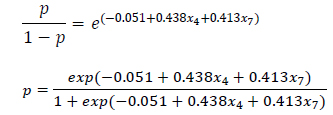
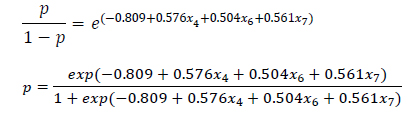
The regression analysis for employment at the top 500 companies was conducted only by 3 steps. As above, GPA and comprehensive reasoning were the key competences in employment. In addition to them, interpersonal relationship competence became key factor.
The logistic response function and employment probability using the result of regression analysis is as following: 1% increase of comprehensive reasoning means 1.779% increase in employment probability; 1.656% increase in interpersonal relationship; and 1.753% in GPA.

This study analyzed the job competences for employment by categorizing employment into 3 types: employment in all companies, employment in decent jobs and employment in the top 500 companies. The job competence is configured by the Job Competence Evaluation Model of K-CESA, and it consists of competence in communication, resource/information/technology handling, global readiness, comprehensive reasoning, self-management, and interpersonal relationship. Additionally, students’ basic index, the GPA, was added as an independent variable.
In employment in all companies and employment in decent jobs, GPA and comprehensive reasoning were the significant variables. However for employment in the top 500 companies, interpersonal relationship was added; where GPA, comprehensive reasoning and interpersonal relationship were the main determinants of employment.
It was unexpected that many of the competences of K-CESA rendered were irrelevant to employment, even though K-CESA is a measuring tool for employment capability. There are many explanations why it is. First, K-CESA consumes long period of time (almost 5 hours) in examination. Thus students tend to lose concentration after a certain amount of time which may result in low credibility of the examination values. Due to the difficulty of the K-CESA test, students may give up certain portions of the test and only focus on rest. Secondly, it is highly likely that the job competences of K-CESA were not made from experiences or practical studies but rather they were extracted from existing studies or theoretical basis. Third, because the measuring period and employment period differ, students may have reinforced their weaknesses, meaning that the measuring result may not directly link to employment itself. According to Jin (2013), all the 6 K-CESA competences of seniors were higher than that of freshmen
2. Job Competence Model for College Students
This study, rather than raising problems of core competence and job competence, poses a more fundamental issue. K-CESA presents the above 6 competences as common core competences applicable for all occupations. But this study believes that 1) required competences by jobs are different, 2) amongst the 6, there exist job competences emphasized more in each job, and 3) a set of these job competences determines a student’s holistic image or competences.
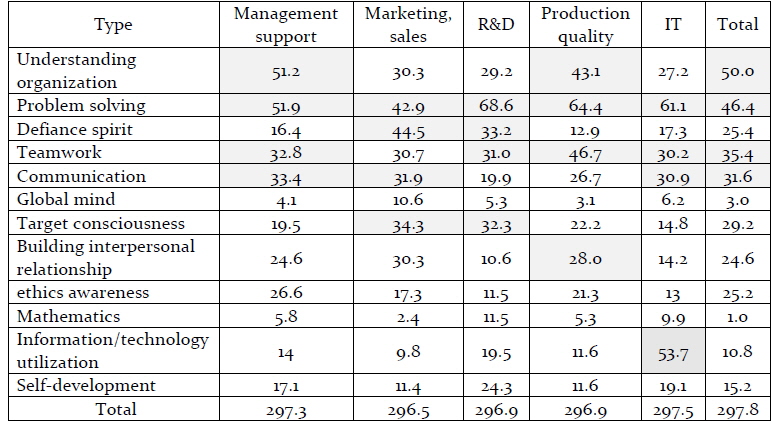
Similar opinions exist in industries. Table 11 shows the sets of job abilities that recruiting managers look for. Here in field of marketing and sales, problem solving, defiance spirit, communication and target consciousness are stressed. On the contrary, IT field emphasizes problem solving, teamwork, communication and resource/information/technology handling. And each job requires different weights on each competence. Marketing and sales field prioritize defiance spirit (44.5), problem solving (42.9), target consciousness (34.3) and communication (31.9). IT field prioritize problem solving (61.1), information/technology utilization (53.7), communication (30.9) and teamwork (30.2). The table is from the surveys of the recruiting managers of the 500 companies that uses the WorkNet (http://www.work.go.kr).
[Table 11] Difference of job competences by recruiters

Difference of job competences by recruiters
The 12 common competences required by companies shown in Table 11 are set in the Core Competences Evaluation Model developed by Ministry of Employment and Labor (MOEL) for recruiting officers. Also the MOEL are deducting 5 core competences for each occupational field from field interviews, advanced studies and advices from experts. Currently they have derived core competences for production quality, management support and cashier of finance and insurance sectors. And they are planning to derive core competences for all occupational fields (MOEL 2013). This means that each job requires different set of competences.
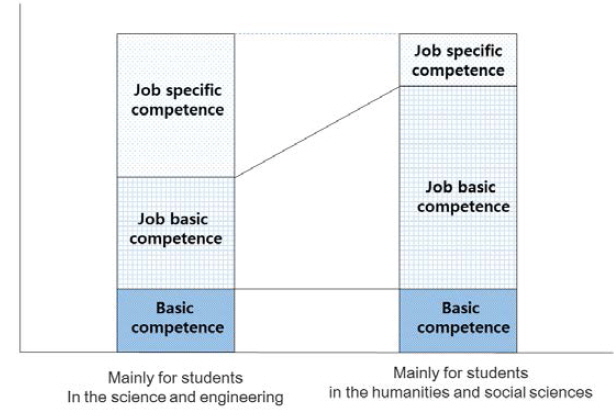
Let us check the differences by jobs by examining K-CESA global readiness. The required competences of global readiness for a job for overseas sales differ from those of domestic production management. Then, in order to distinctly find requirements for global readiness, it is necessary to segment global readiness into global readiness for basic competence of college students and global readiness for basic competence of any job. Further, we classified college students’ competence into job specific competence, job basic competence and basic competence. The definitions are as following.
Job specific competence: Competence required by a job that can be cultivated through major in the college or internship, mostly by knowledge in the field. Lack of this competence makes employment almost impossible. Job basic competence: It is a set of competences for a job, in many aspects made through disciplines in the same academic fields, not just by professional knowledge. Higher the level of this competence, easier the employment will be. Basic competence: a set of competences that all college students must have regardless of their major or job.
Especially amongst the above, although job basic competence is generally developed through courses and non-curriculum activities, it cannot be measured with grades, and therefore requires a separate measuring tool. At a college student’s point of view, identifying the main competences required by a desired job and measuring the relative level of those competences will aid in developing career path.
The concept of job competences for each job can be formed like this:
Competences for Job Group A = f (a1C1,a2C2,a3C3a4C4) Competences for Job Group B = f (b2C2,b4C4,b5C5b6C6) Whereas ai, bi are weights of importance.
Therefore a set of job competence is given in the form of
Then how is core competence pointed out by Hammel and Prahalad (1990) perceived? Regardless of job difference, a student’s core competence is not determined by the number of job competences (
3. Limitations and Future Study
This study uses the test results of K-CESA. K-CESA may need following improvements. First, to improve validity and credibility of K-CESA, participation rate for it must be raised, since the rate of K-CESA students are too small. However, according to field observation, raising the rate is difficult without compulsion. Second, even for diagnosing identical job competence, the composition and difficulties of the problems must vary according to students’ major field or desired job. Third, instead of the total test of the K-CESA for all majors or occupations, it should be selectively applied to majors and desired jobs. Moreover, the result of K-CESA must be revised and improved to measure job competences and be used as a self-improvement guide or for career path counseling.
This study points out GPA as an equally important decision factor. But there is no in-depth analysis or contemplation of GPA in the paper. This is because the study’s view on GPA is comprehensive. GPA may represent a set of occupational knowledge in a specific major and takes the role of improving job competence. Also it indicates some fundamental characteristics or attitudes such as patience. Therefore, further study between GPA and employment is needed.