The purpose of this study is to compare the valuation of technology firms in the KOSPI and KOSDAQ. This study analyzed 224 market reports for KOSDAQ firms and 602 reports for KOSPI firms. We compare the two markets under 3 definitions on the accuracy of stock price forecasting. Findings are as follows: Although PER multiples is the most used method of valuation, KOSDAQ valuation more heavily relies on the method than KOSPI valuation. In stock market, the period of earnings forecasting is mostly 2-3 years. Multiples of KOSDAQ is generally higher than those of KOSPI. Even for technology firms, valuation in KOSPI mostly relies on earnings of the company, but that in KOSDAQ mostly relies on relative price. In stock price forecasting, generally overestimation prevails. Moreover, forecasting of KOSPI reports is more accurate than that of KOSDAQ reports. ROE and COE of KOSDAQ firms are generally higher than those of KOSPI firms.
How do we measure the value of technology? And further, how do we measure the value of technology firms? We answer this question from the different perspective of the valuation in stock market. Stock market is the final destination of technology startups, so valuation in stock market gives impact to all the valuation of technology startups and eventually commercialization of technology.
This study focuses on the Korean stock market, which has two markets like KOSDAQ similar to NASDAQ of the United States and KOSPI like the US NYSE. Reflecting the research objective, if we focus on the studies on the Korean stock market, most researches are on just before and after IPO; Kim, Lee and Kim (2000), Kim, Jeong and Kim (2004), and Yun and Lee (2004) used the Black-Scholes (BS) model to analyze venture firms of KOSDAQ. Lee and Jeong (2011) also used the BS model for the valuation of photovoltaic material technology of a KOSDAQ company using the generalized method of moments for the probability process of basic assets. Ju (2011) used Luehrman’s (1998) modified BS model and found the BS model is stable in identifying trends and reliable in estimating market price. Lee and Oh (2004) changed the option model of abandonment of Byrgstahler and Dichev (1997) in various types and checked the effectiveness of those models in KOSDAQ firms. Seol and Yoo (2002) suggested various types of the real options model. Lately, Messica (2008) and Goldenberg and Goldenberg (2009) found the BS model is suitable for KOSDAQ venture companies.
As for valuation related studies, Saito (2012) found that new entrants in NASDAQ tend to be valued by book value, but net profit becomes the main sources of valuation for normal firms. In S&P 500 companies in the New York stock exchanges, even firms having a big portion of intangible assets have different tendencies with technology firms of the NASDAQ. That means profit is the main concern in valuation of technology in the case of S&P 500 companies. Cho and Seol (2014) found that even technology firms in KOSDAQ are valued by relative prices based on net earnings.
Then, what is the difference in the valuation of technology firms between KOSDAQ and KOSPI? KOSDAQ is the stock market mainly for technology businesses, while KOSPI is the stock market for sizable firms across all industries. In light of this difference, the two stock markets may use different valuation methods.
This study wants to clear up these questions. The purpose of this study is to compare the valuation of technology firms in KOSDAQ and KOSPI. We use the result of Cho and Seol (2014) for the valuation of firms in KOSDAQ, which analyzed 224 market reports on technology firms. In addition, this study add the analysis of 602 market reports on 217 technology firms in KOSPI and compare the valuation traditions for technology firms in the two markets.
Many market reports for listed companies are issued for investors mostly by stock dealing companies. The reports analyze the firms in stock market and forecast stock price. Therefore, analyzing these reports shows the tradition of valuation such as understanding of value, methodology and application.
This paper presents literature review in section 2 and the research method and data in section 3. Section 4 deals with the analysis of methods used and section 5 deals with the analysis of forecasting accuracy by testing several hypotheses such as the accuracy by valuation method, and by industry or by firm types in both markets. Finally in section 6, we discuss the implications both in theory and practice and summarize this study.
This is a comparative study on the several aspects of valuation methods between KOSDAQ and KOSPI. The review of valuation methods, however, inevitably deals with the analysts’ ability to forecast stock price along with the valuation methods used. Further, studies of the representative stock market, the US stock market, have to be checked as a research milestone. This study reviews three types of previous studies.
The first stream is the studies on analysts’ ability to estimate earnings (Mikhail et al., 1997; Clement, 1999; Jacob et al., 1999) or their influence on stock price (Brav and Lehavy, 2003; Bradshaw, Brown and Huang, 2006). Unlike international studies, Korean studies, usually in the same study, generally deal with both the ability to forecast earnings and the ability to influence the stock price. Ahn, Shin and Jang (2005) reported that the more famous an analyst, the less their error ratio, which in turn allows more analyses, which further decreases their error ratio. Kim, Jeon and Lee (2011) analyzed that analysts are optimistic and analysts who were more correct had consistency in forecasting ability. Similar to this study, Kim, Eom and Seok (2011) analyzed the accuracy of analysts for high-tech and low-tech industries and found no difference between the two groups.
The second stream is about the valuation methods in stock market. Kang, Yu and Moon (2012) checked the accuracy of several variables used for multiples and found that book value is the best, followed by operating cash flow, net profit, operating profit and sales revenue. Oh and Kim (2011) tested the accuracy of the comparison method defined by the Inheritance and Gift Tax Act and found that PER multiples overestimated more than PBR multiples. Fernandez (2001) found PER multiples methods is the most used in the European market followed by EV/EBITDA multiples, and then the excess earning model.
The last stream of previous studies is the studies on the US stock market. Daa and Schaumburg (2011) found that forecasting of stock price by analysts for S&P 500 firms (1997-2004) was insufficient information for investors but valuable information for them. Meanwhile, Gray and Vogel (2013) found simple net profit without reconciliation is not much helpful for stock price forecasting.
This article adopts two methods: The first is the methods adopted in Cho and Seol (2014), which analyzed the valuation practice for technology firms in the KOSDAQ. Second is the comparative method between KOSDAQ and KOSPI.
The analytical method of Cho and Seol (2014) can be summarized as follows: First of all, technology firms are defined as firms in the manufacturing industry and firms whose main products are technology-based services such as game industry and IT service, etc., and excluded are the firms not having technological objects such as technology consulting. The hypotheses were tested through the F-test for the differences by groups. In case the results by the F-test were doubted, t-test was added. However, there was no conflict between two results.
The definitions for the accuracy of stock price forecasting following several studies (Asquith et al., 2005; Bradshaw and Brown, 2006; Bonini et al., 2010; Kim, Jeon and Lee, 2010) number 2: Whether target price at the end of forecasting period reaches or exceeds the actual price, and whether real price exceeds the target price even once during the forecasting period. The error rate by Cho and Seol (2014) is defined as the gap between actual price and target price at the end of forecasting period. Each hypothesis is accepted if at least two of the three definitions are satisfied; the accuracy is rejected if 1 of 3 definitions is statistically significant.
The hypotheses and test results from the former KOSDAQ study related to this article are as follows:
H1 Market approach that performs relative valuation is the most popular method, in stock market, even for technology firms. - accept H2 Stock market, even for technology firms, lays the greatest emphasis on net income for valuation among all other indicators. - accept H3 Multiples method is the most accurate method, for valuing technology firms in stock market. - reject H4 Stock price forecasting is less accurate in the industry having more intangible assets such as IT and bio than the industry with more of tangible assets such as machinery, materials and electronics. - reject H5 Startups, classified by the Korean Exchange, show low accuracy in stock price forecasting than mid-sized or general companies. - reject H5-1 The younger a company, the lower accuracy in stock price forecasting. - reject H5-2 The younger a company in listed age, the lower accuracy in stock price forecasting. - reject H6 The higher the price of technology firms, the more accuracy in forecast of stock price. - accept
This paper also hopes to check the above hypotheses except H5 for startups in KOSPI. If the same hypotheses are proved, then we can say the hypotheses are common characteristics of the Korean stock market. The new set of hypotheses is the same as H1-4, and H5-1 changes to H5, H5-2 to H6 and H6 to H7. In addition, we examine several comparisons between the KOSDAQ and KOSPI.
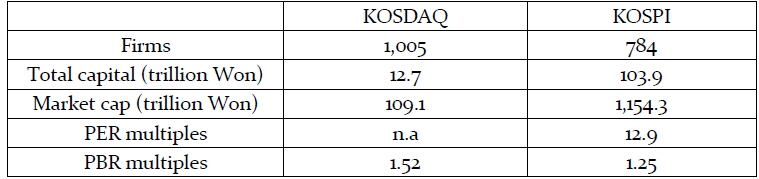
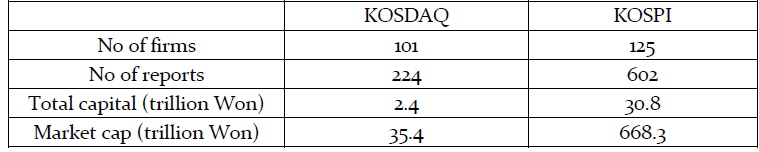
Total firms in KOSPI are 784 as of the end of 2012, and the market reports for these firms are 2,648. The numbers in KOSDAQ were 1,005 and 440. These numbers mean firms in KOSPI get more concern than those of KOSDAQ. There are 64 firms that have more than 10 reports in KOSPI. In particular, 13 firms have more than 13 reports; that means one or more reports per month. The highest number of reports for a single firm was 19 from various securities companies.
Cho and Seol (2014) analyzed 224 reports for 102 KOSDAQ firms among 440 reports. In this study, we added 602 reports of 217 firms chosen from 2,648 reports of KOSPI firms. Sample reports were selected under several criteria; Reports for non-technology firms were excluded. And the latest report was selected when there were many reports for a firm by one analyst.
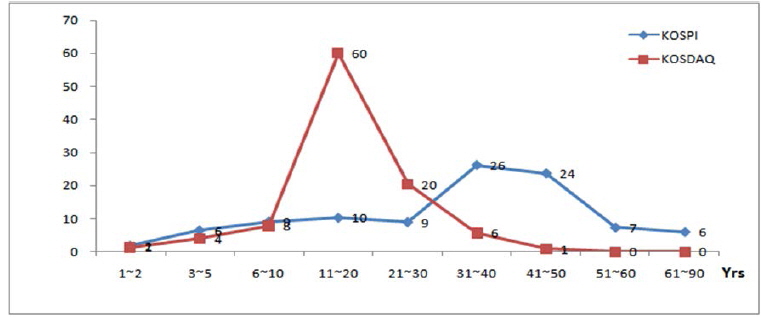
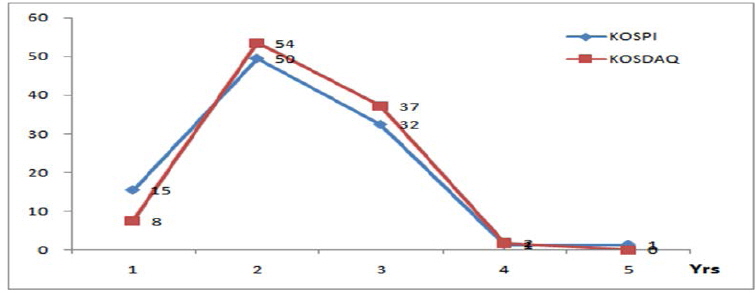
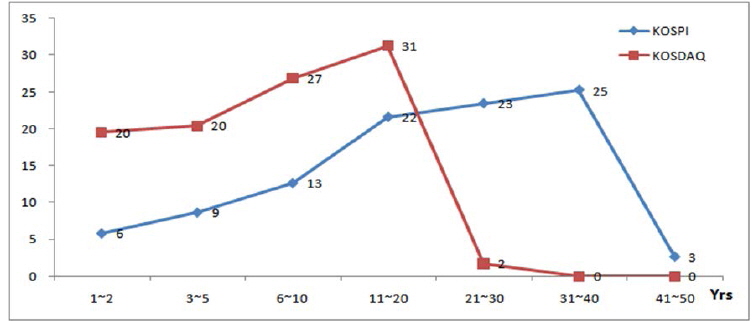
As shown in Figure 1 and Figure 2, as for age of technology firms, the average age of KOSPI samples was 33.1 years. The group of more than 30 years old was the biggest with 63% in KOSPI. On the contrary, the average age of KOSDAQ firms was 16.7 years, and the group of 11-20-year-old was the biggest with 60% in KOSDAQ. Generally, KOSDAQ technology firms are relatively younger than KOSPI firms. The listed age of KOSPI technology firms was 20.5 and the companies within 11-40 years were 70.3%. That of KOSDAQ samples was 7.7 and 98% was under 20 years.
IV. Analysis of Valuation Methods
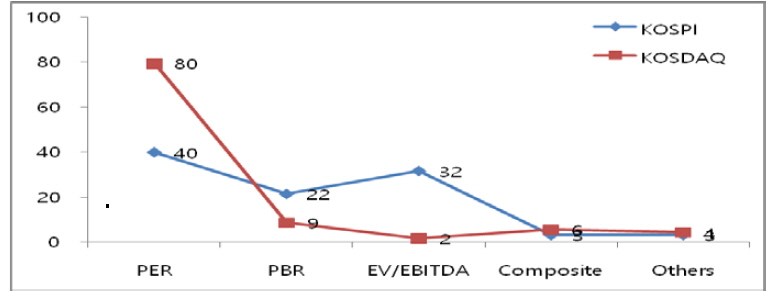
As shown in Figure 3, valuation methods in KOSPI and KODAQ are quite similar in terms of methods, but different in the distribution of major methods. In KOSDAQ, PER multiples are the most used method (80%) followed by PBR multiples (9%), and EV/EBITDA multiples (2%). On the other hand, 3 multiples methods are frequently used in KOSPI: PER multiples (40%), EV/EBITDA multiples (32%) and PBR multiples (22%). In summary, market approach is the main valuation method in two stock markets. The hypothesis 1 (H1) set in the KOSDAQ studies was “Market approach that performs relative valuation is the most popular method”. This is also true in KOSPI.
H2 was “even for technology firms, stock market lays the greatest emphasis on net income for valuation among all other indicators.” In KOSDAQ, 86% adopted the income-based methods with PER multiples of 80%, EV/EBITDA of 2%, RIM of 4% and DCF of 1 report. Also, in KOSPI, 74% of total reports adopted income-based methods with PER multiples of 40%, EV/EBITDA multiples of 32%, RIM of 2% and DCF of 4 reports. From these we can state that net income is the basis of valuation in stock market.
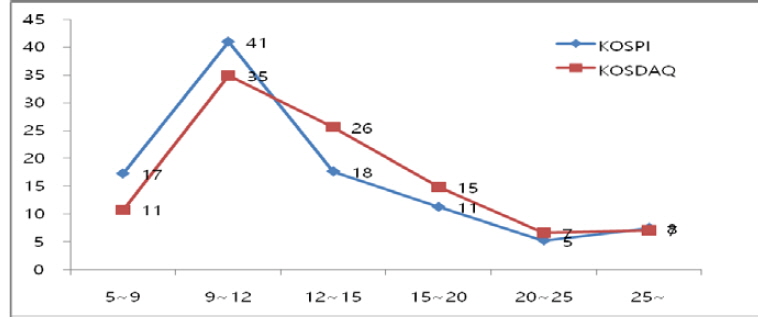
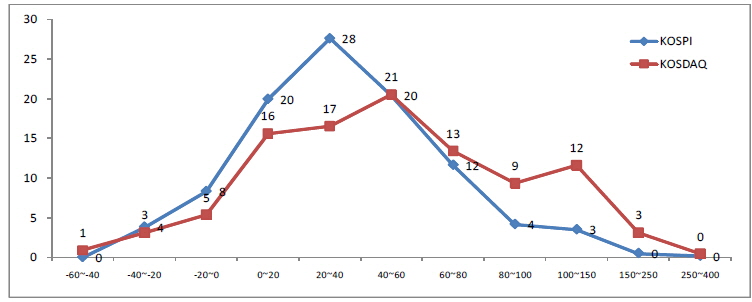
Figure 4 is the distribution of the PER multiples, which are the most used method in both markets. The range of multiples 9-12 were the most and the next were the range of 12-15. In KOSPI, PER multiples are distributed between 5-42, and the average was 13.7. Meanwhile, multiples of KOSDAQ was distributed between 5.8-82.3, and the average was 14.9. In general, average multiple of KOSDAQ is higher than that of KOSPI.
The KOSPI reports with PER multiples over 30 numbered 11; 5 chemical firms, 3 food firms, 2 IT firms and 1 bio firm. The highest PER was 42, which was given to a firm in the IT industry. The KODAQ reports with multiples over 30 numbered 7; 6 bio firms and 1 IT firm. The highest multiples of over 40 were 5 and all were bio firms. The multiples of a medical device firm in KOSDAQ numbered 82, the highest value. The distributions of PER multiples in both markets are statistically different from each other with a confidence level of 0.000.
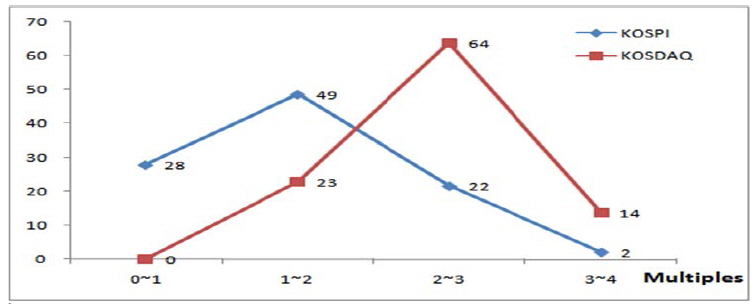
The average PBR multiples of KOSPI technology firms was 1.52 as shown in Figure 5, but that of KOSDAQ was 2.41, which is quite higher than KOSPI. More than 70% of KOSDAQ technology firms using PBR multiples are firms in the electronics industry.
Only 4 reports with EBITDA multiples are in the KOSDAQ, and the range of multiples were 4-8. Also 70% of KOSPI are in the range of 4-8. The cases are too small, so we omit further description. Anyway, we can state that multiples of KOSDAQ is generally higher than those of KOSPI.
The number of years for profit forecasting for technology firms is similar both in KOSPI and KOSDAQ. The forecasting of 2-3 years numbers 91% in KOSDAQ and 82% in KOSPI. There is no statistical difference of distribution with a probability of 0.000.
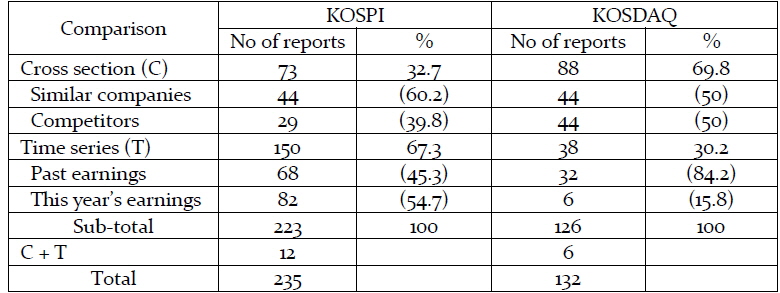
PER multiples are the most used in two markets, so we examined the rationale of multiples. The reports that had clear rationales of multiples are 235 in KOSPI and 132 in KOSDAQ as shown in table 1. In KOSPI, time series rationale was 67.3%, but cross section rationale was 69.8% in KOSDAQ.
[Table 1] KOSPI and KOSDAQ (2012.12)

KOSPI and KOSDAQ (2012.12)
[Table 2] Comparison of samples
Comparison of samples
Specifically on a cross section comparison, half of KOSDAQ reports found the rationale from the comparison with domestic and foreign competitors, and another half with similar companies. Meanwhile, competitor comparison in the KOSPI was 40%, and 60% with similar companies. As for time series comparison, past data was dominant with 84.2% in KOSDAQ. On the contrary, forecasting of this year’s earning was the biggest rationale with 54.7% in KOSPI. These findings can be interpreted as follows: Even for technology firms, valuation in KOSPI mostly relies on earnings of the company, but that in KOSDAQ mostly relies on relative price.
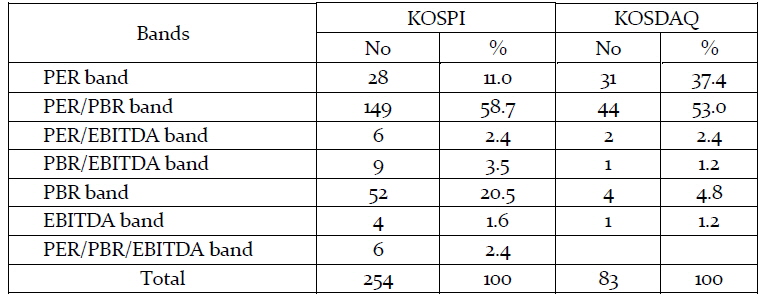
PER band, PBR band or EBITDA band shows historical trends of each multiples, which show whether the stock price is overvalued or undervalued. In both markets, mixed use of PER/PBR bands was the most used with 58.7% in KOSPI and 53.0% in KOSDAQ followed by PBR band in KOSPI (20.5%) and PER band in KOSDAQ (37.3%). In KOSDAQ, PER band seems to be the major band and PBR band may be a supporting band to PER band. However, in KOSPI, PBR band works by itself.
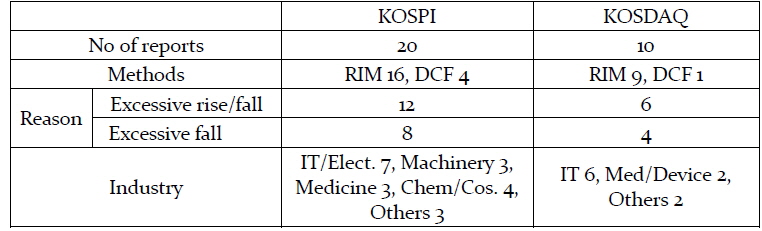
As shown in Table 3, among 602 KOSPI reports, 23 used non market approaches. The income approach was used in 20 reports and 3 reports used mixed methods of comparison method and other methods. The residual income model was used at 16 reports, and the traditional discounted cash flow method was used in 4 reports. In KOSDAQ reports, we found 10 income approach reports: residual income model (9) and the discounted cash flow (1).
[Table 3] Rationale of multiples
Rationale of multiples

Reference bands
[Table 5] Reports using income approach
Reports using income approach
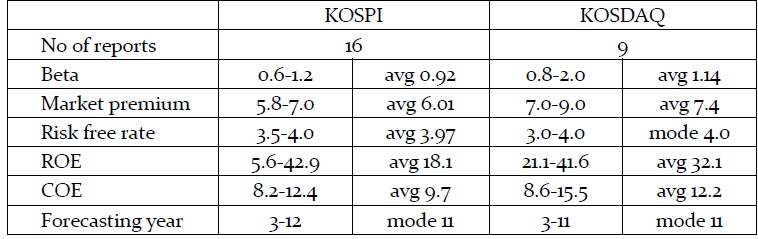
Table 6 shows the decomposition of the residual income model used. Beta means a firms’ stock price fluctuation to the fluctuation of total market price. The range of beta was 0.6-1.2 in KOSPI and 0.8-2.0 in KOSDAQ, and the average on each market was 0.92 and 1.14. The volatility of the sample reports in KOSPI was lower than the total KOSPI, and in KOSDAQ it was higher than average. The average market premium was 6% in KOSPI and 7.4 in KOSDAQ. Meanwhile, the risk free rate was estimated as 4% in both markets. But return on equity (ROE) and cost of equity (COE) were quite different in both markets: as for ROE, the average was 18.1 in KOSPI and 32.1 in KOSDAQ, and as for COE, the average was 9.7 in KOSPI and 12.2 in KOSDAQ. In our sample, ROE and COE of KOSDAQ firms are generally higher than those of KOSPI firms.
[Table 6] Decomposition of RIM model

Decomposition of RIM model
Forecasting years for earnings were 3-12 years in KOSPI and 3-11 years in KOSDAQ. The mode of forecasting years was 11 years, but there were extreme cases of 3 or 5 years. Generally, the longer the forecasting years, the smaller terminal value after forecasting years. On the other hand, if the years are short, there may be large terminal value. Therefore, the assumption on the profitable period may give big impact to valuation amounts (Penman and Sougiannis, 1998).
V. Analysis of Forecasting Accuracy
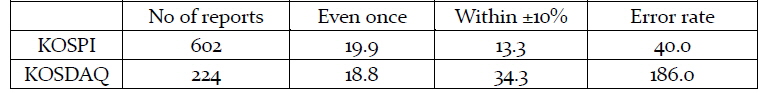
We set 3 definitions for accuracy of forecasting. The 1st definition is whether actual price arrives at target price. As shown in Table 7, the first definition of accuracy was 19.9% in KOSPI and 18.8% in KOSDAQ. In the first definition, there is no big difference, but there are big gaps between two markets in the other two definitions. The accuracy of the second definition, the “within 10%”difference between target and real price was 13.3% in KOSPI and 34.4% in KOSDAQ. The third definition of error rate,(target price – 1-month average of actual price) / 1-month actual average price*100, was 40% in KOSPI and 186% in KOSDAQ. The 40% of error rate means that the real price catches 60% of forecasting price, and the 186% error rate means that forecasting price is about 3 times ((286-100)/100) the average of one month real price at the end of forecasting period.
[Table 7] Comparison of accuracy of forecasting (%)

Comparison of accuracy of forecasting (%)
Figure 8 shows the distribution of error rate. That of KOSPI is similar to normal distribution, but that of KOSDAQ is greatly distributed. The error rate for KOSPI reports is composed of underestimation (12.1%) and overestimation (87.9%), while that for KOSDAQ reports is underestimation (9.4%) and overestimation (90.6%). The confidence level of the difference test between KOSPI and KOSDAQ was 0.000. So the distributions of the error rate are perfectly different. Generally overestimation prevails, but the level of overestimation in KOSPI was lower than that of KOSDAQ.
The low rate of accuracy is mainly due to the difficulties of the forecasting of KOSDAQ firms. Nonetheless, we cannot deny that the mutual adjustment effect between reports may exist in KOSPI, because many reports are issued for a company.
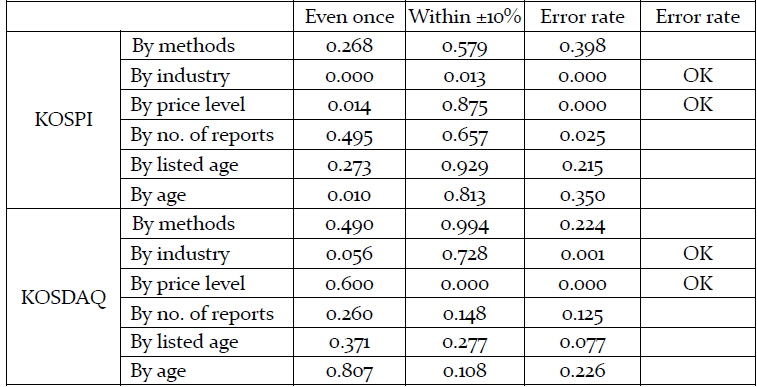
Many accuracy tests are done to produce table 8, so we will show only important results. As defined earlier, we accept each hypothesis if at least two of the three definitions are satisfied. The summary of table is as follows:
There are group differences on stock price forecasting only by industry and price level in both stock markets. There is no difference by valuation methods in both stock markets. There is no difference by listed age or established age in both stock markets. There is no difference by the number of reports per one company, even though KOSPI firms have many reports on each firm.
[Table 8] Accuracy test by groups

Accuracy test by groups
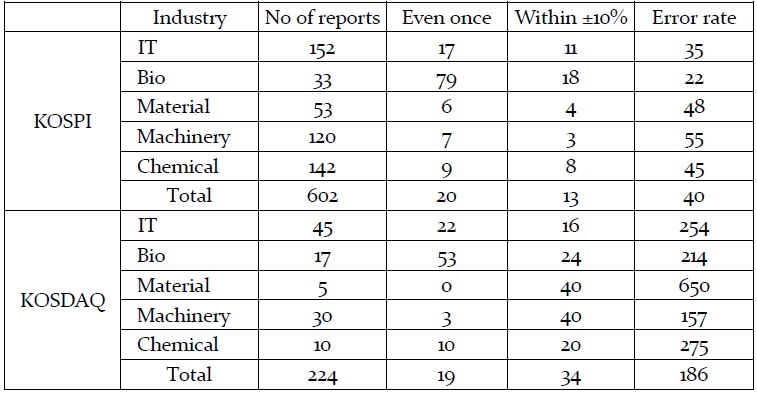
We already stated that H3 of former study was “the market approach was the most used and accurate”. However, the second fact rejected this hypothesis. H4 is that stock price forecasting of technology firms in KOSPI and KOSDAQ is less accurate in industries having more intangible assets such as IT and bio than the industry with more tangible assets such as machinery, materials and electronics. As shown in the note of Table 6, statistical significances exist in all the three definitions in KOSPI, but there is a statistical significance only in the error rate in KOSDAQ. However, as for the case of KOSPI, the accuracy of IT or bio industry was not lower than other industries. The accuracy of bio industry is the most accurate in the case of “even once” and “within 10%”, and error rate was the lowest. There were differences by groups, but accuracy definitions were the complete opposite; therefore H4 was rejected.
As for the definition of “even once,” the accuracy of KOSPI and KOSDAQ was 20% and 19%, so there is little difference. In “within 10%” case, KOSDAQ has 34% of higher accuracy than 13% of KOSPI, and “error rate,” which shows better accuracy was 50% in KOSPI and 186% in KOSDAQ. In conclusion, although error rate shows that accuracy in KOSPI is clearly higher than that in KOSDAQ, accuracy differs from the definitions of accuracy.
[Table 9] Accuracy test by industry (%)

Accuracy test by industry (%)
H5 is that the younger a company or the younger a company is in listing (H6), the lower accuracy is in stock price forecasting. But there is no evidence that supports these hypotheses in both markets. There is no relation between age or listed age and the accuracy of stock forecasting. Therefore, both hypotheses are rejected.
H7 is that higher the price of technology firms, the more accuracy there is in the forecast of stock price. We need to set the different price ranges of stocks suitable for KOSPI and KODAQ firms because of the price difference. We set five price ranges for KOSPI: fewer than 20,000 Won, 20,000-50,000 Won, 50,000-100,000 Won, 100,000-200,000 Won and more than 200,000 Won. On the other hand, we set six stages for KOSDAQ: fewer than 10,000 Won, 10,000-15,000 Won, 15,000-20,000 Won, 20,000-30,000 Won, 30,000-50,000 Won, and more than 50,000 Won. These groupings are set considering the number of reports in each group.
Among the accuracy tests by price level for KOSDAQ under the 3 definitions, “within 10%” and “error rate” are statistically acceptable. So, the hypothesis was accepted. As shown in table 10 for KOSPI reports, the statistical confidence level is acceptable in case of “even once” and “error rate”. But, there is no trend in the error rate that shows higher the price means lower the accuracy. In summary, price level has no relationship with forecasting accuracy in KOSPI.
[Table 10] Accuracy by price level (KOSPI, %)
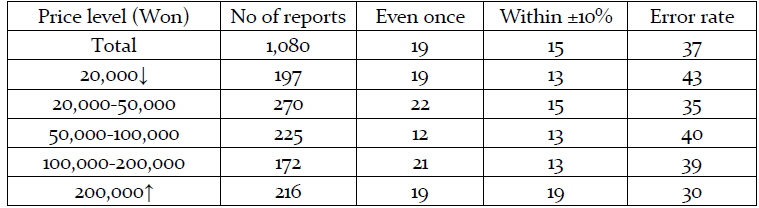
Accuracy by price level (KOSPI, %)
The purpose of this study is to compare the valuation of technology firms in KOSPI and KOSDAQ. Specifically, we compare the two markets with statistics and under 3 definitions on the accuracy of stock price forecasting.
Findings following the hypotheses of Cho and Seol (2014), which may be the common characteristics of stock market, are as follows:
H1 Market approach that performs relative valuation is the most popular method in stock market, even for technology firms. - accept H2 Stock market, even for technology firms, lays the greatest emphasis on net income for valuation among all other indicators. - accept H3 Multiples method is the most accurate method for valuing technology firms in stock market. - reject H4 Stock price forecasting is less accurate in the industry having more intangible assets such as IT and bio than the industry with more of tangible assets such as machinery, materials and electronics. - reject H5 The younger a company, the lower accuracy in stock price forecasting. - reject H6 The younger a company in listed age, the lower accuracy in stock price forecasting. - reject H7 The higher the price of technology firms, the more accuracy in forecast of stock price. - accept in KOSDAQ, reject in KOSPI.
Another commonalities between the KOSDAQ and KOSPI are as follows:
Earnings forecasting is mostly 2-3 years. Even for technology firms, generally overestimation prevails.
The differences between the KOSDAQ and KOSPI are as follows:
Although PER multiples is the most used method of valuation, KOSDAQ valuation heavily relies on the method than KOSPI valuation. Multiples of KOSDAQ is generally higher than those of KOSPI. Even for technology firms, valuation in KOSPI mostly relies on earnings of the company, but that in KOSDAQ mostly relies on relative price. Forecasting of KOSPI reports is more accurate than that of KOSDAQ reports. ROE and COE of KOSDAQ firms are generally higher than those of KOSPI firms.
This study has a few implications for previous studies with respect to theory and practice. One is against Gleason et al. (2008) who argue that sophisticated models like the residual income method are superior to the multiples method. In addition, Kang, Yoo, and Moon (2012) suggested that multiples based on book value or operating cash flow are superior to net profit, operating profit, and sales, but our result differs from them. Furthermore, Oh and Kim (2011) pointed out that PER multiples overestimate more than PBR multiples. Also, our result differs with them.
On the contrary, our finding is similar to that of Kim, Eom and Seok (2011) that finds no difference in accuracy of forecasting between high-tech firms and low-tech firms. It is similar to the result of Saito (2012) that NASDAQ firms a little while after listing are valued mainly by profit and that all the S&P 500 firms are by profit.
This study gives some implications to the practical field of valuation. The market approaches such as PER multiples, PBR multiples, and EBITDA multiples are used more than 90% both in KOSPI and KOSDAQ. Therefore, we need to elaborate the market approach to improve the accuracy of forecasting and to obtain a more exact value.
The results of this study embarrass the technology side who think technological power is prior to other factors. However, it would be better to say that the stock market clearly wants profit, and there is no need to discern technological side and capital side before listing on stock market.
This study has a limit that our data is only from the firm reports published in 2012. It means the other result can be derived if data are extended in time series. However the data extension is not simple because data has already been derived by analyzing several thousands of reports as well as accumulative data from various stock market databases.
This study uses three accuracy indicators of forecasting, and adopts and modifies the indicators of existing studies. These indicators will be a research topic to enhance the exact measuring.
Cho and Seol (2014) studied the valuation of technology firms in KOSDAQ, and this study compares the valuation of technology firms in KOSPI and KOSDAQ. In similar ways, further studies are suggested for the firms in the IPO preparation stage and for the new entrants for IPO. That will help the understanding of market valuation of technology firms.