Economists assert that innovation is one of the driving forces for employment creation and economic development. Schumpeter (1912) claims that firms’ can increase business profits dramatically by creative destruction following various innovative activities such as procurement of new materials, production of new products, findings of new markets, and adoption of new organizing methods. Furthermore, he insists these innovative activities become not only the driving forces for economic development, but also important factors for business fluctuations. Baumol (2001) finds that innovation has a positive effect on employment creation and economic development. The future growth opportunities and profitability of the innovative firms are higher than the non-innovative ones, and their excessive stock return is higher than the non-innovative ones too.
R&D investments should be reflected into financial investors’ valuations and stock market prices. It is well known that R&D investments affect firm performance, expected profits, and cash flows. Since in efficient financial markets investors evaluate a firm based on its expected cash flows (i.e., firm’s market value should be equal to the present value of all the expected cash flows produced in the future), R&D investments should also be reflected in market values. Moreover, stock prices should embed all the information currently available on the firm’s R&D investments and should react to any new information arrival about those investments. For these reasons, a number of researchers have turned to stock market value as an indicator of the firm's expected economic results from investing in R&D. Indian IT industries, is one of the large software services export industry with an exceedingly fast growth rate. Software services remain the dominant output, accounting for more than 90% of the industry’s sales revenue, rather than packaged software products. Beyond the impact of R&D expenditure on a firm’s market value, it has a significant influence on the firm’s financial performance. The impact on performance of this sector sometimes varies with the policy choices, business strategy, degree of success of R&D investment, and speed of product commercialization or process implementation. Given that the sector is highly R&D oriented both in terms of product and process related R&D, embodied and disembodied technology imports, it is important to see the relationship of R&D, stock returns and market concentration for this sector. The literature in linking these three issues are limited, hence gives us an opportunity to carefully analyze these factors.
Related to the discussion above, the research question of this study is to find out the relationship between R&D structure and investors’ valuation in the IT sector of the Indian economy. Four hypotheses are constructed for the empirical investigation. These hypotheses are related to the stock excess returns of firms that is a positive function of (1) labour intensity (proxy for the human capital), (2) firm’s product market share, (3) firm’s average age and (4) higher for firms that diversify into different product categories (within the same industry) than those who do not diversify.
Lack of previous studies pertaining to the role of financing constraints in explaining R&D investment in the context of an emerging economy such as India is the primary motivation for the present study. The reminder of this paper is as follows. Section 2 of this study describes the review of literature; section 3 presents the variable descriptions and method of estimation; section 4 presents the estimated results and test the hypotheses and section 5 concludes.
Research and development plays a critical role in today’s global knowledge-based economy. The emergence of information technologies, especially software technology, has changed everything in the world of business. It has, especially, affected how products are developed, marketed, and distributed. So, gaining a competitive advantage over competitors is the necessary precondition to survive in today’s competitive global market. R&D is becoming a major strategic weapon in the global marketplace to survive in time-based competition. Therefore, it is assumed that firm’s R&D spending may be positively related to firm’s financial performance. Once a firm spends on R&D to develop a new process or product/service, it receives a higher return if the innovation can be marketed on a larger scale. R&D capabilities are considered to be important, particularly in high technology industries such as the information technology (IT) industry.
Hirschey et al. (2001) examined the effects of innovation on the firm value in various aspects using the Tobin-q theory. The q theory states that Tobin’s q is equal to 1 under the assumption of efficient capital markets, because the long-run equilibrium market value of the bundle of the assets comprising a firm is equal to the book value of those assets. Wolfe (1994) states that innovation has an important role in the competitiveness and efficiency of a firm. Gopalakrishnan and Damanpour (1997) assert the most basic form of firm innovation is technological innovation, and innovation performance is achieved by higher R&D expenditure. The capital market imperfections are found to affect the investment decisions of a firm (Hubbard, 1998). These imperfections arise due to the asymmetric information and agency problems between managers and investors (Stiglitz and Weiss, 1981). The net result is the difficulties in obtaining funds for investment in physical and intangible assets, especially in the case of financially constrained firms. In fact, the effect of financial constraints is more pronounced in the case of investments in R&D.
Investigative activities that a business chooses to conduct with the intention of making a discovery can either lead to the development of new products or procedures, or to improvement of existing products or procedures. Research and development (R&D) is one of the means by which business can experience future growth by developing new products or processes to improve and expand their operations. Innovation is one of the major engines of growth and the most important way of gaining competitive advantage over competitors in today’s new economic environment. The theoretical models emphasize the importance of R&D in the form of spillover effects. A related issue with regard to R&D is the financing aspect of such activities. The investment in R&D is riddled with information problems and lack of collateral value due to the uncertainty involved in R&D activities (Hubbard, 1998). Therefore, frictions are likely to arise in the case of obtaining funding for R&D. Stiglitz (1989) cites that informational problems are severe in the case of developing countries since the markets in these countries lack the capability to process and evaluate information. Thus the financing constraints faced by the large number of firms to support their research programs are likely to hamper the economic growth in the case of an emerging economy like India. The role of financial development in promoting economic growth is well recognized. A likely channel through which the linkage may arise is through financing of R&D (Brown et al., 2012). However, the channel through which the former influence the later has not received much empirical attention. The recent growth theorizing has put to the forefront the role of R&D in promoting growth (Aghion and Howitt, 1992).
Numerous studies have attempted to analyze the factors determining R&D investment. Among the factors taken into account, financial factors have been highlighted as the crucial drivers of R&D (Singh and Faircloth, 2005; Bond et al., 2006). The intangible nature of R&D investment makes it more prone to financing constraints. A vast majority of the literature on firms’ financing constraints focuses on the link between cash flow and capital investment. Ross et al. (1993) report that approximately 80 percent of all R&D financing is carried out with internal funds. Existing studies have tried to empirically analyze the financial constraints by testing the sensitivity of the R&D with the financial factors (Hottenrott and Peters, 2012).
A widely accepted method is used in finance to compute the current value of an asset based on statistical inputs for cash flow expectations. Its main purpose is to uncover investment opportunities that will keep the internal profitability rate above a firm’s cost of capital well into the future. R&D is a key factor of innovation and has become an integral part of many firms, especially those in the high-tech industries. Research is generally defined as the primary search for scientific and technical improvement whereas, development is defined as the translation of such improvements into product/service or process innovation and technology imports complement or substitute in house R&D efforts. R&D intensive firms compete on the basis of a new innovation that allows them to retain their existing customers and capture new markets with a substantial amount of growth in sales and earnings. Although many studies found that there is a link between R&D expenditure and firm value, this relationship changes over time and differs greatly from industry to industry and firm to firm. In most cases, however, financial benefits become apparent only when the specific R&D activities lead to patent issuance.
According to the resource-based view of Dutta et al. (1999); marketing, R&D, and operations capabilities along with the interactions among these capabilities are important determinants of financial performance. Chan et al. (1990) argued that R&D investment is crucial for firms to stay competitive, especially among the high-tech industries. In practice, R&D is a part of a firm’s innovation activities. Firms decide on the amount of R&D investment considering their resource constraints. The decision of the intensity of R&D investment is based upon the expected future returns. Investment in R&D is considered to be an investment in intangible assets that contribute to the long-term growth of the firm. However, the accounting treatment of R&D expenditure has a direct impact on a firm’s financial performance. If R&D costs are expensed in the period they were incurred, it decreases the net income as well as the profitability ratios (ROA and ROE) for that period. However, if R&D costs are deferred to future periods as intangible assets, it would not decrease the current period’s net income and profitability ratio i.e. ROE, but it might decrease another profitability ratio i.e. ROA. Since total assets will be increased by capitalization of the R&D expenditure as an intangible asset, a successful investment in R&D results in an innovative product or service, which enables a firm to be differentiated from others. This means that financial benefits will become apparent only when specific R&D activities lead to patent issuance.
A firm’s long-term economic performance is measured by Tobin’s q. It is defined as the ratio of the market value of a firm to the replacement cost of its assets and commonly used to measure a firm’s value, management performance, and the mispricing of stocks. It is a good measure of firm performance, which may include a variety of subjective characteristics. Tobin’s q represents a long-run equilibrium measure capturing both risk and return dimensions (Petri and Elgar, 2004). It reflects the market expectations of less quantifiable dimensions of performance, which reflects the portion of the firm’s intangible assets besides its total tangible assets. If the market value reflected solely the recorded assets of a firm, Tobin’s q would be equal to 1. If Tobin’s q is greater than 1, then the market value is greater than the value of the firm’s recorded assets. This suggests that the market value reflects some unmeasured or unrecorded assets of the firm. On the other hand, if Tobin’s q is less than 1, the market value is less than the recorded value of the assets of the firm, which suggests that the market may be undervaluing the firm. Investors greet R&D announcement positively, even when a firm reports operating losses in the period in which the R&D announcement was made. But positive responses might be restricted to firms in the high-tech sector. The study shows that shareholders are not short-term focused; instead, they like long-term investments. They believe that a firm gains intrinsic value by investing in R&D, which extends the opportunity for future growth potential.
R&D expenditure has a direct impact on profitability based on various circumstances. The impact may come from either the accounting choices to capitalize or expense the R&D expenditure, a firm’s strategy to gain market share or profit, the frequency of R&D activities leading to patent issuance, or the speed and ability to commercialize the innovations into the products that capture consumer needs and preferences. However, studies show both a positive and negative relationship between R&D intensity and profitability measures. Chen et al. (2005) found a significant positive relationship among R&D intensity and both of the profitability measures ROA and ROE. The results suggest that R&D investment is important for the firm’s future profitability and revenue growth. Lau (1998) found evidence that the difference of ROA between high and low R&D intensity firms is marginally significant, though not as strong as growth in revenue. Based on his observation, he concludes that high R&D intensity firms do not produce a significantly higher ROA than their counterparts. Kotabe et al. (2002) found a non-significant negative relationship between ROA and R&D intensity.
Ho et al. (2005) found a strong, positive and significant relationship between firm size and market-to-book value ratio. They also found a significant negative relationship between a firm size and R&D intensity. This result suggest that bigger firms have a relatively higher market value than do smaller firms, but smaller firms are more innovative if their R&D intensity is higher than that of bigger firms. Kotabe et al. (2002) found a strong positive significant relationship between firm size and ROA. This finding indicates that bigger firms are more profitable and able to manage their assets to earn profit. However, Lin et al. (2006) found a negative and significant relationship between firm size and Tobin’s q. This result suggests that bigger firms have lower growth potential than that of smaller, innovative firms. Quo et al. (2004) found that firm size has a consistent positive impact on productivity, but no significant influence on profitability. The positive influence of firm size on productivity is due to the fact that large firms achieved economies of scale in specialization and put more input into the adoption of management tools. Firm size has a significant influence on R&D expenditure and a firm’s performance.
Many studies have found both a positive and negative relationship among R&D intensity, firm size, and performance measures. Reviewing these studies, it is assumed that the future profitability, growth opportunities, and excessive stock return of the innovative firms are higher than the non-innovative ones. This paper will focus on the statistical evidence of R&D spending on a firm’s financial performance. It also examines the effects of other firm characteristics. R&D activities may also influence firm’s revenue growth, short-term profitability, and long-term economic performance.
III. Data Sources and Variable Definitions
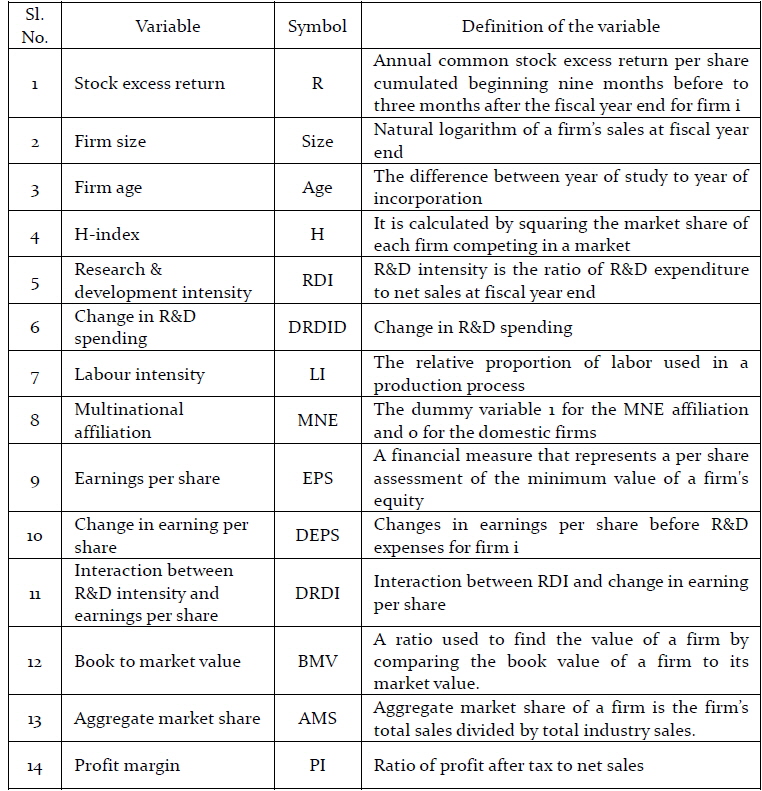
A sizable literature exists on the effect of firm size on market valuation. In general, large firms have smaller earnings response coefficients than small firms. In the R&D context Holthausen et al. (1995) argued that centralization is necessary for large firms to control employee managers, and that a more centralized firm tends to inhibit innovation due to its more bureaucratic control mechanisms. The data for the empirical analysis is derived from the Center for Monitoring Indian Economy (CMIE), Prowess database for the sample of firms in the IT industry of Indian economy. We have collected data from 1999 to 2013. The list of variables with definitions, are presented in table 1.
[Table 1] Definition of the variables

Definition of the variables
To the extent that firm size proxies for centralization, firm size could show a negative correlation with the market valuation of R&D spending. However, firm size is also related to the availability of financial resources. If the availability of financial resources can facilitate innovation efficiency, firm size will be positively correlated with the market valuation of R&D. Since the size effect on the market valuation of R&D investment is ambiguous but the effect of size in firm valuation is well documented, firm size only is used as a control variable in the study. In addition to firm size, we also adopted multinational affiliation of firms as another control variable.
To evaluate the identified hypotheses, we use the returns model presented by Easton and Zmijewski (1989). This model depicts returns as a function of earnings and the change in earnings. The basic empirical returns model estimated can be presented as follows:
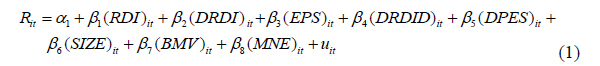
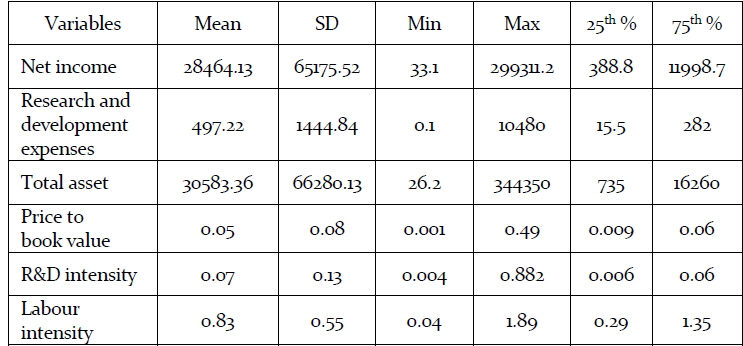
Variables except the Rit and SIZE are scaled by the market value at the beginning of the year. Table 2 presents descriptive statistics of the variables that we use in our analysis. The average research and development intensity and price to book value, are quite low around 0.07 and 0.05 respectively. However, the mean labour intensity (proxy for human capital) is calculated to be 0.83 with maximum of 1.889 and minimum of 0.04. The standard deviation of net income of the sample firms are found to be higher. Similar results are obtained for the research and development expenses of the sample firms. Therefore, firms in the sample are heterogeneous in nature based on the indicators selected and presented in table2. The results of table 2 are across year and cross-sections. This leads us to understand the variables in context from 1999-2013.
[Table 2] Summary statistics of the sample firms from 1999-2013

Summary statistics of the sample firms from 1999-2013
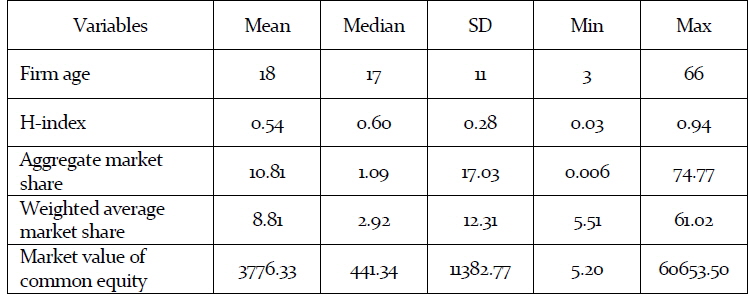
Table 3 presents the sample statistics of product market structure variables. Mean firm age is calculated to be 18 years with standard deviation of 11 years. The average H-index is 0.54 with standard deviation of 0.28. To measure the product market share, we use two different measures (1) aggregate market share and (2) weighted average market share across different product categories. Aggregate market share of a firm is the sum of the firm’s annual revenue from all product categories divided by the total market revenue. The weighted average market share is the weighted average of the market shares in different product categories, where the weight is the percentage of revenue generated from each category. The aggregate market share represents the overall market share of the firm; whereas the weighted average market share gives greater weight to the firm’s specialized area(s). The smaller the firm’s market share, the more competition the firm is operating under. The average market share is around 10 percent with highest market share of a firm of 74 percent. However, the mean weighted market share of the sample is found at 8.81 percent with a maximum of 61 percent.
[Table 3] Sample statistics of product market structure variables from 1999-2013
Sample statistics of product market structure variables from 1999-2013
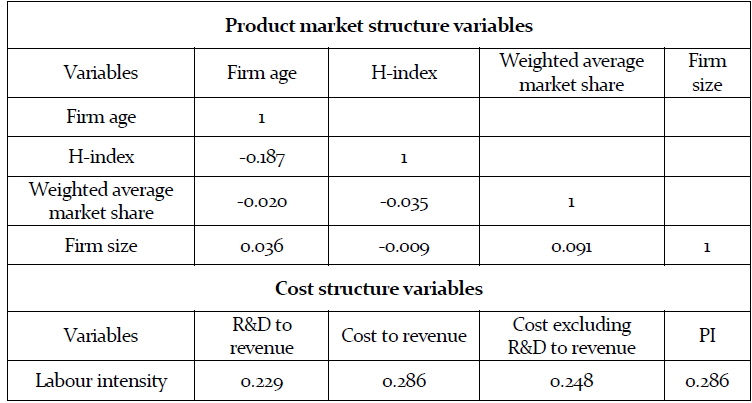
From table 4, we can observe among the product market variables, the H-index is negatively correlated to firm age, weighted average of market share and firm size. The weighted average of market share is negative correlated to both firm age and H-index but positively related to firm size. Firm age is negatively related to h-index and weighted average of market size but positively related to firms size. Firm size is positively correlated to firm age and weighted average of market share but negatively related to H-index. In case of the cost structure variables, labour is positively related to all the cost structure related variables such as R&D to revenue, cost to revenue, cost excluding R&D to revenue, and profit margin.
[Table 4] Results of Spearman rank correlation structure variables

Results of Spearman rank correlation structure variables
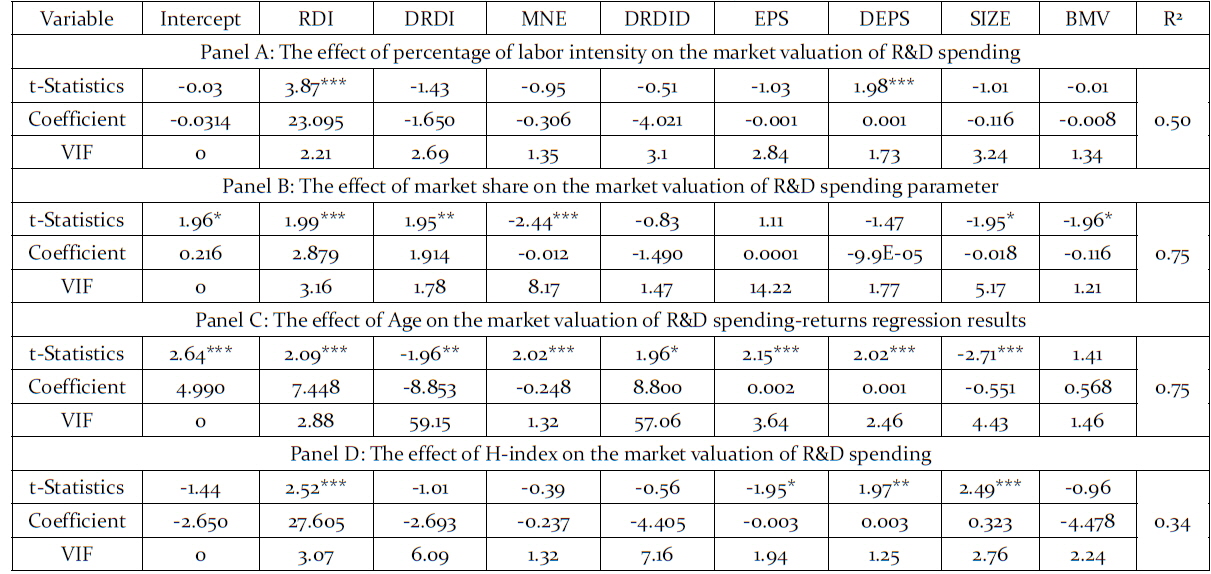
Table 5 presents the empirical estimates of the study. The table is divided into four panel based on the hypothesis. Panel-A of table 5, presents the results of evaluating the first hypothesis of the study. The first hypothesis assumes that R&D spending is more valuable for firms which exhibit higher future R&D productivity as measured by the proportion of R&D expenses to net sales (RDI). Using the median (28 percent) as the dividing point between high and low, the dummy variable (DRDI) is not itself significant, but change in earnings per share (DEPS) is. The dummy variable is not statistically significant, suggesting that having higher percentage of R&D intensity does not add firm value, but it influences how R&D increment is valued by the investors through earning per share. In sum, the regression analyses support the first hypothesis. Once we see the detail result of Panel-A of table 5, we can observe that, stock excess return is positively related to R&D intensity and change in earnings per share for the firms that are classified based on the firms that are labour intensive.

Results of the regressions to evaluate the effect of R&D variables on valuation of software firms (with robust standard errors)
Because the market structure information used in this study is compiled for the IT firms’ performance, the regression results reported here are weighted by percentage of sales derived from total sales. However, to ensure a minimum representation, a ten percent weight is imposed on firms that derive less than that proportion of sales from the markets. The results reported are not affected when the regressions are weighted by imposing a minimum of one percent weight, when three different weights are assigned to different levels, or when non-weighted regressions are run. Panel-B of table 5; shows the results on the market competition hypothesis. 47 observations having valid market share data and no missing values for other variables are used in the regression analysis. Firms with aggregate market share of less than the median of 0.095% (24 observations) are compared to firms with aggregate market share of more than 0.095% (23 observations).
The result clearly indicates that R&D intensity, interaction of R&D intensity and change in earning per share, Multinational affiliation and book to market value are significantly related to the stock excess returns of firms. However, R&D intensity and interaction of R&D intensity with change in earnings per share are positively related whereas book to market value is negatively related. The domestic firms are better off in stock excess returns compared to the multinational affiliated firms in the sample. The coefficient on the interaction term is 2.00 which is significant at the better than 10% level. This result suggests that R&D spending is valued approximately 2.00 percent more in annual return for firms which have larger market share. Interestingly, the coefficient on the change in R&D spending is not statistically significant, suggesting that incremental R&D spending does not add firm value. An increase in R&D spending is apparently viewed by investors as beneficial to a firm only if the firm has a large market share. The analysis using weighted average market share, although not reported, produces similar results.
Panel-C of table 5, reports the regression results of the life cycle hypothesis. This hypothesis predicts that the market valuation of R&D expenditure is a function of the age of the products and that the function is a bell-shaped curve that peaks at the middle part of its life cycle stage. As discussed earlier, the firm age stages are defined as introduction stage, growth/mature stage, and stagnant stage. 45 observations have valid measures of age and no missing values for the other variables; 10 are classified in the introduction stage; 15 in the growth/mature stage; 20 in the stagnant stage. The purpose of the regression is to examine the extent to which being in the middle part of product life cycle stage adds to the market value of R&D cost related to the IT industries in India. The empirical result shows that R&D investment adds about 7.44% more in annual return for firms whose average firm age reaches the middle (between 24 months and 36 months) than for firms whose average firm age is still in the introduction stage (less than 24 months) or has already past the mature stage (more than 36 months). Again, the coefficient on change in R&D spending is positive and statistically significant; suggesting that increase in R&D spending is valued positively unless the product has reached the middle part of its life. A further look into the table depicts that stock excess return is related to firm characteristics except book to market value. The result also clearly state that in this care of the life cycle hypothesis, multinational affiliated firms have higher stock excess compared to the domestic firms.
Panel-D of table 5, reports the results for the diversification hypothesis. The hypothesis predicts that R&D spending is more valuable for a diversified firm than not diversified firm. 67 observations have no missing value for any variables and are used in the regression estimate; 46 firms are diversified (Herfindahl <1.0), while 21 firms are not diversified (Herfindahl = 1.0). The coefficient on the R&D intensity is significant, which suggests that R&D expenditure contributes more to the annual stock returns for diversified IT firms than for their non-diversified peers. The coefficient on the R&D increment is not significant-implying that the increase in R&D spending only adds firm value for diversified firms. Further, stock excess return is positively related to change in earnings per share and negatively related to earnings per share. In this case size of firm is positively related to the stock excess returns. Hence, diversified, bigger and R&S intensive firms have higher stock excess returns compared to the others.
This paper empirically investigates the impact of R&D expenditure along with firm characteristics such as labor intensity, market share, firm age and H-index on the market performance of the IT firms in India. Our result extends the understanding of the role of firm size in R&D intensity and a firm’s financial performance. Looking at the results across panels from A to D of table 4, stock excess return is still value relevant in the IT industry. That is, investors do not simply regard more R&D spending as value-increasing activity unless the firm is either more productive, has larger market share, provides diversified product offerings, or is in the middle stage of the product life cycle. We found that smaller firms invest more on R&D and are more productive in innovation than large firms. Smaller, innovative firms have higher growth potentials and their market value is relatively higher. One reason might be that the Government of India has been pursuing several support policies for smaller firms. This study is limited to only a sample of firms in the IT sectors from 1999-2013 from the CMIE Prowess database and because of choice of variables, the final sample was further reduced. Given the small and non-random sample, the results may not be generalized to other industries, or even to the entire IT industry. Nevertheless, the results of this study indicate the need to pay attention to possible non-financial product information in delineating future accounting policy for intangible assets.