Multi-view display is the most widely used autostereoscopic 3D display method. It separates the view images spatially with the optical devices and provides binocular disparities to observers [1-19]. A multi-view display system is usually implemented with 2D display systems such as flat panel displays or projectors, and takes advantages of their high lateral resolution [1-4]. An optical structure such as a lenticular or a parallax barrier is used to control the light rays, so the observer watches different view images at different positions. Multi-view displays can be categorized into two groups according to the base 2D display: projection-type multi-view displays and panel-type multi-view displays. A projection-type multi-view display is based on 2D projectors and a screen. In projection-type multi-view display, multiple projectors are often spatially multiplexed for higher data capacity. A panel-type multi-view display is composed of a 2D display panel and an optical structure, so it takes a small volume, but it is hard to achieve both high resolution 3D images and a large number of views due to the limited number of pixels [1-4]. Since both types of multi-view display system are composed of several complete optical elements, the calibration between the elements is an important factor for the quality of the reconstructed 3D image.
The calibration of a projection-type multi-view display has been studied intensively, because the system is often implemented with multiple projectors [11-19]. Multiple projectors have their own mechanical calibrators inside, so one can calibrate them with the optical movement and with the image compensation method. Furthermore, the automatic calibration methods for multiple projectors have been presented [20-23]. On the other hand, the calibration method of a panel-type multi-view display has not been studied as much as that of the projection-type. Basically it is a calibration just between two devices: a flat panel display and an optical structure, and a slight misalignment causes changes of viewing characteristics rather than a significant degradation of 3D image quality [5, 6, 24-26]. Especially for the panel-type multi-view display with a large number of views, the pitch of the optical structure is much bigger than the pixel pitch, so small changes in pixel scale are not a big problem to the whole system [5-7]. There have been several previous approaches to compensate the misalignment in panel-type multi-view display systems, but they focused on the image processing method rather than the actual optical calibration [24-26].
However, the accurate alignment is becoming important not only for the projection-type but also for the panel-type multi-view display. In recent high-resolution multi-view displays, the pitch of the optical structure is similar to the pixel pitch [9, 10]. Furthermore in slanted lenticular display, the alignment of slant angle is crucial, otherwise the views are scrambled [8-10]. To build a personal multi-view display with the individual display panel, it is essential to have a standard calibration method [9]. Some calibration methods were introduced in previous studies such as using a white/black image as an alignment pattern [24-26] or using a view image of numbers as an alignment pattern [27, 28]. However, to the best of our knowledge, there have been no studies on a panel-type multi-view display which analyze the sensitivity of the various alignment patterns, verify the alignment patterns, and present the whole calibration process, until now.
In this paper, we propose a novel calibration method which can be applied to all kinds of panel-type multi-view display. Firstly, we analyze how the misalignment in panel-type multi-view display affects the 3D image quality. We categorize the alignment between the panel and the optical structure into three parts: angular, axial, and lateral alignment. We demonstrate the ray optics simulation for the quantitative calculation. Based on the analysis, we propose a new alignment pattern for all the types of the panel-type multi-view display. We theoretically show the generality of the proposed alignment pattern and verify the pattern with image simulations. Furthermore we also implement a slanted parallax barrier system to show the validity of the proposed calibration method.
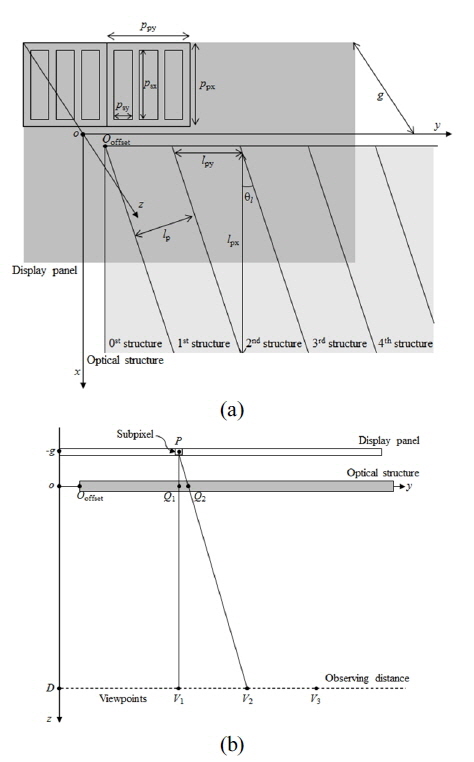
A panel-type multi-view display is one of the methodologies to construct 3D display systems, and it does not indicate a specific structure. Various types of display panel and various types of optical structure can be utilized as the elements of the panel-type multi-view display system. Nevertheless, a panel-type multi-view display system can be generally interpreted with the periodic structures such as pixels and optical structures (lenses or barriers) as shown in Fig. 1, and starting from this microstructure level, a general analysis on the alignment issue can be derived.
Figure 1 shows the schematic diagram of a panel-type multi-view display system. A display panel located at
An optical structure is located at the

Suppose that this optical structure is ideally designed, so that the view images can be clearly separated at the viewpoint
In the ideal case, the perfectly calibrated situation, the following equations are satisfied:


and

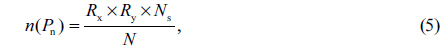
where
For instance, suppose that a subpixel

where
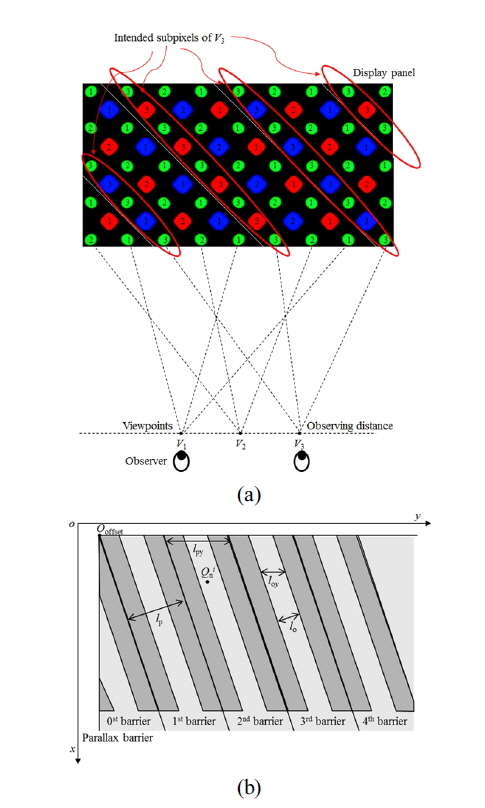
The ray tracing simulation is presented to calculate the changes of the number of the intended subpixels with the angular, the axial, and the lateral misalignment. A 3-view slanted parallax barrier with a pentile display system is assumed, which was implemented in our previous work [10]. This system verifies that our analysis is valid not only for an RGB stripe structure but also for a pentile structure, and the simulation results can be verified with the implemented system easily. A parallax barrier system is adopted because of the simplicity of calculation, but the generality is still preserved because all calculations are on and off: whether the subpixel is observed or not at the certain viewpoint. If a subpixel is an intended subpixel of a viewpoint with a parallax barrier system, then it is also an intended sub-pixel of the same viewpoint with a lenticular system with the same pitch, the same focal length, and the same slant angle.
Figure 2 is the diagram for the 3-view slanted parallax barrier system with a pentile display. In Fig. 2(a), the numbers on the subpixels indicate which view they belong to. The intended subpixels of a certain view are along the optical structure borders, because the relative position between the subpixel and the optical structure concludes the direction of the refracted light rays. The detailed specifications of the system are listed in Table 1. For the system,
[TABLE 1.] The specifications of the 3-view slanted parallax barrier system with a pentile display
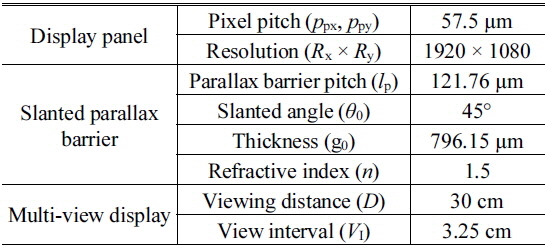
The specifications of the 3-view slanted parallax barrier system with a pentile display
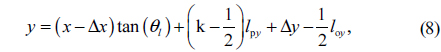
The simulation process is straightforward. First, draw a line from a certain viewpoint
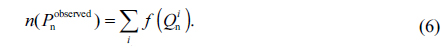
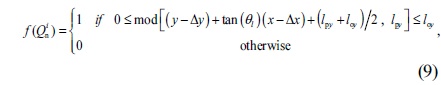
The function can be calculated from the relative position of and the parallax barrier. Since the barrier structure is repeated with

where

where mod function means the modulo operation which returns the remainder after division.
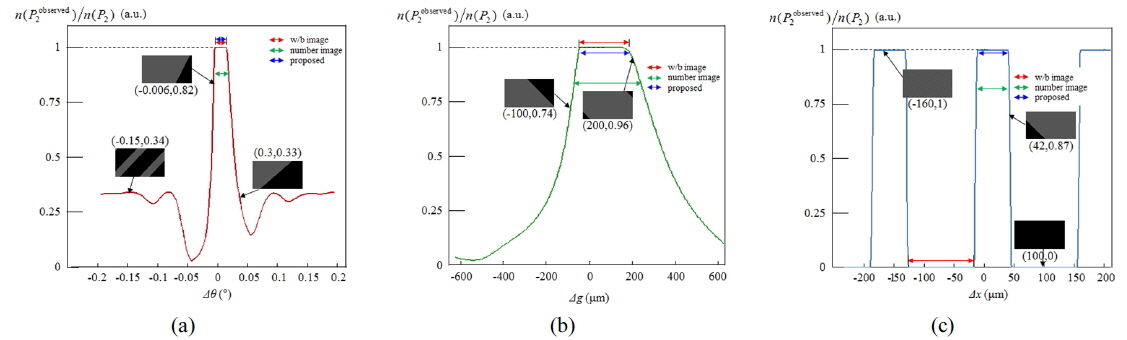
Figure 3 shows the simulation results of the total number of the observed intended subpixels of
At first, Fig. 3(a) shows that the angular alignment is the most important for the panel-type multi-view display system. The system works perfectly in a very narrow range of angular misalignment, 0.019°, and the intended view image is totally scrambled when |Δθ| becomes about 0.05°. Even though it can be said that the exact values depend on the specifications of the individual systems, the scale shows that the angular alignment is relatively sensitive. The reason why the angular alignment is the most important for the multi-view display system is that the angular misalignment influences view image creation. To form a viewpoint, the light rays from all of the intended subpixels should converge at a point. The angular misalignment does not allow to form a viewpoint, while the axial and lateral misalignment shift the viewpoint.
Secondly, Fig. 3(b) shows the influence of the axial misalignment. The system provides the intended view images completely when −43 µm <
Finally, the view image shift caused by lateral misalignment is shown in Fig. 3(c). The lateral misalignment affects the image quality very sensitively. The toggles between
From the simulations, it is derived that the lateral and the axial calibrations are less important than the angular calibration. However, it is still important to calibrate the system perfectly for the image reconstruction as designed. In this section, we compare the existing calibration patterns with the simulation, and propose a new pattern for the panel-type multi-view display system.
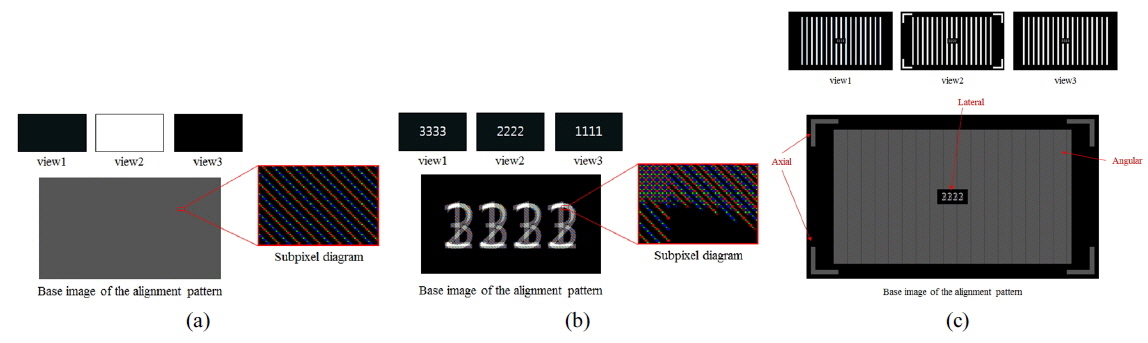
The most widely used alignment patterns for the panel-type multi-view display are the white/black (w/b) image and the image of numbers. Figure 4(a) shows the w/b alignment pattern for a 3-view slanted multi-view system (see Table 1). One view image is the white image and the others are the black images. At a certain viewpoint the white image is shown clearly, while it is not at other viewpoints. The alignment pattern with the image of numbers is shown in Fig. 4(b), where the different number images are shown at the different viewpoints.
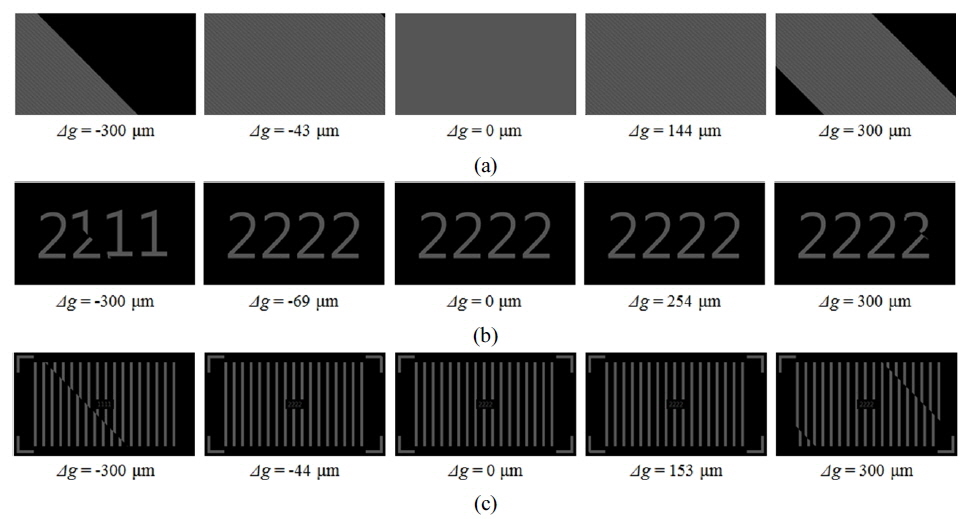
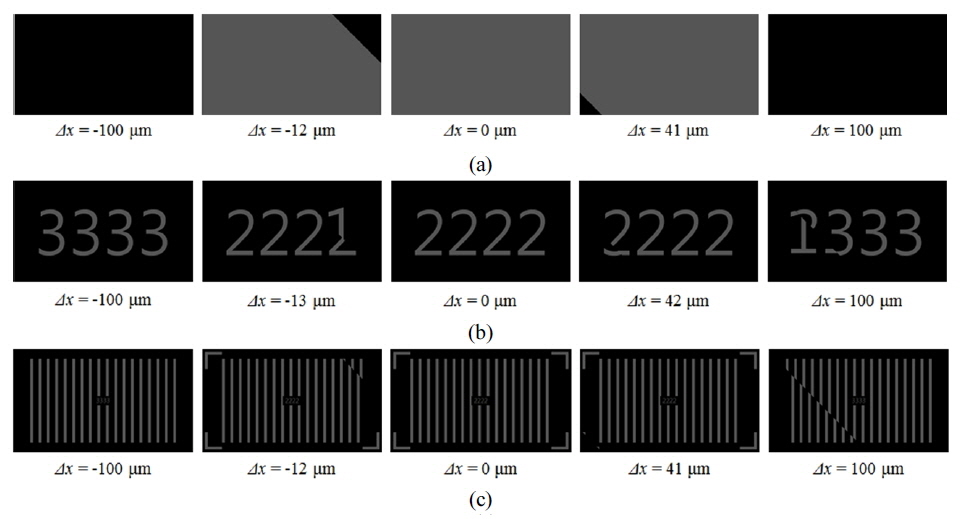
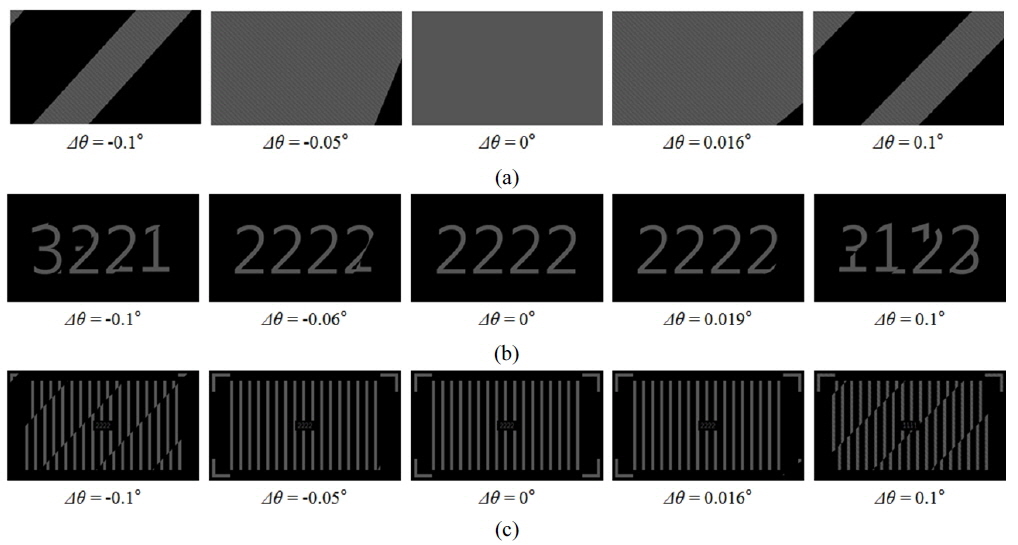
Figures 5-7 show the view images of alignment patterns at a viewpoint
The simulation results show that conventional w/b image is sensitive enough to all types of misalignment. However, there are some limitations with the conventional w/b images’ alignment pattern. At first, w/b image is not a proper option for the lateral alignment. The w/b image is as sensitive as image of numbers on the lateral misalignment of one view (
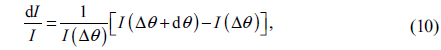
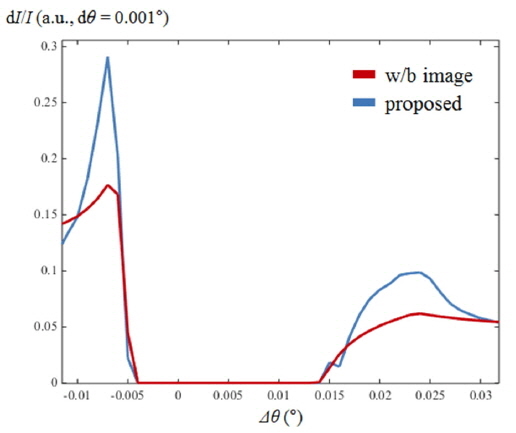
Secondly, the w/b image is less sensitive to the angular calibration than the proposed pattern. Since we sweep the angle during the angular calibration, the sensitivity of the calibration is decided by the image intensity differences between the nearby misalignment. For example, if the misalignment Δ

where d
Figure 8 shows the simulation results of d
Thirdly, it is hard to recognize the difference between the perfectly aligned case and the misaligned case with the w/b image. The ideal view image (center) and the first distorted view image as the misalignment increases (center left/right) shown in Figs. 5(a), 6(a), and 7(a) are hard to distinguish because the pattern changes gradually and the nearby white pixels disturb the observer’s recognition in the practical case. For comfortable calibration, it is better to use the on and off calibration pattern, so the observer can judge whether the system is well-aligned or misaligned.
Lastly, it is hard to figure out which type of alignment is in trouble with the w/b image or the image of numbers. As shown in Figs. 5(a), 5(b), 6(a), 6(b), 7(a), and 7(b), the resultant images all look similar, so the observer cannot judge the types of misalignment only from the distorted view image. This problem gets severe when the three types of misalignment exist together. The view image is scrambled and the observer feels difficulty to find the reason of the image degradation.
From that point of view, we propose a new calibration pattern for the panel-type multi-view display system. First, the proposed pattern covers all types of misalignment. It is sensitive to all of the axial, the angular, and the lateral misalignment, so the system is valid when the pattern is wellaligned. Secondly, the proposed pattern is filled with complicated images with the high spatial frequency, so the observer can easily recognize the difference between the aligned case and the misaligned case. For the axial alignment, we use the on and off alignment pattern to help the observer. Finally, the proposed pattern consists of the axial, the angular, and the lateral part, so the observer can find which alignment is in trouble. This enables the observer to calibrate the system in series: the angular first, then the axial, and finally the lateral alignment, and the observer feels more comfortable with the calibration procedure.
Figure 4(c) shows our proposed alignment pattern. The pattern is composed of three different parts for the three different types of alignment. The center region is the image of numbers as shown in Fig. 4(c). Since the resultant of the lateral misalignment only toggles between
The proposed method can be applied to any type of panel-type multi-view display system: repeated white line images in all view images, small number patches in all view images, and 4 white marks at the corners in one view image. The line images, number images, and marks are generated with the MATLAB (MathWorks Inc., R2012a) easily [29].
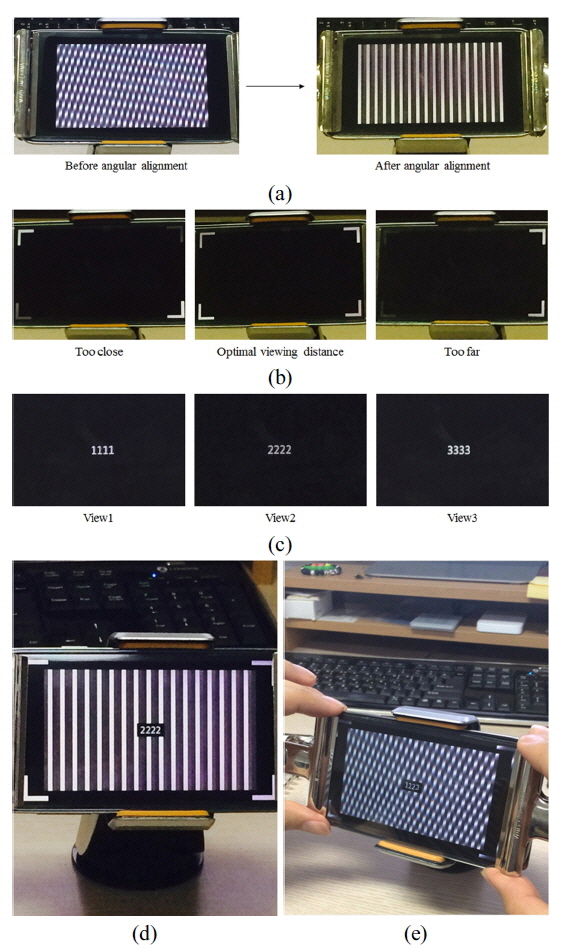
We verify the proposed alignment pattern with an experiment. The 3-view slanted parallax barrier system is implemented for the experiment [10]. Detailed specifications are identical to the system in previous simulations, as listed in Table 1. Figure 9 shows the experimental results of the calibration with the proposed alignment pattern. Since the proposed pattern is composed of three regions for the three types of alignment, we verify them separately. Figure 9(a) shows the angular alignment with the proposed white line images. Since the lines are repeated with the high spatial frequency, the observer can distinguish the angularly misaligned case more easily than the w/b image. After angular alignment, the lines are shown clearly in Fig. 9(a).
For the axial alignment, we verify the proposed method by changing the viewing distance rather than the gap between the panel and the parallax barrier. Since the gap mismatch in the parallax barrier system corresponds to the change of the viewing distance, we can verify the axial alignment more gradually with the variation of the viewing distance. Figure 9(b) shows the experimental results of the axial alignment with the proposed axial alignment patterns. At the optimal viewing distance the 4 mark images are shown clearly, while only 2 or 3 mark images are observed if the viewing distance is too close or too far. The close and the far situations correspond to the larger and the smaller gaps, respectively. Finally, the lateral alignment with the image of numbers at the center works well as shown in Fig. 9(c).
After the calibration process, the resultant view image
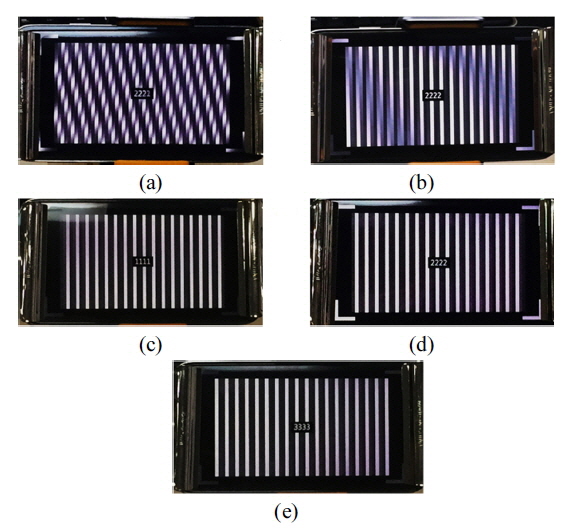
We performed the whole calibration experiment with the proposed calibration pattern. We utilized the same 3-view slanted parallax barrier system. Figure 10(a) is the observed image before calibration. It is easy to verify that this system is not aligned angularly, axially, and laterally. The lines are not clear as well as the 4 marks at the corner. The numbers at the center are not shown clearly.
Figure 10(b) is the observed image after angular alignment. As shown in the Fig. 10(b), the 4 mark images are not shown clearly so that the system is not axially aligned. Although the system is axially misaligned, the center region shows clear line patterns as expected. This clear line image guarantees this system is angularly calibrated at least. One can proceed with axial calibration maintaining angular alignment by preserving these clear line images.
Figures 10(c), (d), and (e) are observed images at each viewpoint after angular and axial calibration. One can laterally calibrate this system by comparing these viewpoints and actual viewpoints. The experimental results correspond to the simulation results shown in Figs. 5(c), 6(c), and 7(c) as expected.
The proposed alignment pattern assumes that the optical structure is perfectly manufactured. In practice, there must be errors and the optical structure is not uniform. However the proposed alignment pattern is still valid with the local non-uniformities, because some fluctuations cannot change the number of observed intended subpixels significantly. If the error is big enough to change the viewpoints or viewing distance, other correction methods should accompany [30-32]. In that case, the proposed alignment pattern is compatible with other correction methods.
In this paper, we proposed a novel calibration method which can be applied to all types of panel-type multi-view displays. We analyzed how the misalignment in panel-type multi-view displays affects the 3D image quality, and categorized the alignment between the panel and the optical structure into the angular, the axial, and the lateral alignment. We demonstrated the ray optics simulation for the quantitative calculation. Based on the analysis, we proposed a new alignment pattern for all types of panel-type multi-view displays. The proposed pattern covers all types of the misalignment. It is sensitive to all of the axial, the angular, and the lateral misalignments. Especially for the angular calibration, the relative image intensity difference is higher with the proposed alignment pattern, which can help more accurate calibration. The proposed pattern also helps observers to calibrate the system easily with the high spatial frequency images and on and off calibration methods. We theoretically showed the generality of the proposed alignment pattern and verified the pattern with the image simulations. Furthermore we also implemented a slanted parallax barrier system to show the validity of the proposed calibration method. This proposed method can be applied to any type of the panel-type multi-view display system, and it would be applied to the 3D display industry as well as the research field.