The hemispheres of the human brain have been very well distinguished in scientific research. The right hemisphere functions in visuospatial and constructional tasks, while the left hemisphere functions in calculation and arithmetic tasks [1]. Brain studies have shown that both males and females activate the left hemisphere of their brain for left-hemispheric centric tasks. However, for right-hemispheric tasks, males laterally activate both the right and left hemispheres of the brain, while females do not show the same lateralization [2]. Galaburda (1990) reasoned that females may be better at working within the constraints of a single hemisphere during a unilateral hemisphere task [3]. A more recent study using fMRI has challenged this idea of gender-specific lateralization. The results presented by Nielsen et al. (2013) showed that lateralization may be a trait specifically attributed to the individual rather than to gender [4]. As it can be seen, the recent enhancements in brain monitoring technologies have allowed for researchers to question what is really known about brain lateralization. Approaching questions such as gender-based lateralization with a different brain imaging modality adds a new perspective that will help resolve these conflicting studies.
It is important to explore techniques for enhanced measurement of brain lateralization not only to compare genders, but because brain lateralization is a sign of a well-functioning brain. A study has found that the observation of impaired lateralization, especially in the left hemisphere of young children, may be an early sign of autism [5]. In addition, hemisphere utilization can measure an individual’s attention level, cognitive control, or indicate cases of attention-deficit disorder [6]. fMRI is often used in brain lateralization studies [7-10]. However, this system is difficult to self-administer and not practical for a localized setting (in terms of setup and cost) [11]. If wide scale neurocognitive studies are to be pursued, there must be the development of a more convenient and portable brain monitoring system.
A review paper by Irani et al. (2007) illustrates how functional near infrared spectroscopy (fNIRS) has been translated from researchers to clinicians in neurocognitive studies [12]. fNIRS is a noninvasive optical spectroscopy/imaging technique propagating near infrared light, between 650 nm - 950 nm, (within safe levels of optical radiation) into the tissue in order to observe absorption by the dominant near-infrared absorbing matter (oxyhemoglobin (OHb) and deoxyhemoglobin (RHb)) [11]. The depth penetration of fNIRS is limited to a maximum depth of approximately 2 to 3 cm from the source, depending on detector and light source distance [11]. Benefits include fNIRS’s ability to provide blood oxygenation changes in real-time, portability, and its inexpensiveness to construct and administer as compared to fMRI [11, 13]. For the purpose of this study, the prefrontal cortex presented the best location to take fNIRS measurements because it is free of hair, accessible, and has a crucial role in cognitive tasks [14].
The implementation of fNIRS for neurocognitive studies have grown tremendously in recent years, as researchers have utilized its convenience to measure cerebral hemodynamic changes during cognitive tasks. Specifically, there have been many insightful observations regarding lateralization or brain activity for specific tasks using fNIRS. These observations include: males being more leftward lateralized during resting state than females [15], bilateral activation in subjects during verbal fluency tasks [16], higher performance yet lower hemodynamic response for females during a mental arithmetic task [17], leftward lateralization by females in memory tasks [18], and rightward lateralization during music processing [19]. As it can be seen, numerous tasks have been developed to discern the differences between males and females.
The principle goal of this preliminary study is to (1) validate the use of an in-house built multichannel fNIRS system to be used for neurocognitive studies, (2) explore the use of common metrics (i.e. Pearson correlation coefficient and Lateralization Index) for quantifying lateralization, and (3) test the paradigm of having two cognitive tasks aimed at activating the left and right hemispheres as a way to observe the brain lateralization. The neurocognitive tasks consisting of a mathematical and verbal task were developed based on previous findings. A multichannel fNIRS probe was built primarily for this study and had channels that spanned across the subject’s forehead in order to measure brain lateralization from the prefrontal cortex. The preliminary results gathered here may serve as a guideline for improved studies regarding gender differences in brain lateralization.
2.1. Subjects
Eleven healthy right handed adults (seven male/four female) were recruited for this preliminary study, which had been reviewed and approved by Gwangju Institute of Science and Technology’s Institutional Review Board (IRB 20140319-HR-10-01-02). The handedness of the subjects is in line with similar brain lateralization studies [2, 15, 16]. The female subjects had a mean age of 25.8 ±1.9 years and the male subjects had a mean age of 30.4 ± 8 years. The subjects’ education spanned from one to five years of graduate level education. The subjects had no prior history of neurological illness and each subject was given a letter of consent before beginning the experiment. To properly manage the subjects’ stress levels, the subjects were split into two groups, mixed of male and female. The first group was tested at 4:00 PM and the second group tested at 9:00 PM. The experiments occurred on one day.
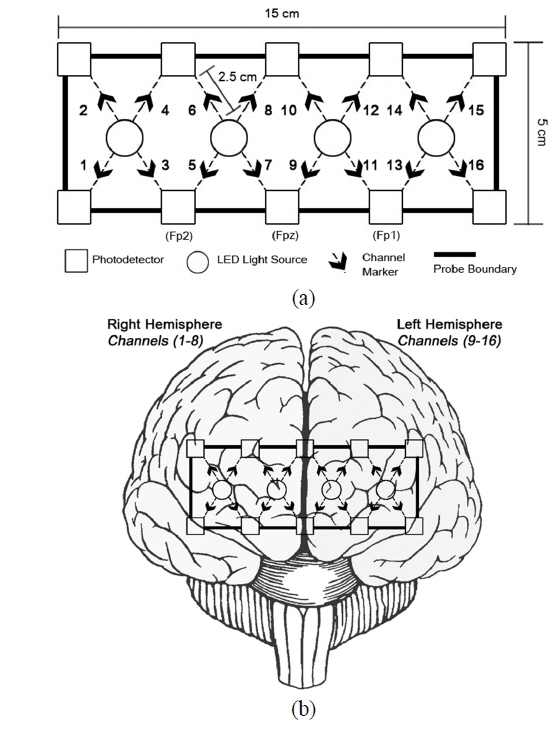
Each subject had little prior training on how to attach the fNIRS probe, but they were still able to attach the probe onto themselves with appropriate contact as validated by the experiment administrator. The experiment administrator assured that the probe’s bottom row of detectors was aligned according to the International 10-20 system’s Fp1-Fp2 line. This location has proved to be appropriate for neurocognitive studies and has been useful in studying cognitive development in young children. [20]. Careful consideration was taken by the administrator to ensure good contact between the probe and skin, and that the probe was clear of hair. The probe was inspected before and after the experiment to ensure that it did not shift position on the subject’s forehead during the experiment. It is also important to note the symmetrical channel pairings that were the basis for the calculations of brain lateralization in Table 1 and its approximate location of the brain as shown in Fig. 1.
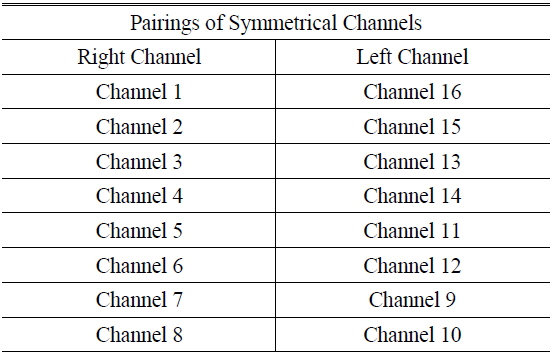
Pairings of symmetrical right and left channels on the fNIRS probe in order to perform brain lateralization analysis
2.2. fNIRS System and Data Acquisition
The schematic of the in-house built continuous wave (CW) fNIRS probe is shown in Fig. 1. CW type systems are based entirely on light intensity measurements and have been adapted widely in the field of neuroscience due to their low cost and simplicity [21]. The fNIRS probe consisted of 16 channels with a total length of 15 cm and a width of 5 cm, enough to span the entire forehead of all the subjects. The distance between the source and detector was 2.5 cm which allows for probing the outer cerebral cortex [22].
Ten monolithic photodiodes with a single-supply transimpedance amplifier served as a light detector (Texas Instruments Inc. OPT101). Four light emitting diodes (LED) (Epitex Inc. L735/850-40D32) illuminated the subject's forehead emitting wavelengths of 735 nm and 850 nm in sequence, giving the system a 1 Hz temporal resolution. The sequencing of the LEDs between the two wavelengths was controlled by an Arduino Micro microcontroller. The probe was built with a silicone base and constructed with a strap and buckle to allow for the subject to attach the probe to their forehead. The data acquisition and further post processing occurred with a custom built software using a Matlab R2010b (Mathworks Inc., MA, USA) interface. The real time data display, minimal circuit design via Arduino microcontroller, and convenient probe attachment show the potential for multichannel fNIRS to be beneficial in cognitive studies and bed-side monitoring.
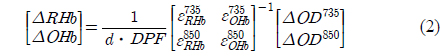
The calculation of relative changes of OHb and RHb has been fully developed previously [23, 24]. In short, once near infrared light propagates into the tissue, the attenuation is dominated by OHb and RHb chromophores. The relationship of changes of optical density (ΔOD) for wavelengths of 735 nm and 850 nm and the concentration changes of ΔOHb and ΔRHb can be stated as:
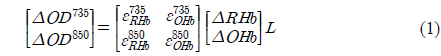
where ΔOD = ODTransient - ODBaseline. are the extinction coefficients of OHb and RHb at 735nm and 850 nm, and

The tasks were specifically designed to unilaterally activate the left and right hemispheres of the brain. In total, the experiment ran approximately 270 seconds with each task running for 30 seconds. Each task was proceeded by another 30 seconds baseline measurement. The subject was placed in a dark room with the task administrator and sat in their natural sitting position on a chair facing a computer. After being fitted with the probe and given instructions, the subject had to verbally perform two rounds of the pair of tasks. Once the experiment began, there was no communication between the subject and administrator.
The two tasks comprised: double digit subtraction (Task 1) and Latin reading and speaking (Task 2). Task 1 has been shown to target the functionality of the left hemisphere of the brain [1, 25]. Task 2 was designed to activate the right hemisphere of the brain. The subject had to speak aloud Latin text, without having any prior knowledge of the syntax, grammar, or pronunciation of Latin. The logic behind this task was as follows: whereas the left brain is concerned with logic and understanding, the right side of the brain is known to look at the big picture [26], and is said to be “blind to the meaning of words” [1]. Before the experiment began, the subject was instructed to use their best intuition and creativity to read the Latin as fluently as possible. There has been controversy regarding the right hemisphere’s ability to read. While studies have shown right hemispheric activation during reading tasks, some argue that reading is a task integrated in the function of both hemispheres [1]. Therefore, an additional goal of this study was to observe the effect of abstract reading based tasks as an activator of the brain’s right hemisphere.
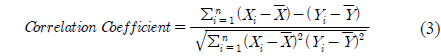
The Pearson correlation coefficient and Lateralization Index are metrics used to quantify brain lateralization in a subject [10, 16]. The same metrics were calculated in this study in order to observe the lateralization of the subjects. The equation of the Pearson correlation coefficient can be stated for two variables,

Lateralization Index (LI) has been defined for a frequency domain NIRS system as [16]:
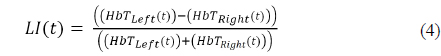
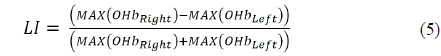
where HbT is total hemoglobin concentration, or the summation OHb and RHb. Since CW fNIRS systems are able to obtain only relative concentration changes [24, 27], the Lateralization Index equation must be modified. Instead of regarding total hemoglobin concentration with respect to time, the max concentration change of OHb for the stimulation epoch was compared. The modified equation can be restated as follows:

The equation above represents the calculation for OHb, but the same method was used for RHb. Note that the reversal of the right and left values in Equation 5 from the original equation [16] was arbitrary.
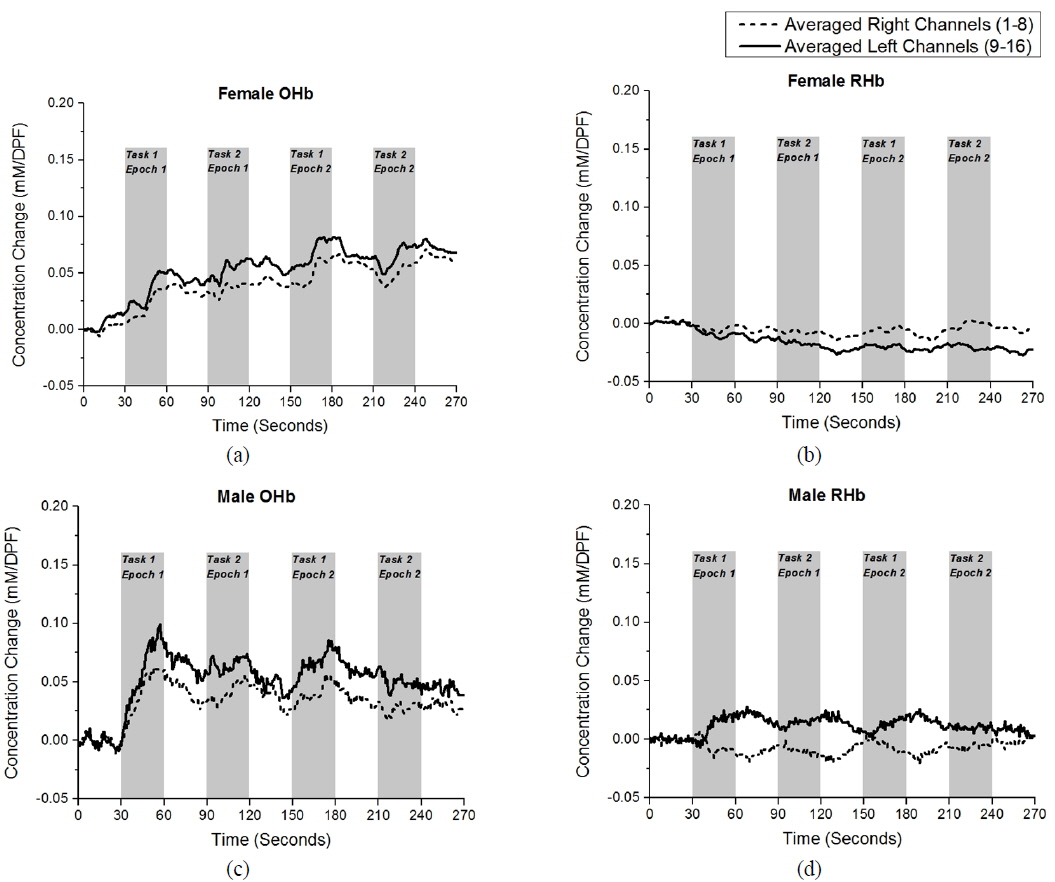
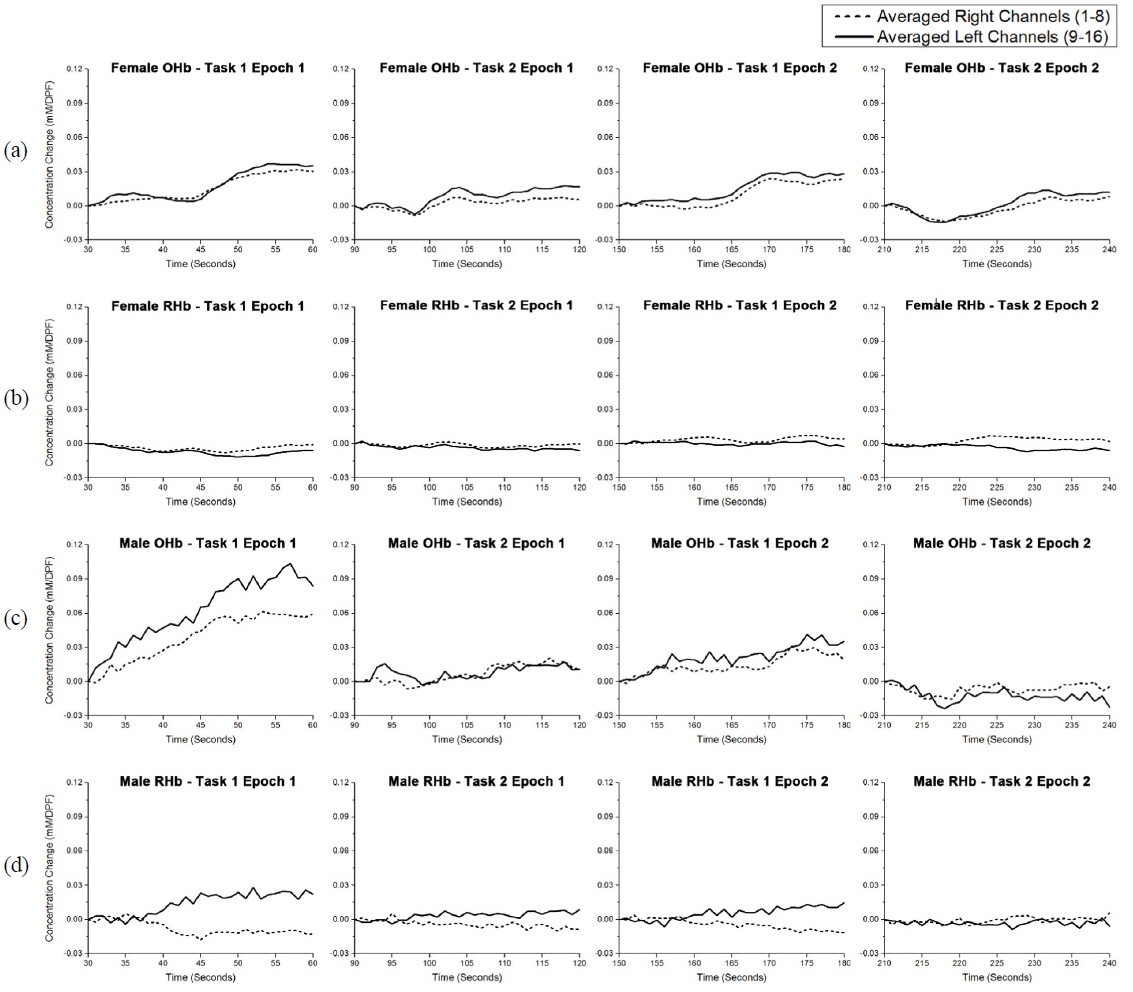
Figure 2 shows the average OHb and RHb concentration changes for the right (1-8) and left (9-16) channels for four females (Fig. 2(a),(b)) and seven males (Fig. 2(c),(d)). As the Fig. 2 clearly shows, the average of the left and right channels follow a similar pattern of changes throughout the experiment, with the left channels having a slightly higher concentration change. The genders show a difference in the general pattern of OHb changes throughout the entire experiment. The female subjects show a gradual, yet continuous increase of OHb concentration change, whereas the male subjects have a large initial change of OHb but have a steeper descent during the rest period between tasks.
In order to measure the subject’s performance during the tasks, regardless of the baseline effects between genders, the concentration changes for each subject were realigned at the beginning of each task period. The realignment was performed by subtracting each point from the first point of the task period. The realignment of the data allows for an objective comparison of performance metrics (i.e. maximum concentration change, correlation coefficient, and Lateralization Index) during the task period. All the proceeding calculations shown were done with the realigned concentration changes. Figure 3 displays the results of the realigned tasks for (a) female OHb, (b) female RHb, (c) male OHb and (d) male RHb. After realignment, it can be clearly seen that Task 1 (double digit subtraction) gave a higher OHb response in both genders compared to Task 2 (Latin reading and speaking). The higher hemodynamic response of Task 1 is in line with the previous finding that arithmetic tasks are able to bring about a much more distinguishable hemodynamic response than other tasks [28]. The results also indicate that abstract reading based tasks did not give a high enough hemodynamic response in order to conclude that it elicits right hemisphere activation.
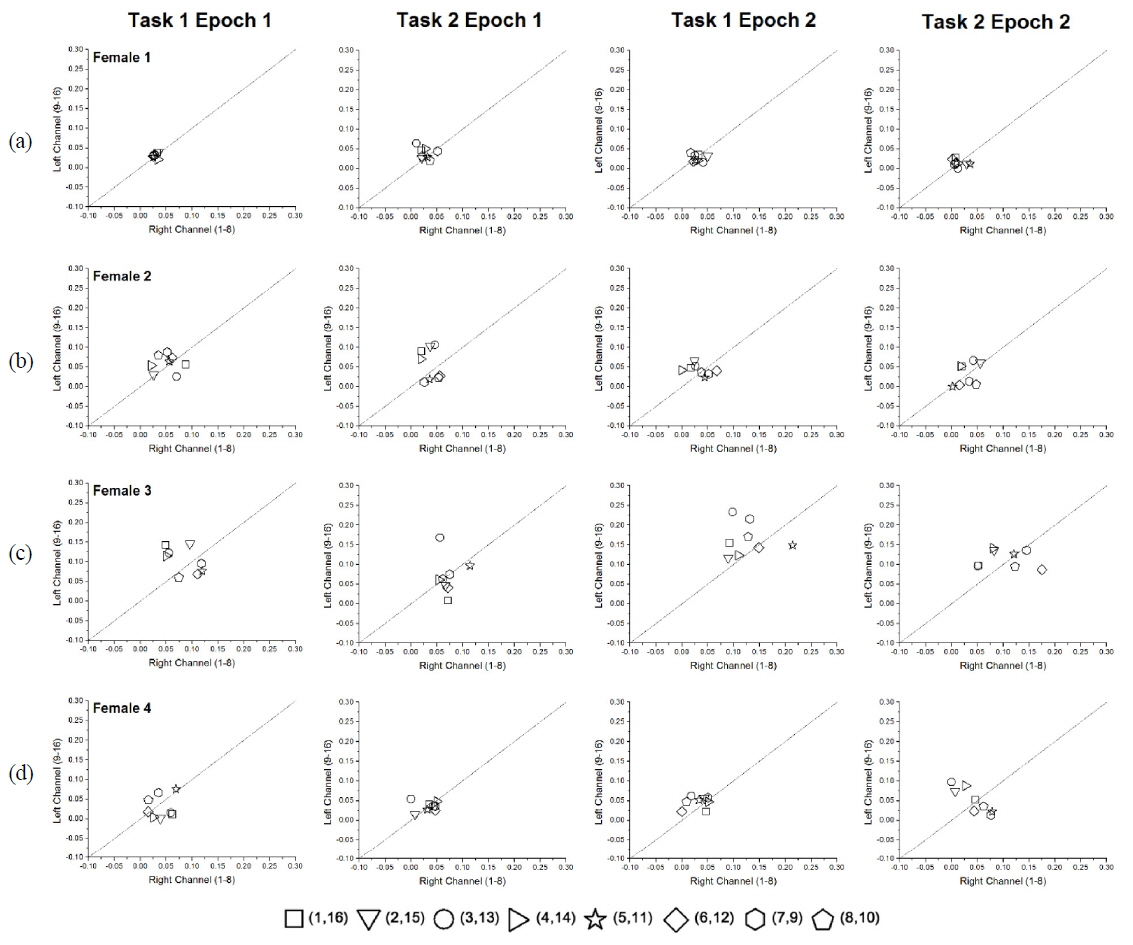
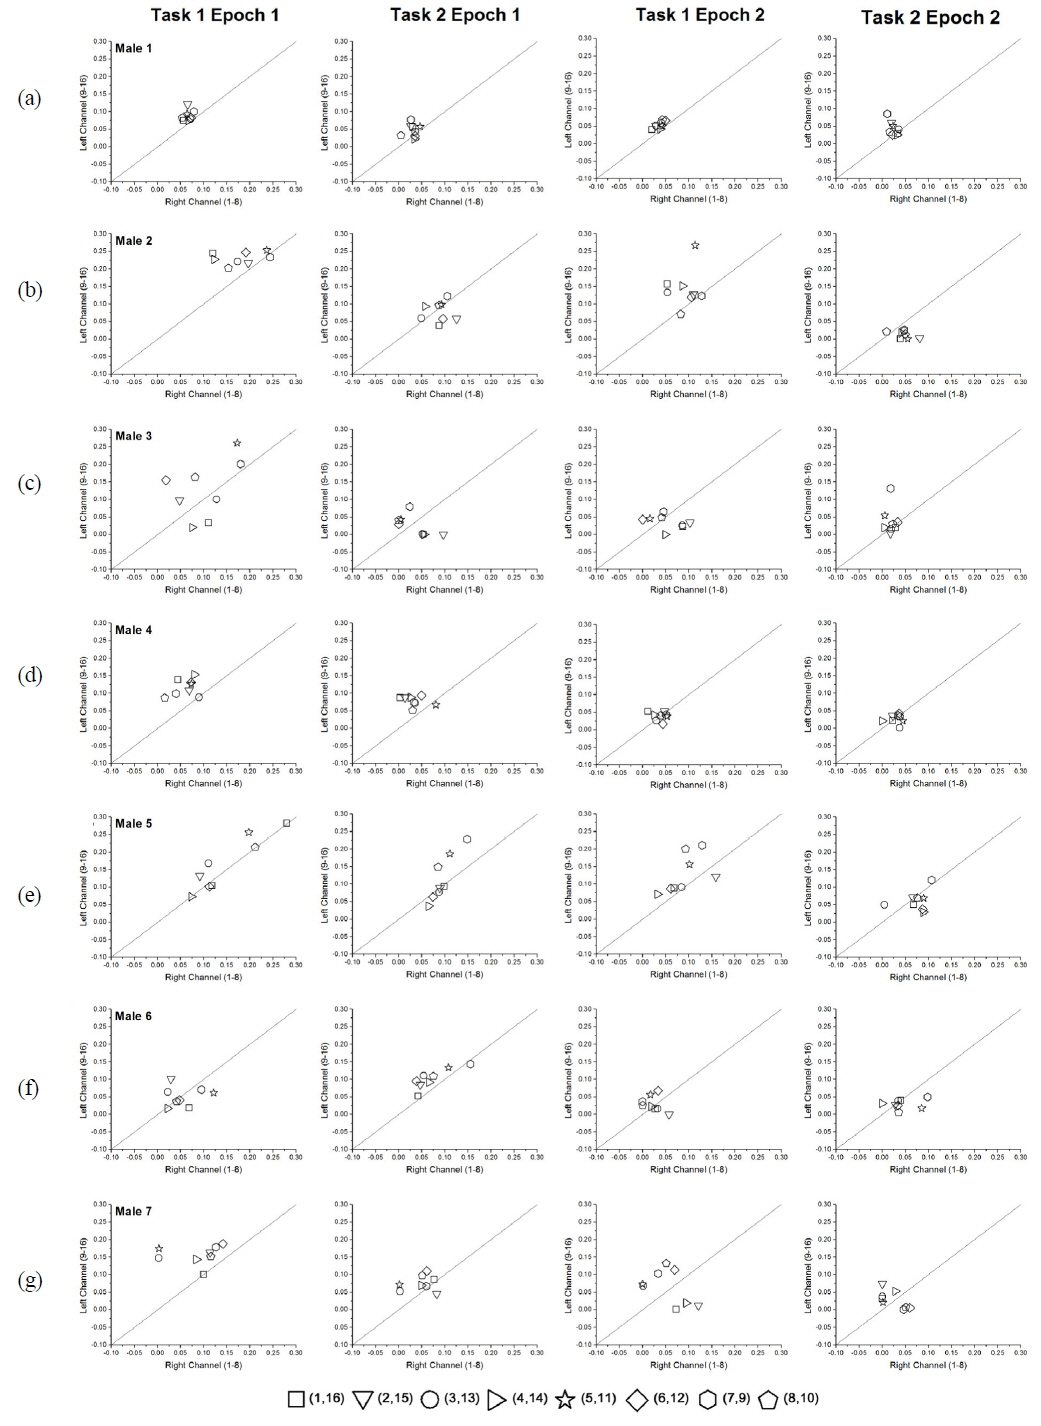
In order to test the hypothesis that lateralization is an attribute of the individual, rather than of gender, the individual performance of the eleven subjects was investigated. Figure 4 shows the maximum OHb concentration changes of the four female subjects between right (x-axis) and left channel (y-axis) pairings for each task. Figure 5 shows the same results for the seven male subjects. The diagonal line on the graph indicates symmetry in concentration changes between right and left channel pairs. In comparing Fig. 4 and Fig. 5, there is a lack of observable trends between genders and with more evidence of intragender variability. While most subjects’ results are grouped closer to the diagonal, there exist certain subjects who show high amplitude changes in the left channel for Task 1. Subject Female 3 (Fig. 4(c)) and Subject Male 5 (Fig. 5(e)) showed higher changes in the left channels over the right channels for Task 1 Epoch 2. Figure 4 and 5 provide some evidence of that lateralization may be a result of different factors other than gender.
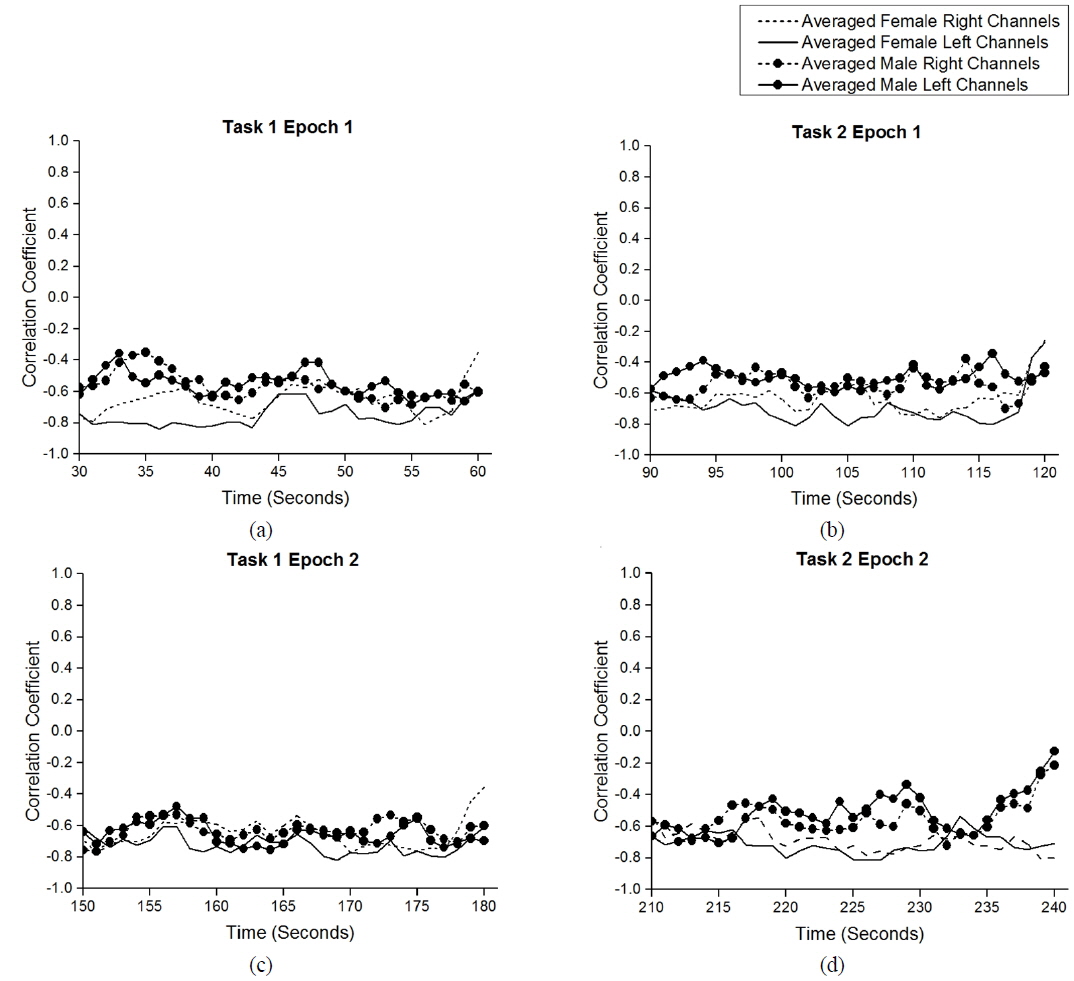
In order to ensure that the collected results were not influenced by external factors such as motion artifacts, a running Pearson correlation coefficient was calculated with a window size of 5 between each channel’s OHb and RHb concentration changes. It has been shown that OHb and RHb changes directly related to brain activity are negatively correlated [29]. It has also been shown that head motions can cause a positive correlation between OHb and RHb [29, 30]. Therefore, the correlation analysis of OHb and RHb is one way of identifying the presence of head motion artifacts. Figure 6 shows the results of the running Pearson correlation coefficient for each gender’s right and left channels. As the Figure shows, the correlation between OHb and RHb remained strongly negative for all the tasks. This indicates that even though the subjects were able to sit upright with an unrestrained head, any head motions did not strongly influence the subject’s data, a finding in line with previous work [31].
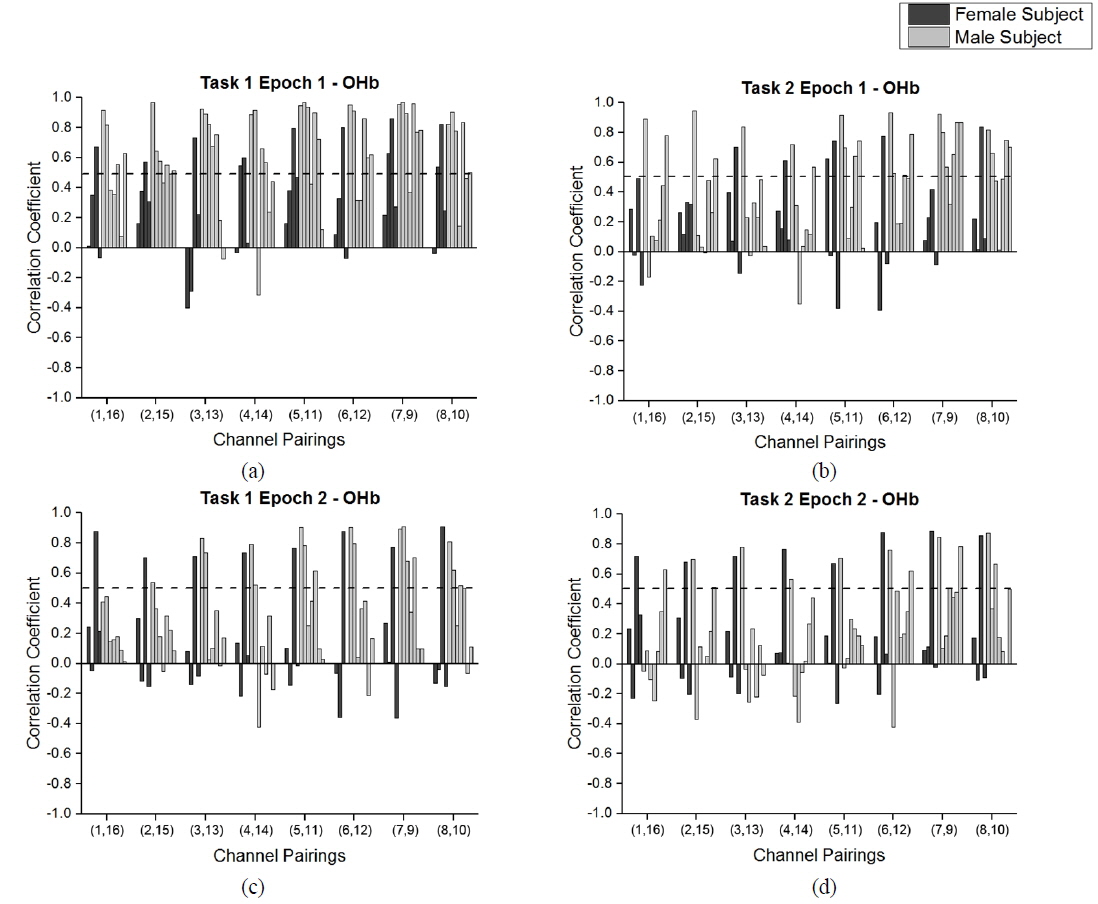
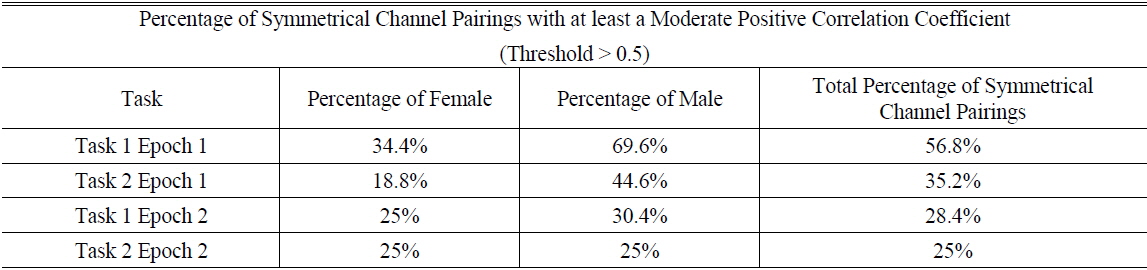
Figure 7 shows individual Pearson correlation coefficient for OHb changes of right and left channel pairings calculated for each task. As shown in Equation (3), the correlation coefficient measures how two variables deviate from their mean in order to describe the variables’ relationship. In a bilateral brain, it can be expected that symmetrical channels’ OHb changes would remain positively correlated and rise or fall in a similar fashion. For a majority of the subjects, the correlation of OHb concentration changes in symmetrical channel pairings remained strongly positive. However, as the experiment progressed, the correlation between channel pairings decreased. Table 2 shows the percentage of correlation coefficients for subject-channel pairing combinations that were greater than the threshold of a 0.5 correlation coefficient. A 0.5 correlation coefficient has been referred to as a moderate correlation coefficient and thus served as a threshold in order to observe the relationship between channel pairs [32]. The threshold is visually displayed as the dashed line in Fig. 7. In Task 1 Epoch 1, a little over half of the subjectchannel pairing combinations showed at least a moderate positive correlation. By the final task of the experiment, only 25% of the subject-channel pairing combinations showed a positive correlation greater than the moderate correlation coefficient of 0.5. As Table 2 shows, a majority of the decrease in correlation occurred within the male subjects.

Percentage of symmetrical channel pairings that showed a correlation coefficient greater than the threshold
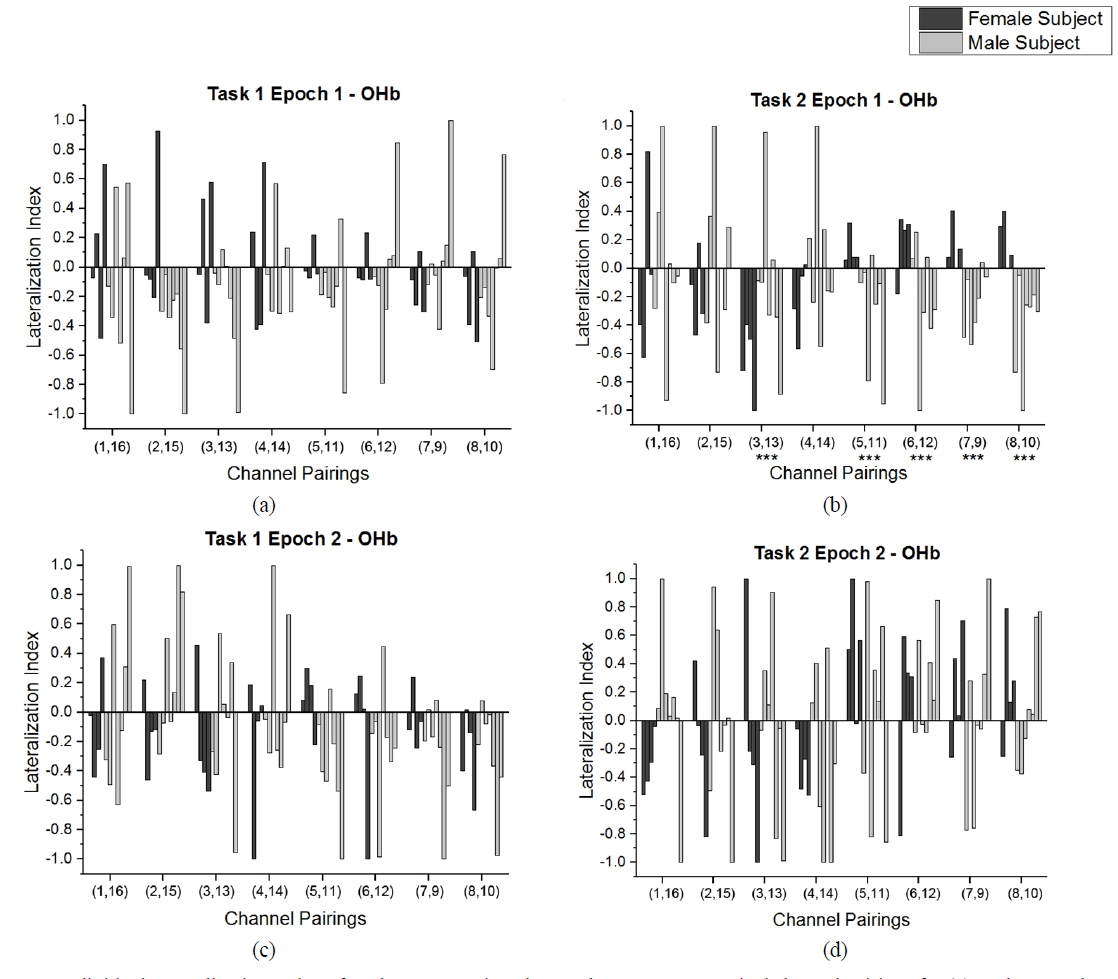
The modified Lateralization Index for CW NIRS systems (Equation 5) was used to calculate the OHb’s Lateralization Index for individual subjects and their channel pairings shown in Fig. 8. By interpreting the modified Lateralization Index equation, it can be seen that a negative Lateralization Index implies a higher amplitude of concentration change in the left hemisphere and vice versa. Figure 8 shows high variation in Lateralization Indices for all the subjects However, Task 1 Epoch 1 and Epoch 2 (Fig. 8(a),(c)), showed more negative Lateralization Indices, which supports the conclusion that Task 1 is a well-designed task in activating left hemispheric changes. Although not pictured, the RHb’s Lateralization Indices also showed a wide variation similar to OHb’s Lateralization Indices. In order to test if there exists a significant difference in Lateralization Indices between genders, a Mann-Whitney U test was performed. For all Lateralization Indices calculated, only the OHb Lateralization Indices for channel pairings for (3,13), (5,11), (6,12), (7,9) and (8,10) of Task 2 Epoch 1 showed a significant difference (
The preliminary results of this study can be used to improve neurocognitive studies regarding brain lateralization using multichannel fNIRS. From a limited number of subjects, there is evidence of a varied range of Lateralization Indices and correlation between symmetrical channel pairs. Rather than just dividing the groups between genders, there also needs to be measurements of other factors that may influence brain lateralization, such as age or performance of the subjects, similar to other studies [33]. In addition, Task 2 (Latin reading/speaking) did not give a large hemodynamic response from all the subjects whereas Task 1 (double digit subtraction) gave a much higher response.
When observing the trends of the two genders as a whole, Fig. 2 showed that the female subjects exhibited a slower descent of OHb changes for the rest period after stimulation (Fig. 2(a)). The male subjects demonstrated a much faster descent of OHb changes after stimulation and were able to return to a state much closer to baseline (Fig. 2(b)). Various susceptibility to stress between genders [33] may have caused this trend.
Another interesting trend presented in this study is the decrease in correlation of channel pairs as the experiment progressed, as shown in Fig. 7 and Table 2. By the end of the experiment, only 25% of the subject-channel pair combinations showed a correlation coefficient greater than 0.05. The preliminary hypothesis is that global interference from the skin and scalp account for a large part of the signal at the beginning of the experiment but decreases as the experiment progressed. This hypothesis must be validated in future studies by extending the experimental time.
The global interference of the subject may have been a strong factor in the subjects’ initial hemodynamic response. Therefore, it is critical that future brain lateralization studies have robust methods in reducing the global interference so as not to mask the true brain lateralization in the subject. There have been various ways other groups have studied for removing this global interference. For example, a detector closer to the light source may be used, as it has a shorter depth penetration and only obtains the global interference signal stemming from the skin and scalp [34]. Global interference can be removed after scaling the changes from the closer detector and removing them from the concentration changes gathered by the farther detectors. In addition, other groups have used principle component analysis [35] and adaptive filtering[36] to process out the global interference.
The analysis of the running correlation of OHb and RHb in each channel show a very strong negative correlation, the type of correlation that is expected during brain stimulation. Therefore, it has been shown that the multichannel fNIRS probe is robust to motion artifacts such as head movement, despite the subject being unrestrained and sitting in their natural sitting position. This is a major advantage for neurocognitive studies as the constraints of such modalities as fMRI prove difficult for subjects who suffer from neurological disorders [37].
How genders perceive cognitive tasks and correspondingly activate their brains is a combination of many external and internal factors [1]. Various environmental and cultural factors may have influenced human brain lateralization over time [38], which would leave older studies on brain lateralization out of date. The preliminary results of this study challenge what Galaburda (1990) proposed, in that females in general may be better at working within the confines of one brain hemisphere when compared to the more lateralized males [3], and supports the idea of lateralization as an aspect of the individual as stated by Nielsen (2013) [4].
In order to observe brain lateralization, two tasks were designed to specifically activate the left and right hemispheres. The preliminary results of this study point to no significant difference in lateral hemodynamic changes between the genders as a whole for their performance during these two tasks. With that being said, it must be noted Task 1, double digit subtraction, gave a high hemodynamic response, while Task 2, Latin reading and speaking did not give the same response. Even though the task was designed to be abstract, a processing function of the right hemisphere [1], Latin reading and speaking did not elicit a response in either hemisphere for the subjects. This study showed that Pearson Correlation coefficient and a modified Lateralization Index equation for CW NIRS systems may be used to quantify brain lateralization. In addition, fNIRS proved to be a more than capable and pragmatic system for neurocognitive studies and robust against motion artifacts that may influence the neurosignal in other brain imaging modalities [37].
To further develop this study, the results and analysis from this preliminary study will be implemented to construct a better protocol for measuring brain lateralization. In addition to distinguishing between genders, there must be further investigation into other factors such as performance that may be a strong predictor of brain lateralization. Also the right hemispheric task must be further developed so that the subjects give a stronger response, similar to the hemodynamic response of Task 1. The number of tasks given to the subject must be extended in order to properly observe the trend of decreasing correlation with time. Finally, the influence and global interference must be analyzed and removed in order to reveal a much more accurate neurosignal.