Fabry-Perot etalons (FPEs) have many applications in the fields of optical communications and photonics. Highfinesse FPEs have been used for linewidth reduction or frequency stabilization of a semiconductor laser, optoelectronic oscillators, WDM filtering, and so on [1-3]. They have also been used for repetition-rate multiplication of pulsed lasers by spectral filtering [4-6]. Recently, an FPE was used inside a mode-locked laser cavity to stabilize or to lock the laser comb to the FPE transmission (TX) peaks [7, 8]. Having several hundred ultrastable comb lines locked to the FPE-TX peaks opened new application fields in WDM optical networks and photonics [7]. For diverse applications, precise measurement of the free spectral range (FSR) of an FPE is required. For example, to lock mode-locked spectral comb lines to intracavity FPE-TX peaks, the mode-locked laser frequency should stay within 1 ppm (parts per million) of the FSR of the FPE [7, 8]. Conventionally, the FSR of an FPE has been measured by examining its transmission spectrum as the injected laser frequency is scanned [9]. This method is simple but has poor measurement accuracy, due to the resolution limit of the optical spectrum analyzer used to perform the measurement. Recently a new technique, a modified Pound-Drever-Hall (PDH) method, was suggested [10], in which probe light was phase-modulated around the FSR of an FPE and injected into the FPE, and the reflected (or transmitted) light was monitored. The instantaneous amplitude of the reflected light gave information about the difference between the phase modulation (PM) frequency (fpm) and FSR (fFSR). In Ref. [10] the authors achieved a measurement accuracy of 100 ppm. Ozdur
II. PRINCIPLE OF THE FSR MEASUREMENT
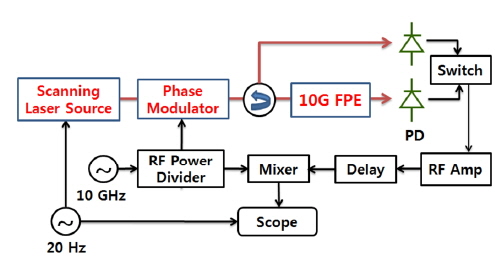
The experimental setup to measure the FSR of an FPE is shown in Fig. 1 [12]. Probe light from a commercially available external cavity laser is scanned over an FPE-TX peak. The scanning frequency is set to 20 Hz. Unlike in the conventional method, the probe light is strongly phase modulated (modulation index β ~ 10) at a frequency near the FSR of an FPE, and the phase-modulated light is injected to the FPE. The suggested measurement scheme relies on the alignments of the PM sidebands with respect to FPE transmission peaks, resulting in the spectral amplitude modulation of the sidebands. Details will be discussed later. In the specific measurement performed here, the FPE consists of 15-mm air-spaced concave (radius 50 cm) and flat mirrors with 270 finesse and 0.01 ppm/K temperature dependence, respectively. The FSR provided by the vendor is 9.99 GHz. The reflected and transmitted light from the FPE are detected by separated photodetectors. The individual detector output for transmitted or reflected light is selected alternately by a switch, amplified by a radio-frequency (RF) amplifier, and mixed with the phase-modulator drive signal. To maximize the mixer output, we adjust the phase of the detector output by controlling an RF delay line. The mixer output, synchronized by the laser scanning frequency (20 Hz), is averaged and measured by a sampling scope. Hereafter we refer to the sampling scope trace as the “error signal”, representing the frequency difference between the PM frequency fpm and fFSR. The error signals for both transmitted and reflected light are obtained from the same circuit through the selectable switch. We monitor the error signal as we tune fpm around fFSR.
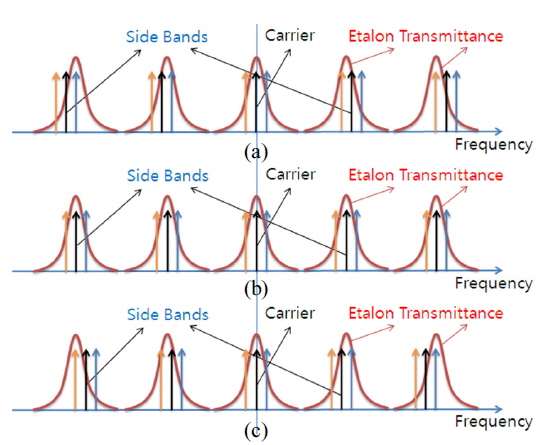
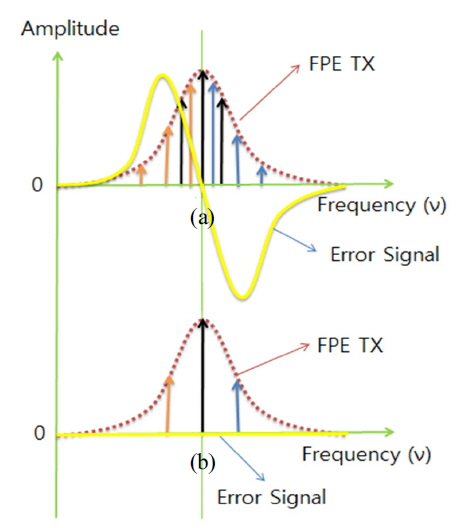
Next we discuss the principle of error-signal generation. Strong sinusoidal PM at fpm generates a large number (~2β) of upper and lower sidebands spaced by fpm around the unmodulated carrier frequency (here, the frequency of the probe light). The amplitude of the sidebands is a function of Jn(β), the Bessel function of the first kind of order n (positive for upper sidebands and negative for lower sidebands). Since the PM waveform occupies a large bandwidth (~2β×fpm), this is called “wide-band” PM. Different alignments of the individual PM sidebands with respect to the FPE-TX peaks yield different losses, resulting in spectral amplitude modulation of the injected PM light. The amount of amplitude modulation, indicating the frequency difference δ = fpm - fFSR, is detected by mixing the detector output and phase-modulator drive signal. To be explicit about the measurement principle, we will consider following three cases (δ > 0, δ = 0, and δ < 0) assuming that the PM light has four sidebands (order n = ±1 and ±2).
In this case, the spacing between the PM sidebands is greater than fFSR. Then the PM sidebands may be determined with respect to the FPE transmission peaks, as shown by the arrows in Fig. 2(a). By scanning the optical (carrier) frequency ν of the probe light, we can shift the spectrum groups from the pink to black to blue arrows. At a relatively low carrier frequency (νL, pink arrows), the upper sidebands are enhanced but the lower sidebands are suppressed, after passing the FPE. This frequency-dependent loss induces the envelope (or amplitude) modulation at fpm for the injected PM light. For clarity of the envelope modulation, we adopt a well-known sampling theorem. All of the PM sidebands shown in Fig. 2 are then mapped on a single FPE-TX curve near the probe-light (carrier) frequency, as shown in Fig. 3 (for simplicity, we only show the carrier and order n = ±1 sidebands). In Fig. 3, we count the frequency-dependent loss experienced by passing (or transmitting) the FPE. The sampling frequency is fFSR, as implicitly shown in Fig. 3(a). As shown in Fig. 3, the frequency spacing between the mapped spectral lines becomes δ. Now the mapped arrows are interpreted as the instantaneous frequencies of the sampled PM waveform. In other words, the instantaneous frequency of the sampled PM waveform swings periodically over the frequency range marked by the arrows (
At a middle frequency (νM, black arrows in Fig. 2(a)), the center (carrier) frequency is enhanced, while both the lower and upper sidebands are equally suppressed. Mapped PM spectra (after passing the FPE) are represented in Fig. 3(a) by black arrows. Envelope modulation is also observed; however, the modulation frequency is doubled (
Now we can combine all cases and predict the mixer output (
Since fpm = fFSR, the carrier and sidebands of the injected PM light experience the same loss, even with scanning of the input optical frequency ν, as shown in Fig. 2(b). At the mapped spectral domain, all the PM spectral lines overlap (no frequency deviation exists) and no envelope modulation or error signal is observed, as shown in Fig. 3(b).
Again, the different alignments (with respect to the FPE-TX peaks) of the PM sidebands introduce frequency-dependent loss (
In summary, to find the exact value of the FSR (δ = 0), we should sweep fpm toward the direction that reduces the amplitude of the error signal, and then pick the value of fpm where the amplitude becomes zero. However, in practice, it is difficult to directly find the frequency at zero amplitude, due to background and other noises. Therefore, we tune fpm from fpm < fFSR to fpm > fFSR to pass fpm = fFSR, then plot the amplitude of the error signal versus fpm to find the zero-crossing point.
Noting that the mixer output

where
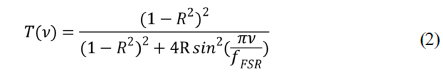
where R is the mirror reflectance of the FPE.
If δ is small,

where
Now let us consider the reflected light, where the FPE reflectance
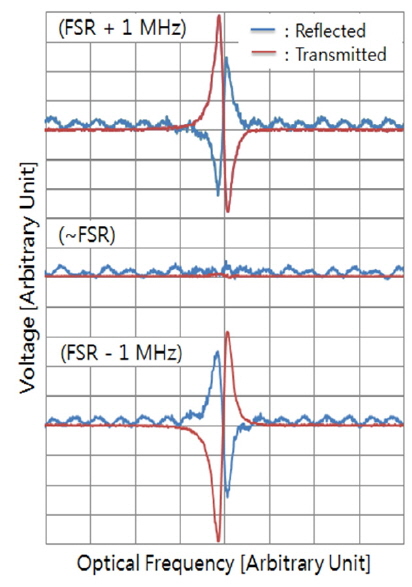
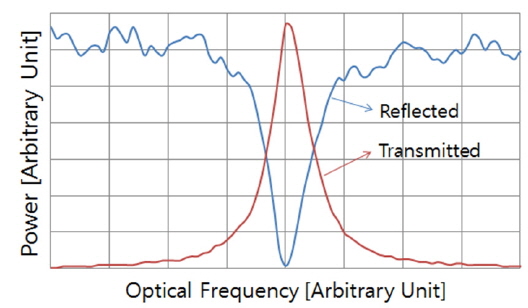
Figure 4 shows the transmittance and reflectance characteristics of the FPE used in our experiment, as a function of optical frequency ν. Due to interference from multiple reflections, the reflectance curve shows some undulation. As discussed, the mixer output (error signal) in Fig. 1 follows approximately the first derivative of the transmission or reflection curve of the FPE (see Fig. 5). Figure 5 shows the error signals for three typical values of fpm: fpm = fFSR + 1 MHz, ∼ fFSR, and fFSR – 1 MHz. For comparison, we intentionally chose the δ = ±1 MHz, corresponding to the previously reported accuracy of 100 ppm [10] with a similar setup to ours. The error signal was averaged by the sampling scope to remove random noise. The blue and red lines represent the error signals for reflected and transmitted light respectively. As expected, the reflected and transmitted error signals (at fixed δ) show similar shapes, but reversed phases. At fpm ∼ fFSR, the amplitude of the individual error signal is suppressed and becomes negligible. Passing the point fpm = fFSR, both error signals have their phases reversed. We understand that the ambiguity of the error signals near fpm = fFSR is induced by the static modulation noise [10] and spectral asymmetry of the sidebands of the injected PM light.
Next, we measure the peak-to-peak amplitudes of the error signals for both transmitted and reflected light as we change fpm, and plot the results in Fig. 6. To avoid the ambiguity of the error signals near fpm = fFSR, we set the zero-crossing point of the plot as the condition for fpm = fFSR. Using linear fits to the data (black straight lines), we find that the zero-crossing points for the reflected and transmitted light are 9.995765 GHz and 9.995779 GHz respectively. The difference may come from added noise and measurement error. We take the crossing point of both fitting lines, and find it is 9.995771 GHz. The crossing point is inherently less sensitive to background noise and/or the ambiguity of the measurement. Therefore we take the crossing point of both fitting lines as the value of fFSR. Here we are able to replicate measurement within 5 kHz accuracy, corresponding to 0.5 ppm. The two orders of magnitude in accuracy improvement over the previous result [10] is attributed mainly to the wide-band PM of the probe light, and partly to the utilization of both lights and good FPE finesse. However, phase modulation that is too strong may induce severe asymmetry in the sidebands, resulting in undesirable amplitude modulation of the PM waveform. In the peak-error-amplitude versus fpm plot, the data points should be on a straight line, as expected from equation (3), regardless of the polarity of δ. However, due to noise and measurement error, the data groups for δ > 0 and for δ < 0 may not be on the same line, as observed in Fig. 3 in [10] and Fig. 5 in [11]. The scheme based on both reflected and transmitted light can effectively reduce the ambiguity when the data groups are not on a straight line. Further improvement of the measurement is expected by using balanced detection of the reflected and transmitted light. This may also reduce the static modulation noise mentioned in [10].
To measure the precise value of the FSR of an FPE, we used a modified Pound-Drever-Hall (PDH) method. We introduced a simple and explicit conceptual diagram of the measurement principle. Noting the periodic transmission/reflection characteristics of an FPE, we adopted a well-known sampling theorem and developed a generalized equation for the PHD output. This equation showed that the measurement accuracy depends on the PM index and the FPE finesse. Therefore, we applied wide-band PM with


![Measured error signals for several values of fpm:: (a) fFSR + 1 MHz, (b) ~ fFSR, and (c) fFSR ? 1 MHz. The 1?MHz deviation corresponds to the 100-ppm accuracy previously reported result in [10].](http://oak.go.kr/repository/journal/15897/E1OSAB_2015_v19n4_357_f005.jpg)