Fluorescence recovery after photobleaching (FRAP) is a well-established method commonly used to measure the diffusion of fluorescent solutes and biomolecules in living cells or tissues. Here a fiber-optic-based FRAP (f-FRAP) system was developed, and validated using macromolecules in water and agarose gels of different concentrations. We applied f-FRAP to measure the site-specific diffusion of fluorescein (NaFluo) in peritoneal membranes (PMs) on the liver, cecum, and kidney of a living rat during peritoneal dialysis. Diffusion of fluorescein in PM varied in a time-dependent manner according to the type of organ (DPM on Liver/DNaFluo = 0.199 ± 0.085, DPM on Cecum/DNaFluo = 0.292 ± 0.151, DPM on Kidney/DNaFluo = 0.218 ± 0.110). The proposed method allows direct quantitative measurement of the three-dimensional diffusion in local PM in vivo, which was previously inaccessible by peritoneal function test methods such as peritoneal equilibration test (PET) and standardized PM assessment (SPA). f-FRAP is promising for local and dynamic assessments of peritoneal pathophysiology and the mass transport properties of PMs, presumed to be affected by variation of tissue structures over different organs and functional changes of the PM with years of peritoneal dialysis.
Peritoneal dialysis (PD) is a renal replacement therapy that uses the peritoneal membrane (PM) to remove uremic toxins and excess body fluid from patients suffering chronic kidney disease. The PM, which covers most intra-abdominal organs and forms the lining of the peritoneal cavity, is a semipermeable membrane with a thickness of about 90 µm and having a large surface area and many capillaries. Numerous researchers have described solute transport in the PM using a three-pore model [1]. According to the model, PM consists of different-sized pores, such as water channels (< 0.5 nm), small pores (4 nm), and large pores (> 15 nm), and they are crucial pathways for solute transport through the PM.
The transport properties of the PM not only depend on the individual patient, but also vary over treatment time. Furthermore, structural and functional changes of the PM due to exposure to dialysis solution affect the dynamic behavior of solute transport, and finally result in ultrafiltration failure or peritoneal sclerosis [2]. Therefore, detecting time-dependent functional and structural changes of the PM is important in predicting mass-transfer properties and in characterizing treatment adequacy. However, current methods for testing peritoneal function have difficulty in directly detecting and quantifying peritoneal dysfunction, or can be time-consuming [3]. The simple and most commonly used method, the peritoneal equilibration test (PET), characterizes overall transport, reports qualitative transport properties rather than showing direct mass-transfer parameters, and only gives information for small solutes such as glucose and creatinine. The standardized PM assessment (SPA) was developed to calculate intraperitoneal volume and net transcapillary ultrafiltration [4]. However, SPA analysis procedures are too laborious to analyze dextran using high-performance liquid chromatography. Therefore, currently there is no direct measurement tool to quantify PM function.
Fluorescence recovery after photobleaching (FRAP) is an optical method used to measure the mobility of fluorescent solutes and biomolecules such as proteins and nucleic acids in membranes and aqueous compartments. This method is based on the live-cell imaging technique and can quantitatively analyze diffusive-transport phenomena in a living system [5]. Axelrod
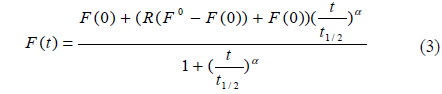
In this study we developed a fiber-optic-based FRAP (
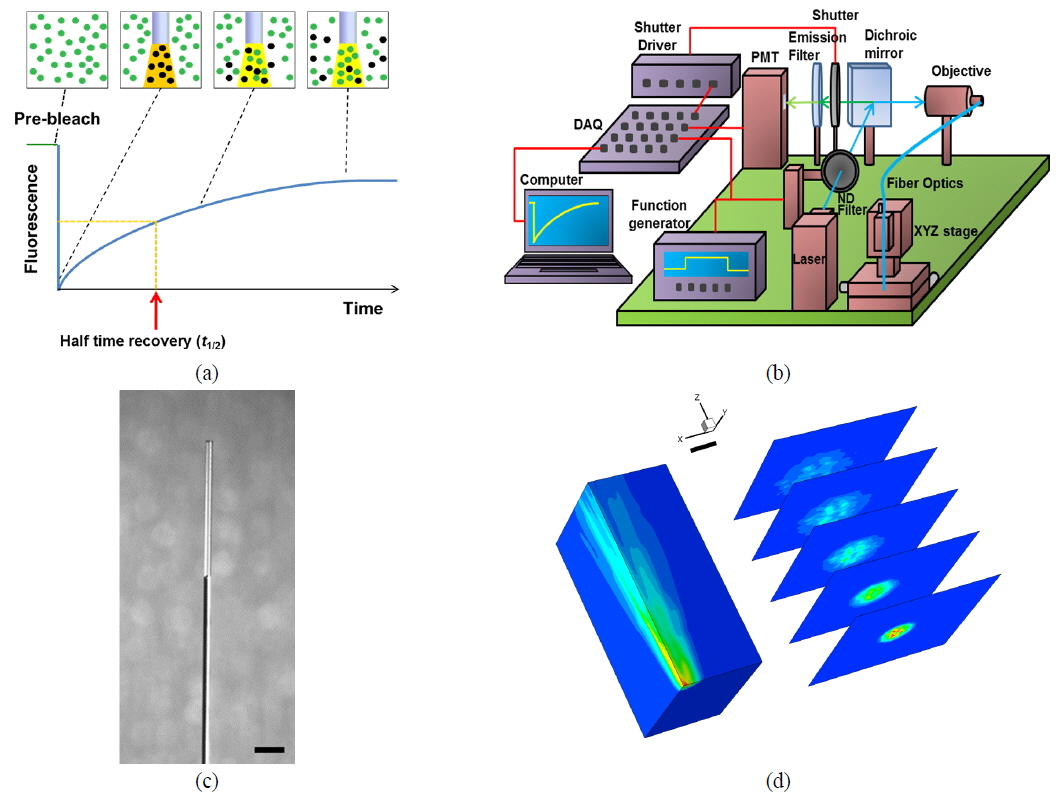
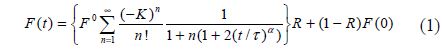
In the FRAP technique, the fluorescence-recovery signals within the bleached region are recorded as a function of time (see Fig. 1(a)). For a Gaussian beam, fluorescence recovery is described as follows [13, 14]:
where
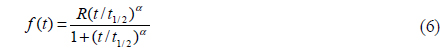
Equation 1 can be simplified as follows [12]:


where
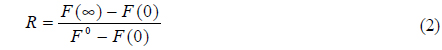
From the fluorescence-recovery signals we obtained the fractional fluorescence recovery curve using the following relation:

The fractional fluorescence-recovery curve can be fitted using
where
In the

Measured diffusion coefficients of fluorescent solutes in samples (
A diagram of the
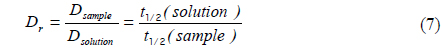
We measured the beam profile of the volume illumination generated by the tapered optical fiber using a laser-beam profiler (SP620U, Ophir Optronics Solutions Ltd, Israel) at 100 cross sections spaced with an interval of 10 μm from the fiber tip. To prevent saturation of the laser-beam intensity, neutral density filters (NE10B, NE20B and NE30B, Thorlabs, USA) were aligned in front of the laser, reducing the intensity by a factor of 10−6. The laser-beam profile emitted from the fiber tip is displayed in Fig. 1(d), which shows the actual excitation field in our photobleaching experiments. To validate the proposed
where
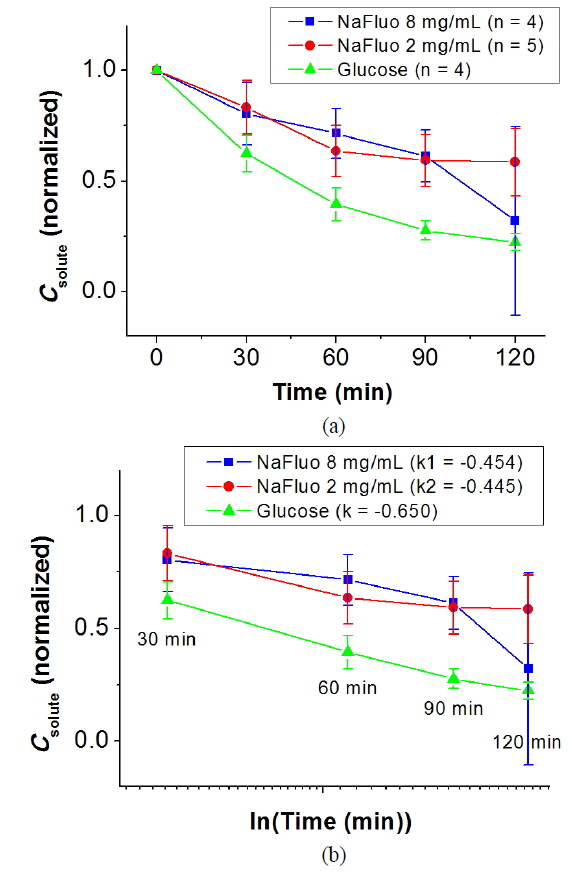
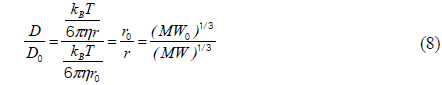
To determine the feasibility of the proposed technique for investigating tissue structure of the PM, relative diffusion coefficients were also measured using different concentrations (0.5, 2.5, and 4.5%) of agarose gels mixed with NaFluo or fluorescein dextrans (3 and 10 kDa). The concentrations of both NaFluo and fluorescein dextrans were 4 mg/ml. We hypothesized that the pore size of the agarose gel would affect the diffusion of molecules. The concentration of agarose was controlled to make different pore sizes of agarose gel. The pore size of 0.5% gel has been reported to be 450 nm [16]. All measured diffusion coefficients were normalized with respect to the diffusion coefficient of NaFluo in solution using the same optical-fiber tip to correct the geometrical variation of the illumination volume at the tip of the fiber.
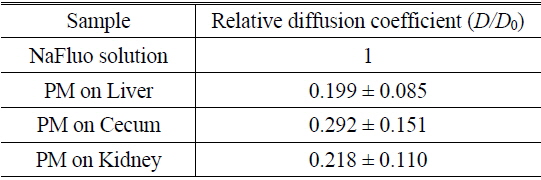
The local ethical committee for animal experiments approved the experimental protocol used in this study (IACUC No. 10-0174). The feasibility of using NaFluo as a surrogate marker for low-molecular-weight solutes in the PM was evaluated using the PET for 2 h with 6-week Sprague-Dawley rats (n = 4 or 5). After placing a catheter in the peritoneal cavity of the rat, PD was carried out with 2.5% dextrose solution for 3 to 7 days. During the PD, dialysate was sampled from the peritoneal cavity of the rat at 0, 30, 60, 90 and 120 min. The dialysate samples were analyzed using spectroscopy and a glucometer, and concentrations of glucose and NaFluo were compared.
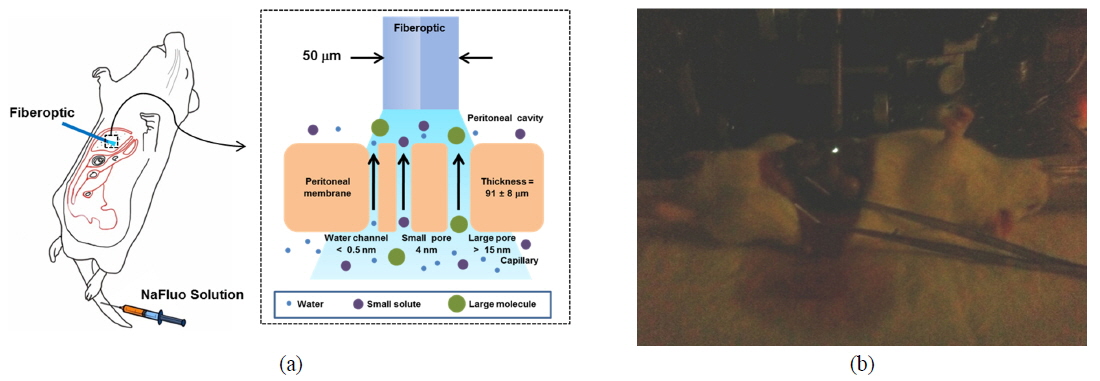
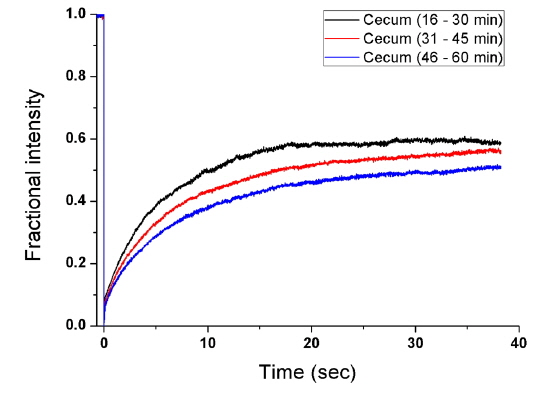
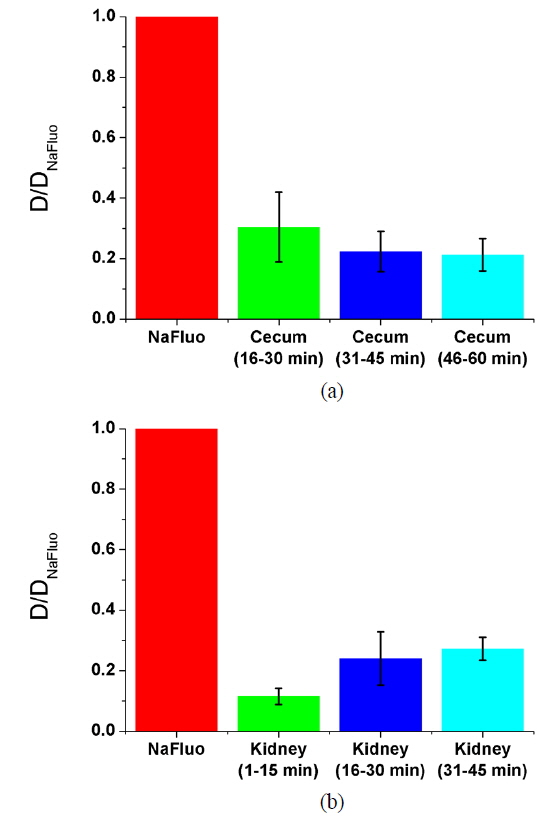
To measure the site-specific diffusion in the PM, the rat was anesthetized on a heating plate to maintain the temperature of the body, dialysate mixed with NaFluo (60 mg/ml) was injected into the tail vein, and dialysate was infused into the peritoneal cavity (see Fig. 2(a)). One minute after the injection, the rat’s abdomen was opened and we replaced the dialysate with fresh solution in the peritoneal cavity to maintain the initial condition. Then the optical-fiber tip was placed on the surface of the local PM that covers an organ (liver, kidney, or cecum), as shown in Fig. 2(b). We tried not to penetrate the PM with the fiber tip because NaFluo molecules diffuse from the capillaries distributed in the PM to the peritoneal cavity. Thus, if we insert the fiber tip deep into the tissue beyond the PM, we cannot obtain fluorescent signals. After confirming the initial fluorescence signals, the diffusion of NaFluo in the PM was measured. We obtained the relative diffusion coefficients of NaFluo in the PM of the rat from each fluorescence-recovery curve and calculated the averaged values of the diffusion coefficients. When we calculated relative diffusion coefficients of NaFluo on each organ, we averaged whole diffusion coefficients regardless of time. Also, when we calculated relative diffusion coefficients of NaFluo at different time periods, we sorted the relative diffusion coefficients according to the time interval (1-15, 16-30, 31-45 and 46-60 min), and calculated averaged values for each period of time.
We repeated the measurement 3-10 times using two rats during the PD (1-15, 16-30, 31-45 and 46-60 min) on the liver, the cecum, and the kidney. In every measurement, we selected different spots on the PM of each organ to avoid excessive photobleaching of NaFluo, and the elapsed time was recorded immediately after injection of dialysate mixed with NaFluo into the tail vein. To observe site-specific dynamic mass transport in the local PMs, we calculated both time-dependent and time-averaged diffusion.
Time-series data were obtained from the photomultiplier tube to calculate the fractional intensity. Our in-house program collected the data before and after photobleaching of the sample. In the
Our
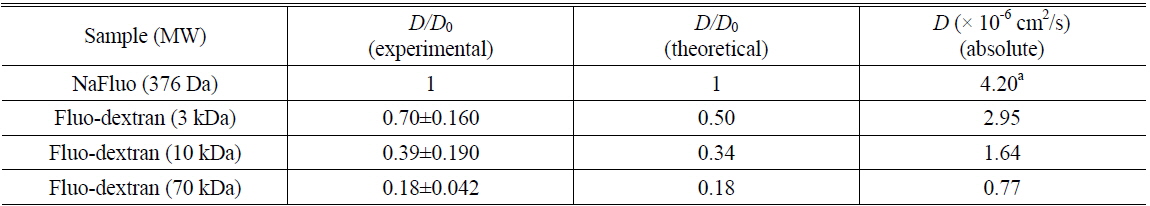
Comparison of experimental and theoretical relative diffusion coefficients D/D0 in solution
NaFluo and glucose showed similar kinetic behavior in the peritoneum of the rat. Figure 4(a) shows normalized solute concentration profiles for NaFluo and glucose during the PET. Figure 4(b) shows concentration profiles with time in logarithmic scale between 30 and 120 min. The slopes of the fitted lines for NaFluo (8 mg/ml), NaFluo (2 mg/ml), and glucose were −0.454, −0.445, and −0.650 respectively. Even though the slope of glucose was higher than those of NaFluo, the three curves showed linear and consistent profiles during the PET. Therefore, NaFluo was applied as a surrogate marker to track relative mass transfer in the PM.
Based on animal experiments, we observed site-specific and time-dependent diffusion of NaFluo. Averaged relative diffusion coefficients of NaFluo in PM on each organ of the rat are listed in Table 2. The local PMs covering the cecum showed a higher

Comparison of relative diffusion coefficients D/D0 of NaFluo in peritoneal membrane on each organ of the rat
In this study we developed the
Solute transport in the PM is related to the mass transfer coefficient (MTC) and the mass transfer area coefficient (MTAC) across the PM (Eqs. 9 and 10) [17]. The MTAC of the whole PM is the same as the sum of the products of the MTC and the surface areas of the specific tissues immersed in the dialysate:


where (
The most common cause of ineffective fluid removal in PD is loss of ultrafiltration capacity due to increased solute transport (high transporters). Impaired ultrafiltration severe enough to require cessation of PD occurs in about 10% of cases [22], which then requires referral to alternative renal-replacement therapy. Long-term PD for more than 2 years, repeated peritonitis, exposure to glucose in PD solution, diabetes, and beta-blockers contribute to these phenomena [23, 24]. Therefore, detecting time-dependent functional and structural changes of the PM is important to sustain PM function in the long term, and to plan any referral to alternative renal-replacement therapy. Currently, test methods monitoring PM function, including PET, provide indirect estimation based on time-averaged dialysate properties. These methods are not able to provide direct information about pathological properties of PM. The mechanism for transport of mid-sized molecules in peritoneal dialysis seems to be a combination of size-selective diffusion and convection through large pores of the PM. However, this hypothesis is still under debate due to lack of a direct measurement tool.
An
In this study we selected NaFluo as a surrogate biomarker for glucose. Ideally, fluorescent glucose analogues should be used for such a study, but they were not available at that time, to our knowledge. Although there is a difference in absolute value for glucose, due to greater molecular weight and negative electrical charge, NaFluo mimicked the overall kinetic behavior of glucose (see Figure 4). Therefore, NaFluo was useful as a surrogate biomarker for small-solute transport in the PM. Different parts of the peritoneal barrier may have different transport characteristics. The permeability, distribution, and surface area of the capillaries within different parts of the PM may have an impact on overall fluid and solute transport [25]. Our results are in good agreement with those of Flessner [17], who measured small-solute transport across a specific PM in a rat. Flessner [17] also measured the MTC of both peritoneal-cavity-to-plasma and plasma-to-peritoneal-cavity transport, and found that the MTC values in both directions were nearly the same. This result suggests that our experimental method to measure the diffusion of NaFluo from a capillary to the peritoneal cavity is valid. Therefore, we were able to measure diffusion coefficients in different sites of the PM at different time points. While
Different local diffusion coefficients might be related to the microvasculature of the PM and local microcirculation. Gotloib
We designed an