We propose a new method for improving the phase contrast of a multiphase digital holographic microscope using a spatial light modulator (SLM). Using the SLM as the annulus, our method improves the light contrast of the object edge to achieve higher accuracy. We demonstrate a digital holographic microscopy technique that provides a 30% improvement in the phase contrast compared to conventional microscopy, which utilizes a mechanical annulus. The phase-contrast improvement allows the 3D reconstructed hologram to be determined more precisely.
Contrast microscopy is very useful for observing specimens and studying biological processes because of its ability to examine cells in their natural state. Observing a living organism in its natural state or environment can provide more information than observing specimens that need to be killed, fixed, or stained before microscopy. Reconstructed three-dimensional (3D) living cells have been studied in contrast microcopy with high-contrast [1-3], high-resolution images [3]. When combined with other means of observation such as fluorescence [4-5], contrast microscopy can be used for studying and interpreting thin specimens [5]. In addition, advances in phase-contrast microscopy, enable us to concentrate on the minute internal structures of particles [6] and can detect a very small number of protein molecules [7].
The in-line digital holographic microscope (DHM) [8-10] is a promising system that gives good performance in 3D reconstruction measurements of specimens. The DHM provides quantitative phase contrast imaging suitable for high-resolution investigations on reflective surfaces as well as for markerfree analysis of living cells [11, 12]. Furthermore, the focus adjustment can be carried out numerically after the measurement, and mechanical auto focus tracking during the measurement is avoided. Thus, DHM offers the advantage of multiple focus plane reconstruction from a single hologram [12]. However, when a thick specimen is used as an object, the images are often surrounded by bright areas, which obscure details along the perimeter of the specimen. These bright regions occur because of the fixed phase of a specially designed annular diaphragm, which is equal in diameter and optically conjugate to an internal phase plate residing in the objective rear focal plane. Depending on the position of the living cell, the phase of light may be one-half or one-quarter wavelength out of phase. As a result, the accuracy of the reconstructed 3D cell is decreased. On other the hand, the phase plate and phase annulus in phase contrast microscopy use special materials as absorbing or dielectric film [13], and the phase difference is calculated based on the thickness and refractive index of these materials [14]. Therefore, mechanical adjustments are required to calculate the distance between the objective lens and the condenser lens with the specimen plate.
In this study, we demonstrate a new method for obtaining phase shifting with a higher phase contrast in the reconstructed 3D hologram using a spatial light modulator (SLM) and an in-line DHM [16]. The key component of this method is an SLM that can display phase information. Using this SLM, the phase band rings can be easily modified with computer software for different sizes and radii. By changing the phase band rings, this method can record phase shifting in a reconstructed specimen that has different thicknesses, removing the dependence on the fixed phase of the phase plate and phase annulus used in conventional phase contrast microscopy. Therefore, the proposed system allows flexibility in the phase choice by calculating the phase on the annulus plane in accordance with the thickness of each object in order to observe the object more precisely.
After describing our proposed method in Section 2, two experimental setups are described in detail in Section 3. The first setup is an optical experiment demonstrating the direct observation of pollen while changing the phase band rings on SLM. The second experiment demonstrates a recording hologram using the fluorescent dye specimen B10F16. Finally, the reconstructed image of the specimen can be seen more clearly than conventional phase contrast microscopy with a contrast improvement of about 30%.
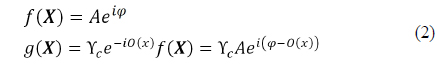
By following the optical principle of phase contrast microscopy as well as the principle of holography, we assume that the laser beam with wavelength

where describes the row and column (2D locations) of the total number of image pixels N on the specimen plate, and A and
After the illuminating wave passes through the specimen plate, the wave is divided two components: the unaltered surround wave
where
Due to the illuminating waves

We assume that the phase plate is an SLM that includes a band ring. This band ring is similar to a band-pass filter, and the unaltered surround wave

where

where is the radial frequency, and

After the SLM, we have the following waves:


The ocular lens performs another Fourier transform, as follows:


where

This function represents the point-spread function of phase contrast microscope:

Similarly, in the annulus SLM position, we have an even number of phases with

where
So, we can calculate a hologram from point-spread function of phase contrast microscope by function:

From Eq. (13) to increase the contrast between the pixels, the phase of the band rings on SLM1 have to satisfy the condition or . In other words, on an SLM with four band rings of opposing phase, then the phase of each band ring is larger than .
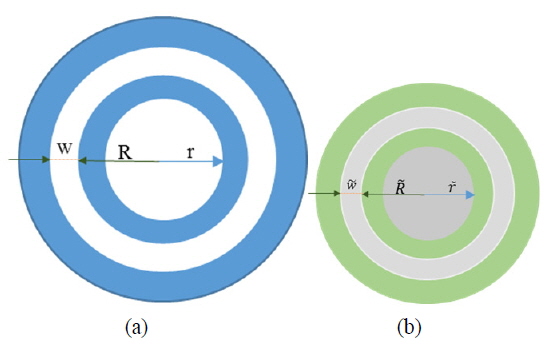
The relative size of the phase band rings between SLM1 and SLM2 can be described as follows:
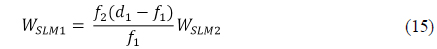
where
Finally, the distance from the objective lens to SLM2 is
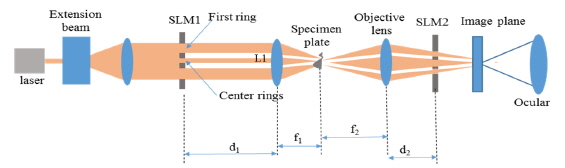
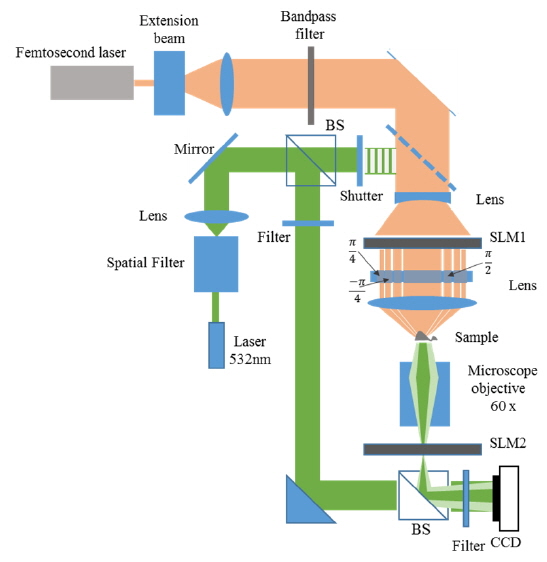
In the first experiment, we captured the images of an object using the optical setup shown in Fig. 1. We applied the proposed method, changing the number of f band rings on SLM1 and SLM2. The laser beam with a 532-nm wavelength and output power of 150 mW is expanded, collimated, and passed through SLM1, which is placed 30mm from lens L1 with a 100-mm focal length. Here, L2 is a 60x magnifying microscopic objective. The object is the pollen from a rhododendron placed on a thin glass plate. The CCD camera has 1024 × 768 pixels, with each pixel having an area of 9 × 9 μm2 and 8-bit resolution.
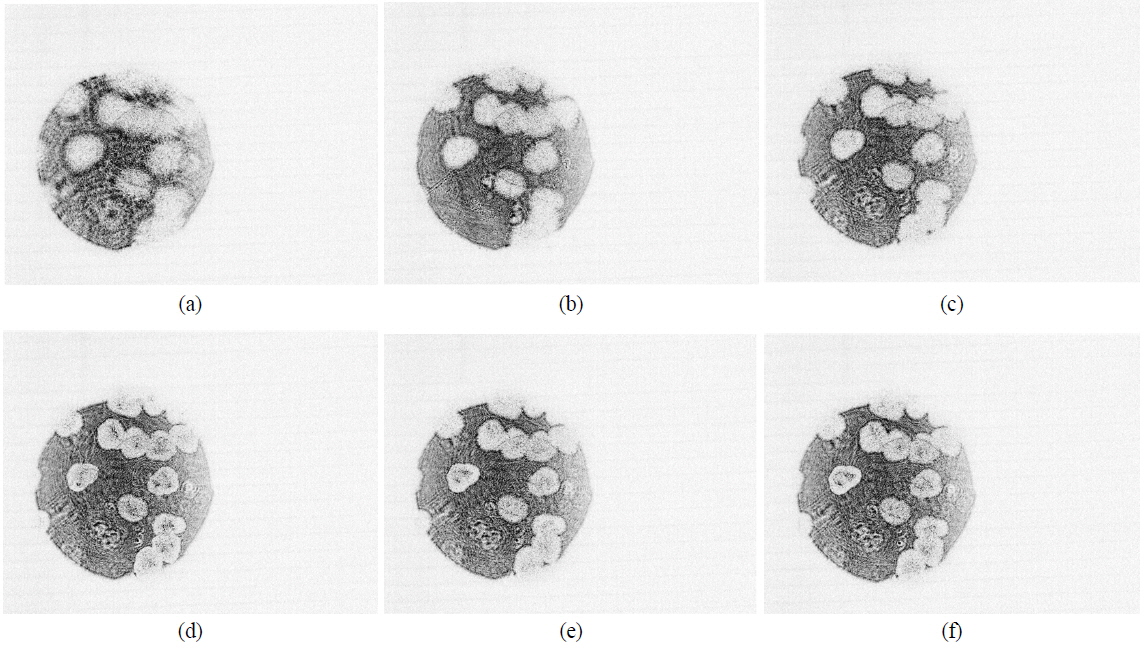
Figure 3 shows contrast phase microscopy with different band rings on SLM1 and SLM2. From Fig. 3(a) to 3(d), the number of band rings is increased from two band rings with phase 0 and, four band rings with phase 0, ; and six band rings with phase 0, , and , and eight band rings with phase and . In Fig. 3(e) and 3(f), the order of phase couples is changed from Fig. 3(d). In particular, in Fig. 3(e), the two band rings with phases 0, are located on the outermost band rings, while the band rings with phase , , , , , are located from the inside to the outside; whereas in Fig. 3(f), the two outermost band rings have phases , with band rings of phase , , , , 0, located from the inside to the outside. These images show a significant increase in contrast of the interference edge of the pollen when band rings with multiple phases are utilized. In the experiment, a standard environmental plane wave was created when the light source passed through a spatial filter and lens. The interfered light on the CCD image sensor was adjusted to an average intensity of the mono mode, which was maintained for all six cases.
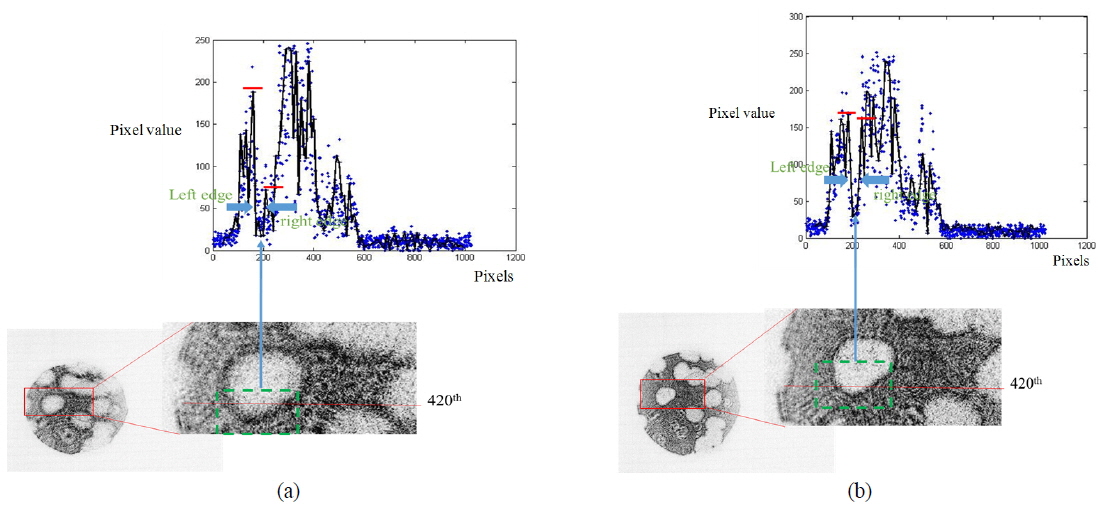
Figure 4 describes the pixel value of the CCD camera on the 420th line in the images. This figure show the data of the recorded images with a phase contrast of two band rings (Fig. 3(a)), four band rings (Fig. 3(b)), six band rings (Fig. 3(c)) and eight band rings (Fig. 3(d)) on SLM1 and SLM2, respectively. The level pixel value of each edge on the pollen is described by the red line in this figure. In Fig. 4, the pixel value is “blue dot” and the solid line is the average of each ten pixels on this cross line.
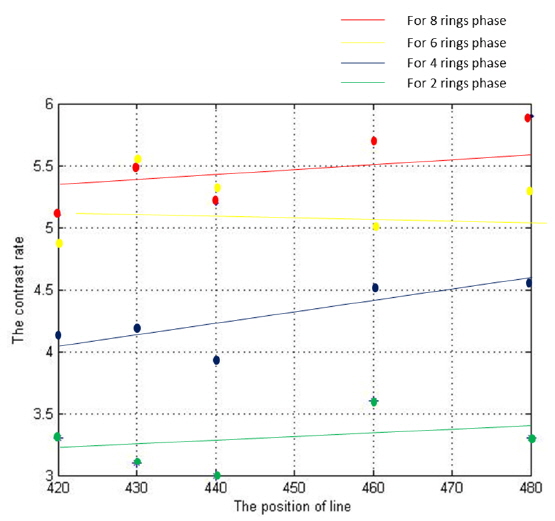
The proposed method with eight band rings has a higher contrast than that with two band rings. The edge of the pollen at the 420th line with eight band rings on the SLM is about 39.3 μm, as shown in Fig. 4(d), while that with two band rings is greater than 50 μm, as shown in Fig. 4(a). The pixel value on the 420th on the left side began to change from 180th to 185th. Therefore, to evaluate the contrast between the edge of pollen and the outside environment, we calculated the ratio of the average value of the 10 pixels from 175th to 185th and 10 pixels from 185th to 195th. In Fig. 4(a), the average of 10 pixel value from 175th to 185th is 142 and 10 pixels from 185th to 195th is 43 so the rate is approximately 142/43≈3.3, while in Fig. 4(d), this rate is about 185/36≈5.13. This contrast rate is described in Fig. 5 with different line for 430th, 440th, 460th and 480th.
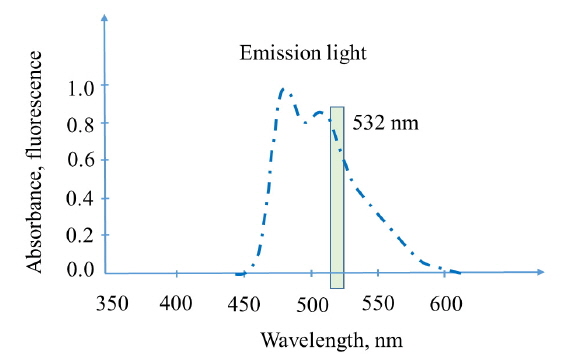
In the second experiment, we captured an in-line hologram of a living cell that was dyed with green fluorescent protein (GFP). The emission spectra wavelengths of this GFP are approximately 450nm to 600 nm (Fig. 6), amplitude emission peak is at 470 nm and declines with increasing wavelength [17]. The wavelength 532 nm is chosen in this experiment for recording the hologram.
The optical setup is illustrated in Fig. 7. A femtosecond laser with 900-nm wavelength is used as the exciting beam, and the experiment is performed similarly to the principles outlined in Fig. 1. A laser beam with a wavelength of 532 nm was used as a reference beam. This beam is separated into two beams: the first beam is a reference beam and recorded by CCD camera, the second beam is to check the quality hologram in the processing recording hologram. The second beam is turned off/ on by a shutter and it does not participate in the process of recording a hologram of the object cell.
In order to obtain the exact hologram of the specimen using the principle of holography, the light that has passed through the specimen must be filtered at a wavelength of 532 nm and must be calibrated carefully as follows. As the specimen was moved from the position of z = 0.3 μm to 2.6 μm at intervals of 120 nm, each hologram was recorded, and the axial position on the CCD plane was obtained from the diffraction calculation of the respective holograms, template matching, and focused objective matching.
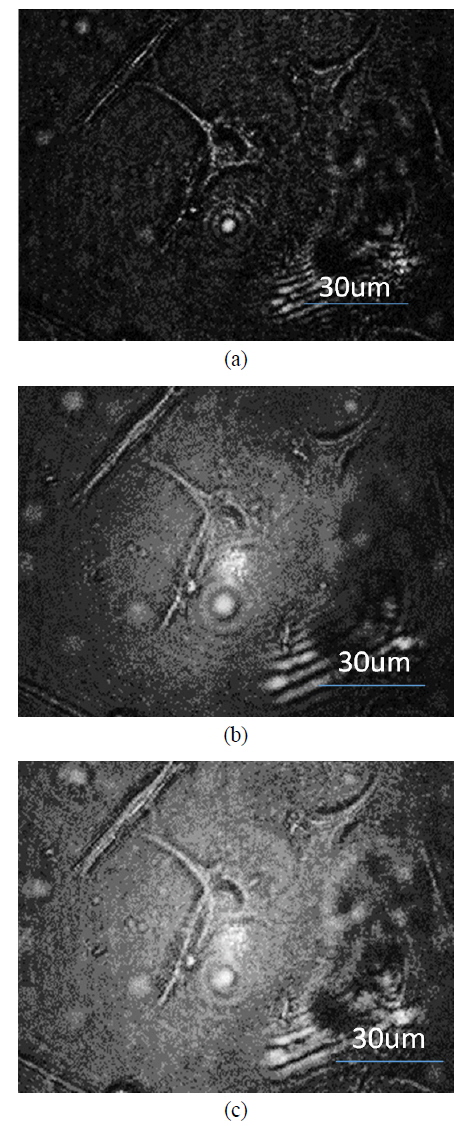
Figure 8 shows the reconstructed hologram of specimen (B16F10) fixed on the substrate glass at the position of z = 1.1μm from the focal plane of the objective lens. The images were captured with two phase band rings (0 and π/2), six phase band rings , and eight phase band rings. These reconstructed images show significant increase in contrast as the number of phase band rings on the SLM increased from two to eight phase band rings. The improvements in contrast were realized by using the phase band rings on SLM instead of mechanical adjustment on the annulus, which increased the accuracy of the image of the specimen.
We developed a new type of annulus in digital holographic microscopy using two SLMs by changing the phase of the band rings. This method overcomes the limitations of conventional microscopy, which uses a mechanical annulus. We achieved flexibility in changing the phase and in choosing the number of phases to increase the contrast in images. When the object is reconstructed with holographic principles, our method improves the quality of the interference edge of the micro-object (pollen) as well as the accuracy of the 3D living cell. Other advantages of our method include the ease of implementation and high stability of the optical system. However, the weakness of fluorescence holographic microscopy is that emission light comes only from the locations on the nucleus of cells or cell components that contain more protein, where dried fluorescence which has the same wavelength with the reference beam, so the cell wall is not clear. We believe that our proposed method, which involves the control of the phase contrast using SLM as well as the balance of the object and reference beam intensity in holographic microscopy, is a flexible and useful technique for advanced microscopy.