Three-dimensional (3D) crosstalk is one of the main causes of visual fatigue and needs to be suppressed. The 3D crosstalk can be categorized into two different kinds according to its appearance-additive 3D crosstalk and subtractive 3D crosstalk. In this paper, we analyze the influence of different kinds of 3D crosstalk to the perceived level of visual fatigue in order to suppress the perceived 3D crosstalk effectively.
Nowadays, various kinds of commercial three-dimensional (3D) display are proposed to provide different left-eye and right-eye images separately to the corresponding eye of the observer [1-2]. Since the disparity between the perceived images from different views is one of the most important cues which induce the 3D perception to the observer, it is essential to establish an optically perfect isolation between those views for the realization of 3D display with a low level of visual fatigue. However, due to the limitations of the current isolating method, some portion of light rays from the other view is mixed with the current view. This phenomenon is called 3D crosstalk [3, 4].
There are other reasons for the visual fatigue which makes the observer uncomfortable in watching a 3D display [5-8]. For example, an excessive binocular disparity between the left-eye image and the right-eye image can cause doubled images from failed 3D fusion. The geometrical difference such as the vertical/horizontal shift and the size difference between the left-eye image and the right-eye image also can make the observer feel visual fatigue easily. Also, luminance difference between the left-eye and the right-eye images should be prevented to suppress visual fatigue.
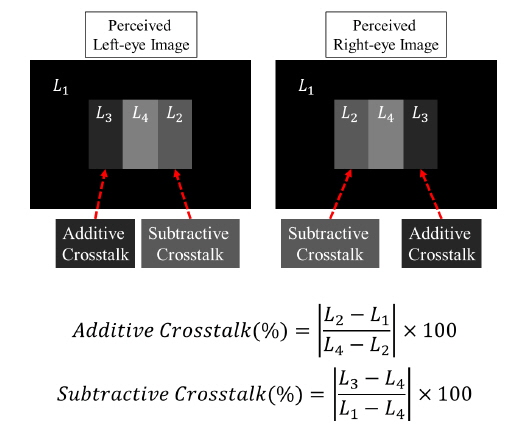
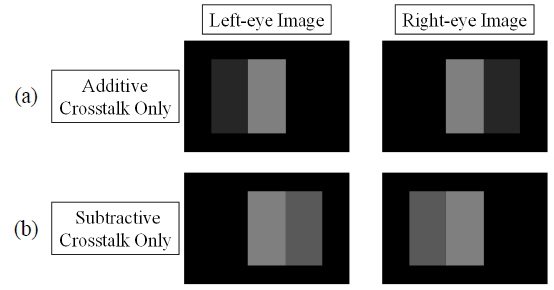
In this paper, we focus on the 3D crosstalk since it is one of the most difficult artifacts to prevent perfectly. Basically, the 3D crosstalk is perceived where the left-eye image and the right-eye image are overlapped as shown in Fig. 1(b). Previous research has revealed that there are two different kinds of 3D crosstalk [9]. The first one has a name of white or additive 3D crosstalk which means an addition of luminance to the original view because of a leaked light from the other view. The other phenomenon is called a black or subtractive 3D crosstalk which is a reduction of luminance of the original view due to the leaking of light from itself to the other view. Examples of the above kinds of 3D crosstalk are shown in Fig. 2. Although there exists a previously proposed method to calculate the additive/subtractive 3D crosstalk of a current 3D display device, it has not been revealed yet whether those two different kinds of 3D crosstalk have the same impact on the level of the visual fatigue of the observer who watches the 3D display with additive or subtractive 3D crosstalk. In order to reveal that point through this paper, we compare and analyze the influences of the additive/subtractive 3D crosstalk on the level of visual fatigue by a subjective experiment using a mirror stereoscope.
As described above, the purpose of our research in this paper is to compare and to analyze the influences of the additive 3D crosstalk and the subtractive 3D crosstalk on the level of visual fatigue. In order to analyze and to compare those influences, we need to consider the following two issues. The first one is the nature of visual fatigue. Since visual fatigue is subjective and personalized, it is hard to compare the level between different subjects by using a question-based investigation, which is commonly used. In other words, even if different observers score the same, it is hard to conclude that the same scores indicate that those observers feel the corresponding levels of visual fatigue because some prejudices or preferences of each observer could affect the result. The other thing that should be considered is the difficulty of controlling the 3D crosstalk using current 3D products. Since the 3D crosstalk is typically related to the properties of optical structure to separate the left-eye and the right-eye images, it is commonly necessary to change those properties to control the level of 3D crosstalk, which is a complicated process. In addition, the differences between optical structures to realize the autostereoscopic 3D displays also affect the responses of the observers who compare them. As a result, it is necessary to realize an experimental setup which can independently control the level of 3D crosstalk without changing the other optical parameters, in order to analyze the influence on the visual fatigue caused by the 3D crosstalk alone.
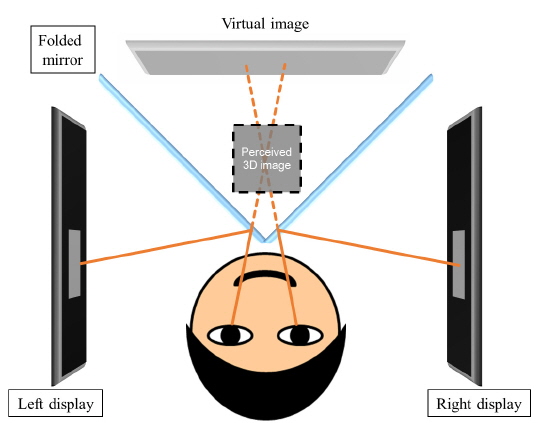
As a candidate for a solution to resolve the above issues, we propose a method based on a mirror stereoscope shown in Fig. 3. The mirror stereoscope is composed of two display modules and a folded front-surface reflection mirror, which prevents a doubled image due to reflections at external and internal surfaces [10-12]. Since the path of the light rays from the left-display and the right-display are optically separated by the mirror as shown in Fig. 3, the left-eye and the right-eye of the observer can see the optically isolated images on the left display and the right display panel through the reflections on the left side and the right side of the folded mirror, respectively. Therefore, it is possible to realize an autostereoscopic 3D display with no 3D crosstalk using the mirror stereoscope.
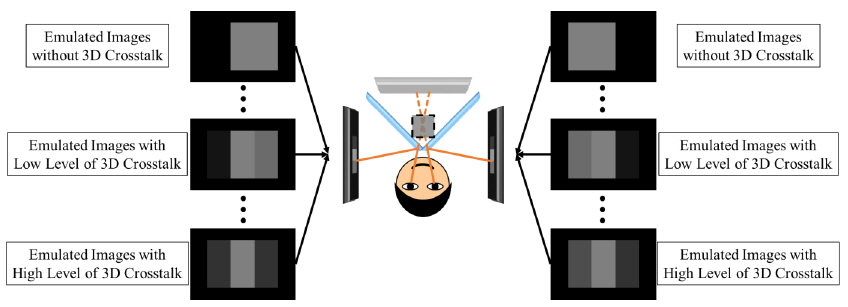
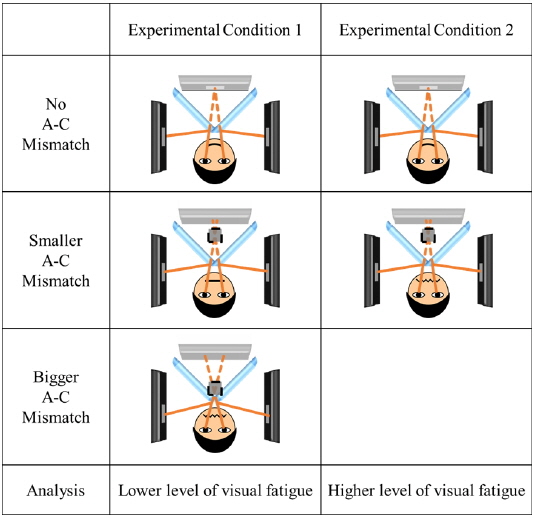
Then, we can emulate a situation in which the observer sees the left-eye and the right-eye images with 3D crosstalk using the mirror stereoscope. The key point is that we can control the level of emulated 3D crosstalk easily. In Fig. 4, the images with emulated artificial 3D crosstalk are shown. From the structure and specifications of the mirror stereoscope, the expected areas of the additive and the subtractive 3D crosstalk - where the left-eye and the right-eye images are perceived to be overlapped - can be calculated. After that, we can emulate a desired level of 3D crosstalk by controlling the luminance of those areas of the displayed images at the left display and the right display as shown in Fig. 4. While emulating a natural 3D crosstalk which is similar to that which occurs in a real 3D display, the most important point is to keep the symmetry between the level of artificial 3D crosstalk at the left-eye and the right-eye images which will be displayed at the left display module and the right display module of the mirror stereoscope, respectively. In other words, there should be the same level of artificial 3D crosstalk at the displayed left-eye and right-eye images. If the above condition is not satisfied, the observer can feel additional fatigue due to the mismatch between the levels of 3D crosstalk perceived at each eye. The detail of 3D crosstalk controlling depends on the grayscale of the display, which indicates the number of steps between the black (minimum luminance) and the white (maximum luminance). For example, if we use display panels with 8-bit grayscale to realize the mirror stereoscope, it is possible to control the level of each (additive/subtractive) 3D crosstalk with 256 steps.
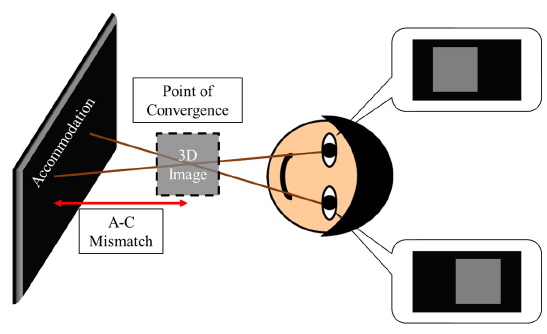
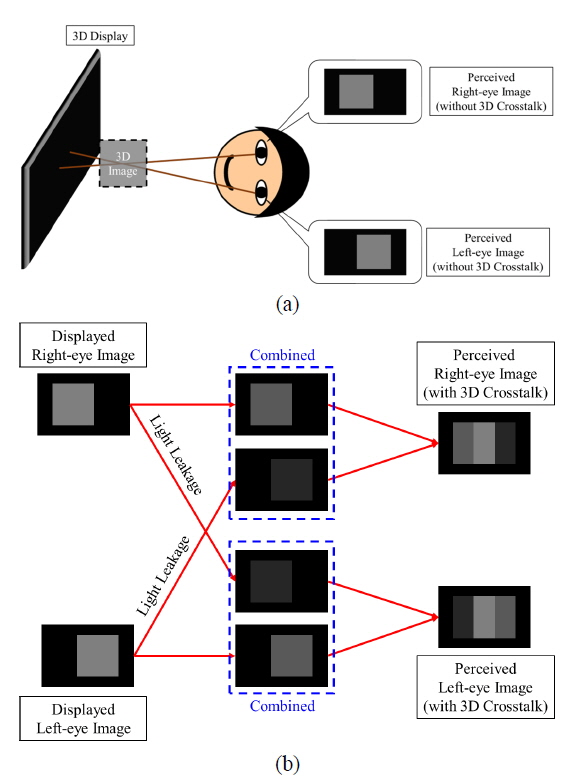
With an experimental setup which is able to control the level of 3D crosstalk, the next thing to consider is how we can measure the level of visual fatigue, which is a subjective and personalized one. For that purpose, we propose a method to measure the level of visual fatigue by the comparison between the responses of a single observer. In the mirror stereoscope, the location of the perceived 3D image is at the positon of convergence while the accommodative response of the observers’ eye is fixed on the display panels. Therefore, there is a mismatch between the convergence point and the accommodation as shown in Fig. 5. This mismatch is called Accommodation-Convergence (A-C) mismatch and it increases with the disparity between the left-eye and the right-eye images. Although the maximum endurable level of A-C mismatch for which the observer can see the 3D image despite the inconvenience due to the mismatch differs between people, it is commonly thought that the threshold will be decreased as the level of perceived visual fatigue becomes higher as shown in Fig. 6. Therefore, we assume that if there is a difference between the influence of the additive/subtractive 3D crosstalk, the tendency of maximum endurable levels of A-C mismatch will be also different. In other words, for example, if the maximum endurable level of A-C mismatch with the additive 3D crosstalk decreases faster than is the case for the subtractive 3D crosstalk, it can be thought that the influence of additive 3D crosstalk to the level of visual fatigue is stronger than that of the subtractive 3D crosstalk. In contrast, if the experimental results show opposite tendencies, the additive 3D crosstalk is thought to have a weaker influence than the subtractive 3D crosstalk.
Since the purpose of our experimental method is to prevent the experimental results from being affected by personal prejudices or preferences, we have provided criteria to make the observers judge the maximum endurable level of A-C mismatch not by their own rules, but by a common rule provided by the guidelines. The first one is the appearance of doubled (separated) images. Since the doubled images mean that the observer failed to fuse the left-eye and the right-eye images into a 3D image, it can be used as an indicator that the observer has reached the maximum endurable level of A-C mismatch. Another criterion is the appearance of a blurred 3D image which means that the observer could not recover the focus no matter how he/she tried. Since the accommodation (focal point of observer’s eye) is at the position of the display screen, the observers found it hard to focus the 3D image as the A-C mismatch increased. Therefore, the blurred 3D image can be thought of as another indicator that the A-C mismatch is beyond the level of the observer’s control. Using those criteria, experimental results based on a common rule of decision can be acquired.
In order to verify our assumption about the experimental condition above, we referred to the ‘3DTV Broadcasting Guideline’ published by TTA (Telecommunications Technology Association) of South Korea in 2013 [13]. In the guideline, the symptoms in which the observers see a doubled image or a blurred 3D image are categorized as kinds of visual fatigue. Therefore, based on the guideline, when the observers in our experiments are in a similar situation with the above symptoms, we can assume that they started to feel visual fatigue, even though the observing time is not so long.
III. EXPERIMENTAL SETUP AND RESULTS
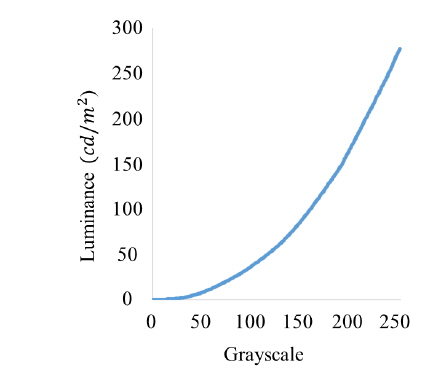
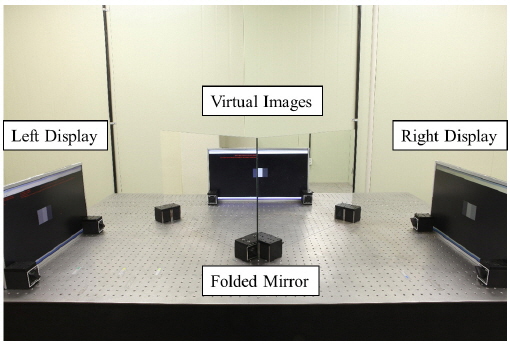
In the subjective experiments, two 22-inch LCD panels with 8-bit grayscale (256 steps) are used to realize the mirror stereoscope shown in Fig. 7. The distance between the observer and the virtual images formed by the reflection at a folded mirror is set to be 745mm. Then, we use a luminance meter to measure the relation between the grayscale and the luminance of the LCD panel as plotted in Fig. 8. From that relation, the emulated levels of each kind of 3D crosstalk are defined as in Table 1. In our experiments, since the grayscale-luminance relation has a non-linear curvature as shown in Fig. 8, the density of emulated levels of the additive 3D crosstalk in Table 1 is much higher than that of the subtractive 3D crosstalk.
[TABLE 1.] The emulated level of the additive 3D crosstalk along the level of grayscale
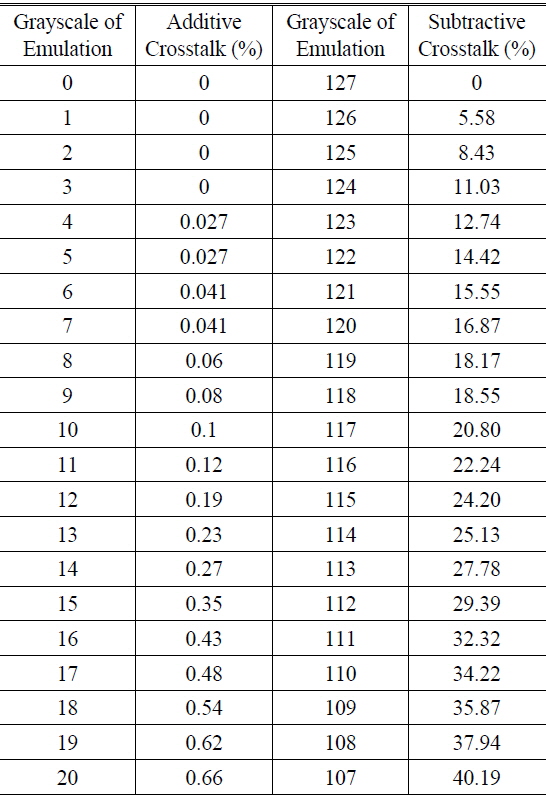
The emulated level of the additive 3D crosstalk along the level of grayscale
In order to analyze the influence of the additive 3D crosstalk and the subtractive 3D crosstalk independently, we prepare two kinds of different left-eye images and right-eye images including only one kind (additive or subtractive) of 3D crosstalk all of which are shown in Fig. 9.
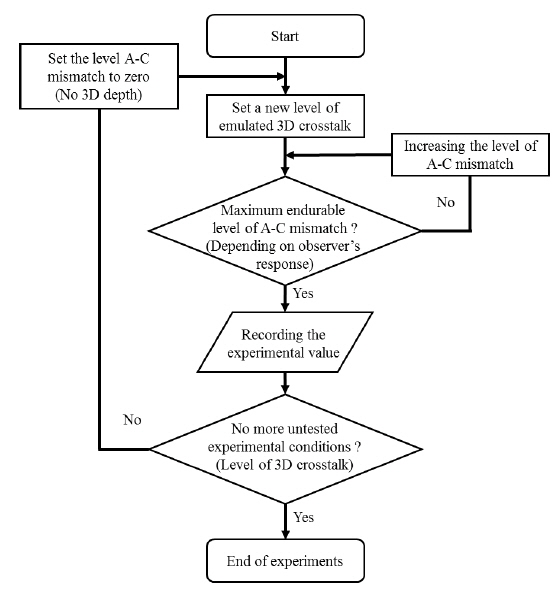
At the beginning of the experiment, the left-eye and the right-eye images shown above are displayed at the left-display and the right-display with no disparity (no A-C mismatch) and with a designated level of additive or subtractive 3D crosstalk between those images. After that, the disparity between them starts to increase slowly to induce larger A-C mismatch while the level of 3D crosstalk remains the same. During the experiment, the observer can claim to stop increasing the disparity when he/she feels the A-C mismatch is beyond an endurable level. Then, that maximum A-C mismatch with corresponding level of 3D crosstalk is recorded and a new experiment begins with the same process but different level of 3D crosstalk. A flowchart to summarize the above procedure is shown in Fig. 10. With the above procedure, it is possible to trace the tendency between the responses of the observer about the maximum endurable levels of A-C mismatch to various levels of the additive and the subtractive 3D crosstalk.
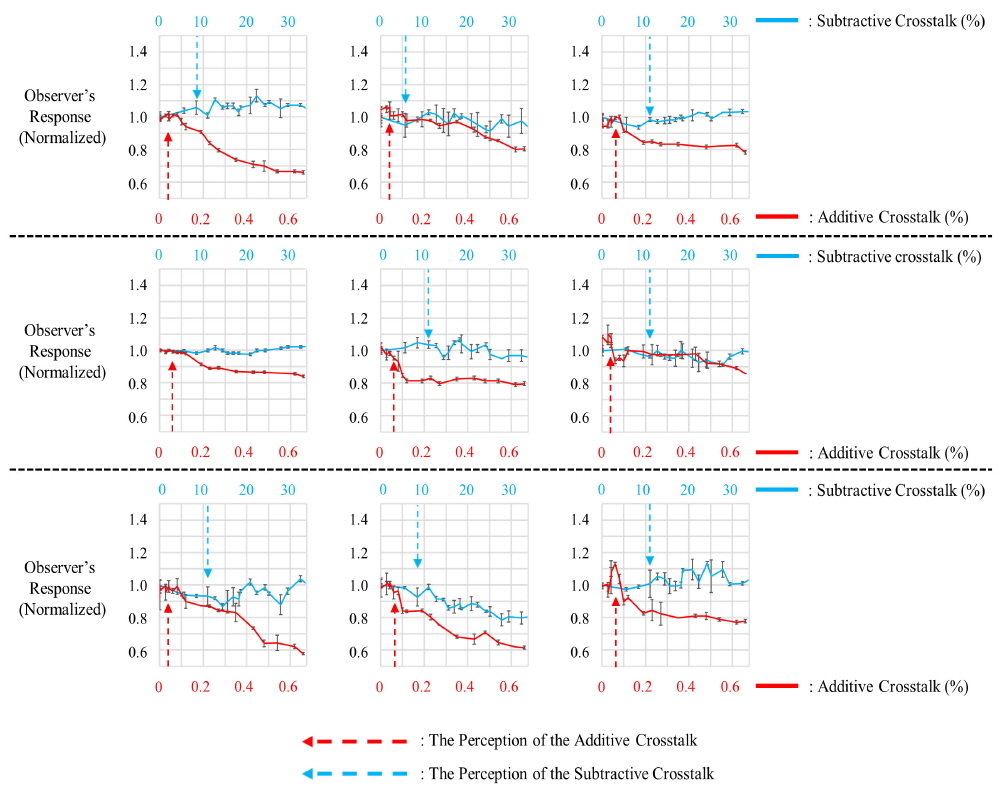
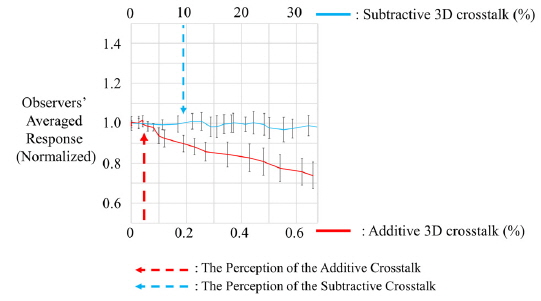
The maximum endurable levels of A-C mismatch which show the level of perceived visual fatigue are measured with a unit of diopters through the experiments with nine observers, and we plot the result in Fig. 11. In order to compensate the personally biased results of each observer, the vertical axes of the graphs in Fig. 11 show the normalized values divided by the experimental result (maximum endurable levels of A-C mismatch) of each observer at initial experimental condition when no 3D crosstalk was induced. Since a diopter value is a reciprocal number of a distance between the measuring point and the eye of the observer, smaller diopter value in Fig. 11 means that the distance between the point of convergence and the eye of the observer was larger for the corresponding 3D crosstalk. In other words, it means that the observer could not endure a higher level of A-C mismatch (closer position of convergence to the eye of observer), and it can be thought that the observer experienced a higher level of visual fatigue. As shown in Fig. 11, the responses of the observers show a declining tendency clearly even with such a small amount of the additive 3D crosstalk levels, which are below 0.5 percent. Therefore, it can be observed that the observers were sensitive to additive 3D crosstalk. In contrast, the responses of observers to subtractive 3D crosstalk show a relatively stable tendency although the level of subtractive 3D crosstalk is much higher (over 20 percent) than that of the additive 3D crosstalk. The averaged results from 9 observers are also shown in Fig. 12 and they show the same contrasting influences of the additive and the subtractive 3D crosstalk to the perceived level of visual fatigue. Therefore, the results in Fig. 11 and Fig. 12 indicate that the additive 3D crosstalk induces the visual fatigue more easily than the subtractive 3D crosstalk. In addition, it is also revealed that the observers could recognize the additive 3D crosstalk much more easily than the subtractive 3D crosstalk.
IV. DISCUSSION AND CONCLUSIONS
The different influences of the additive/subtractive 3D crosstalk are expected to be based on the contrast sensitivity of the human visual system (HVS). From previous research about the contrast sensitivity of the HVS, it has been revealed that the HVS becomes more sensitive if the background is darker [14]. That condition is well matched with the results of the case of additive 3D crosstalk in this paper. Through this research, the previous research about the contrast sensitivity of the HVS can be connected with the recommended specifications, which suggest that the additive 3D crosstalk should be suppressed more than the subtractive 3D crosstalk.