Effects of rearing density on growth and survival of the polychaete rockworm Marphysa sanguinea have been investigated in order to develop rearing techniques for this species. This study was examined over a nine-month period in the Fisheries Science and Technology Center of Pukyong National University. Three rockworm densities, 500, 1,000 and 2,000 worms∙m-2 with weight ranges of < 0.5 g, 0.6-1.5 g, and 1.6-2.5 g, and the no feed control treatment, were stocked in triplicate 0.10 m2 boxes with sand bottoms. Growth rates were checked with 15 randomly sampled rockworms from each box at months 3, 6 and 9. Results showed that SGRs in all treatments were higher during the first period (0-3 months) than the second (3-6 months) and third periods (6-9 months) for all treatment densities, while SGRs decreased with increasing density. However, survival and growth of worms at high density was not better than low density, but daily biomass production in medium and high density groups was 6.28 g m-2day-1 for the rockworms of 0.6-1.5 g with 2,000 inds∙m-2, and 12.6 g m-2day-1 for group between 1.6-2.5 g with 2,000 inds∙m-2, and 14.7 g m-2day-1 for the group of individuals <0.5 g with 1,000 inds∙m-2. Results showed that M. sanguinea can be one of the most suitable species to commercially exploit in a farming system. In particular, specified densities permit elevated pure production.
The ecological role of polychaetes in marine benthic communities is very important (Giangrande et al., 2005). They are known to be good indicators of species richness (Olsgart and Somerfield, 2000) and as bio-indicators of the marine environment (Pocklington and Wells, 1992; Giangrande et al., 2005).
The rockworm
The production costs of polychaete worms in an intensive worm aquaculture system should be efficient enough to make profits (Nesto et al., 2012). Therefore, one of the most important factors for culturing these species is production density (Olive, 1999; Prevedelli, 1994; Safarik et al., 2006). The role of density dependent processes in the regulation of animal populations has also been a subject of interest for many ecologists, and density-dependent factors, including competition for space and food, are also important structuring agents for populations of a number of sediment dwelling polychaete species (Scaps et al., 1998; Buekema et al., 2000; Omena and Zacagnini, 2000; Reise et al., 2001).
Preliminary information on the life cycle of these populations and the influence of several environmental variables was acquired from Prevedelli’s laboratory study (1994). It showed a positive correlation between the growth and developmental rate of juveniles and water temperature was observed. The present study examined the effects of density on growth and mortality of the rockworm
A nine month long on-site controlled experiment was conducted with 3 density groups and 1 no feed group for 3 different body size groups (< 0.5 g, 0.6 to 1.5 g and 1.6 to 2.5 g) of the rockworm
The worms were reared in PVC boxes (0.1 m2), measuring 40 cm (L) × 25 cm (W) × 20 cm (D). The boxes were half-filled with sand (150-500 μm), which was sun dried and then rinsed several times with freshwater. For each different body size group (< 0.5 g, 0.6 to 1.5 g and 1.6 to 2.5 g), three boxes were allocated per density group (T1, T2, and T3) and the no feed control (TC). This totaled twelve boxes per weight group, and 36 boxes total for the experiment. All boxes were connected to a seawater flow through system and the water was pumped from Jaran Bay in front of the Center. In order to examine the growth rates, 15 worms were randomly sampled from each box for every 3 month period. Water temperature was maintained at 20 ± 2℃ using a Thermo Control Unit. Water quality (temperature, salinity, dissolved oxygen and pH) was measured three times per week by the Hydrolab Surveyor 4a device.
Specific growth rate (SGR) (%) = 100 [ln(Wf−Wi)] t−1, Weight gain (WG) (%) = [100 × (Wf−Wi)/Wi],
where Wf is the final weight, Wi is the initial weight and t is the time interval in days. The survival rate was calculated with the number of surviving organisms at each time with respect to their initial number. The number of surviving organisms at the end of the experiment was used to calculate the final density (inds∙m−2), final biomass production, i.e. product of final density and individual mean wet weight (g m−2) and daily biomass production (g m−2 day−1).
Confirming normality and homogeneity of variance of data were tested using the Kolmogorov-Smirnov test. Statistically significant differences among measured parameters were computed using a one-way ANOVA by SPSS 15 software for Windows (SPSS Inc., Chicago, IL, USA). Significant differences between treatments (
During the nine-month study, there was little variation in salinity (34-35.5 psu) and pH (7.5-8.2) in the treatment boxes. Dissolved oxygen concentrations within the treatment boxes ranged from 5.8-6.9. As shown in Table 1, significant differences (
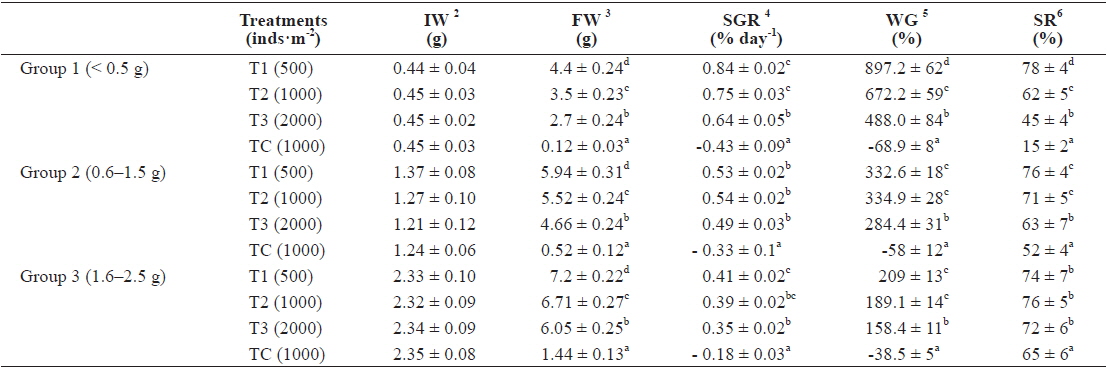
Growth performance of the different body size (Group 1, 2, 3) of rockworm Marphysa sanguinea reared under 3 different densities (T1, T2, and T3) and a no feed treatment (TC) for 9 months1
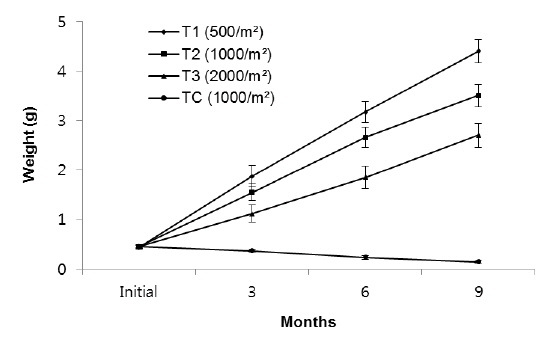
In group 1 (less than 0.5 g body size), significant differences in total weight (
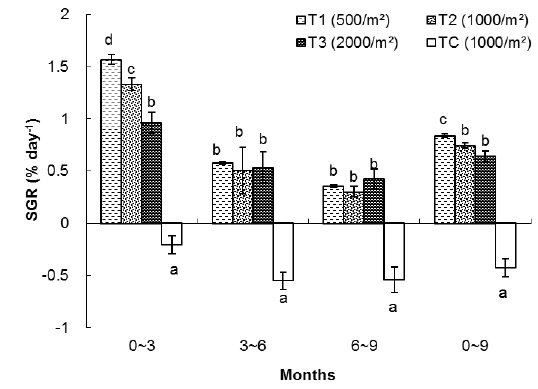
In this group, the highest SGR was found in T1 and the lowest one to TC. The SGRs of T1, T2, T3 and TC groups were 0.84%, 0.75%, 0.64% and -0.43%, respectively. The SGRs of T1 and T2 were significantly higher than those of T3 and TC. The SGR of TC was the lowest among the treatments (Table 1).
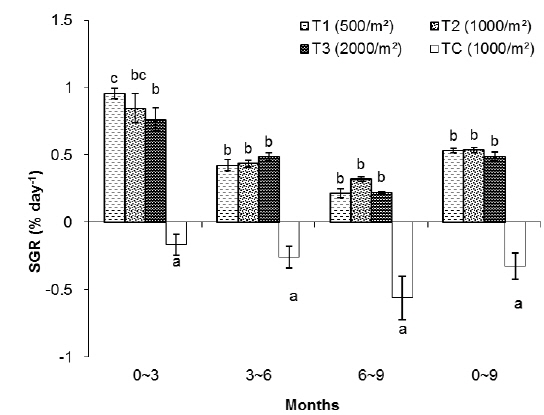
As shown in Fig. 2, in the first 3 months there were significant differences in SGR between treatments but in the second and third 3 month periods of the experiment there were no significant differences between treatments (without considering the control). The highest specific growth rates were evident for all samples in the first 3 months, followed by a general decrease. At the end of the experiment, survival rates of the T1, T2, T3 and TC groups were 78%, 62%, 45% and 15%, respectively.
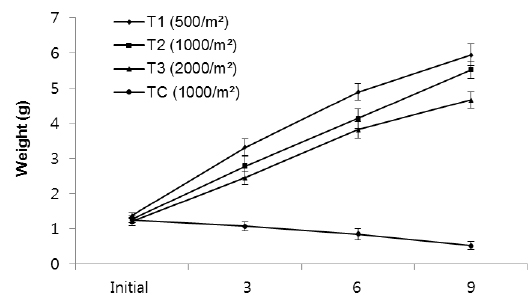
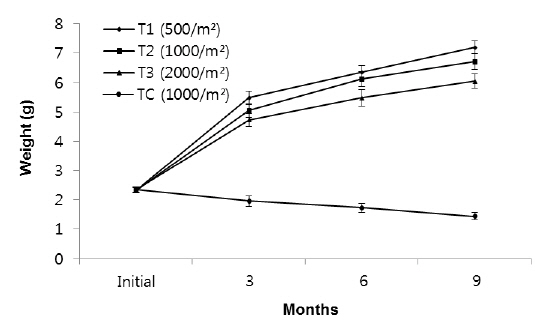
The growth measured in weight in group 2, indicated significant differences in weight among the density treatments (Fig. 3). In T1, the growth rate in the first 3 months (1.94 g) was higher than the second (1.58 g) and third 3 months (1.05 g). In T2, growth rate in the first, second and third 3 months were 1.51 g, 1.35 g and 1.39 g, respectively, while those in T3 were 1.24 g, 1.36 g and 0.85 g, respectively. The growth rate of TC in the first, second and third 3 months were - 0.17 g, - 0.22g and - 0.33 g, respectively.
In particular, the growth rate was significantly lower in the highest density group. After nine months, average total weights of rockworms in T1, T2, T3 and TC treatments reached to 5.94 ± 0.31 g, 5.52 ± 0.24 g, 4.66 ± 0.24 g and 0.52 ± 0.12 g, respectively.
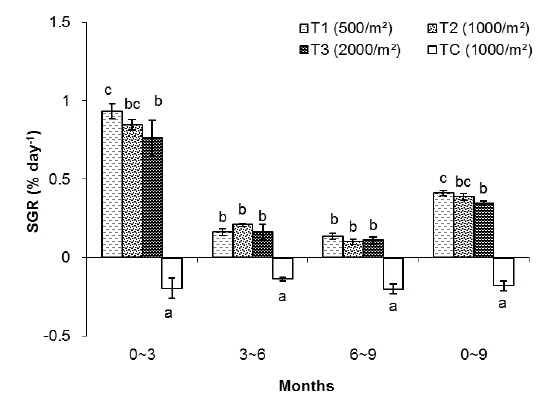
In the T1 (500 inds∙m-2) treatment, the specific growth rate was higher than in other treatments but there was no significant differences in SGR between T1 and T2 as for T1, T2, T3 and TC: 0.53%, 0.54%, 0.49% and -0.33% day-1, respectively (Table 1). As shown in Fig. 4, in the first 3 months there were significant differences in SGR between T1 and T3 and control but there was no significant difference between T1 and T2, also no significant difference observed between T2 and T3. In the second and third 3 month period of the experiment there were no significant differences in SGR between treatments (except the TC). Similar to group 1, high specific growth rates, were evidenced for all samples in the first 3 months, followed by a general decrease. In group 1, at the end of the experiment, the survival rate of the treatment with low density (T1) was higher (76%) than the other treatments as those were 71%, 63% and 52% for T2, T3 and TC, respectively.
In group 3 (1.6-2.5 g), the average weights of worms at the densities of 500 inds∙m−2, 1,000 inds∙m−2, 2,000 inds∙m−2 and TC (1,000 inds∙m−2) were 7.2 g, 6.71 g, 6.05 g and 1.44 g, respectively (Fig. 5, Table 1). These results showed that there were significantly large differences in mean weight among all treatments as the highest weight belonged to T1 and the lowest belonged to the control group (
The specific growth rate in T1 (500 inds∙m-2) was higher than in other treatments, but there was no significant difference in SGR between T1 and T2. Also, no significant difference was observed in SGR between T2 and T3 as those were 0.41, 0.39, 0.35 and -0.18% for T1, T2, T3 and TC, respectively (
Rearing density effects on growth of rockworms were apparent in the long term. As expected, means of weight and survival were highest at low density and the lowest growth was at high density, following 3, 6 and 9 months (Figs. 1, 3 and 5) of incubation. In the whole experiment, the organisms kept at the highest density (2,000 inds∙m−2) showed the lowest value of specific growth rates suggesting the negative influence of increasing intra-specific competition, as observed in some nereidid polychaetes (Miller and Jumars, 1986; Zajac, 1986; Nesto et al., 2012). At all density levels, estimated specific growth rate during the first 3 months was higher than during the second and third trimester. Our results are in agreement with the results of Nesto et al. (2012) on
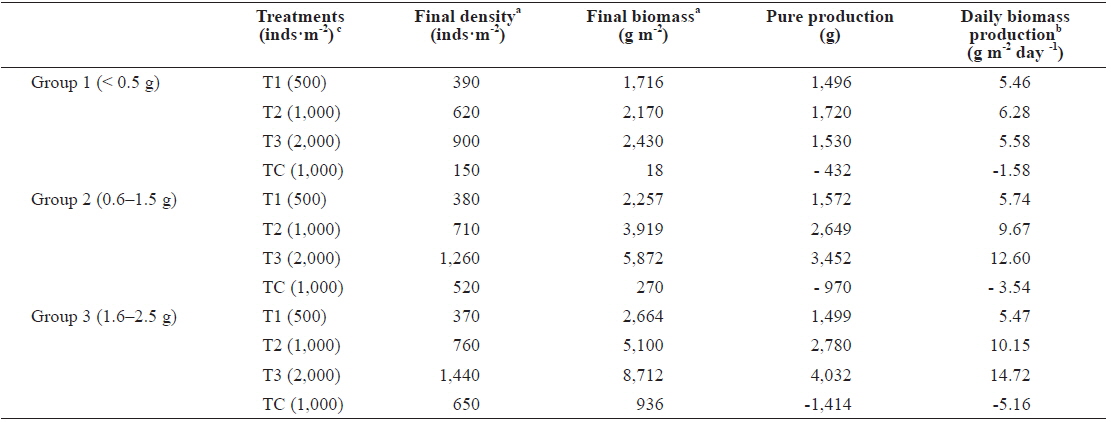
The final density and biomass per unit area and the daily biomass production are shown in Table 2. The maximum values of biomass were reached by the highest density sample, but organism mean weight was lower than in other densities. In group 1, after 9 months the best pure production observed was in T2 at 1,720 g·m-2. T2’s final biomass was approximately 5 times greater than polychaete weight following the start of incubation with daily biomass production of 6.28 g m-2 day-1. These results are in line with the results of Nesto et al. (2012) about
[Table 2.] Production parameters calculated in Marphysa sanguinea maintained at different densities

Production parameters calculated in Marphysa sanguinea maintained at different densities
In all groups, maximum growth rate was noticed in the first 3 months. Thereafter, declines in growth rate were observed in all treatments but were most marked for polychaetes at high density, which showed little further increase in weight. Individual worm growth in high density was not better than in low density. Negative effects on individual growth in high densities probably were due to stress associated with finding of feed and suitable space.
The observed negative density-dependent effects on growth of juvenile and late juvenile
It is evident that polychaete
Considering 3.5–4 g as the best market weight for the polychaete