Feed costs account for the major portion of aquaculture production costs, making feed management one of the most important determinants of viability and productivity of any commercial aquaculture operation. Diet cost could represent 30-70% of the total operating cost of an aquaculture enterprise, the percentage increasing with increase intensification of the operation (Lovell, 1998; Webster et al., 2001). Over- and underfeeding both adversely affect the growth performance and survival of fish and undermine the success of an aquaculture venture. Optimum feeding rates have been reported in different species and sizes of fish and have been found to depend on several factors such as feeding frequency, nutrient content of feed, fish species, fish size and water temperature (Collins, 1971; Andrews and Page, 1975; Minton, 1978; Hung and Lutes, 1987; Hung et al., 1989, 1993, 1995; Li and Lovell, 1992a, 1992b). Parameters employed in determination of optimum feeding rates include growth performance, feed utilization, whole-body proximate composition, serological characteristics and histological changes in fish (Cho et al., 2006, 2007; Kim et al., 2007; Okorie et al., 2013).
Olive flounder,
To meet the ever-growing demand for olive flounder, farmers have resorted to over-feeding fish to minimize culture time. This has the adverse effects of wasting feed, lowering feed efficiency and producing fatty fish (Minton, 1978; Andrews, 1979; Li and Lovell, 1992a, 1992b; Munsiri and Lovell, 1993). To optimize growth, cost of production and product quality, the optimum feeding rates for various sizes of this species need to be established. Furthermore, to reduce labor cost, a computer simulated automated feeding system needs to be developed using the size-specific feeding rates. Therefore, a series of feeding trials were conducted to determine the optimum feeding rates in various growth stages of olive flounder at the optimum rearing temperature in order to propose a computer simulated feeding program for this species. Here, we review results of those feeding trials along with findings by other authors in this species.
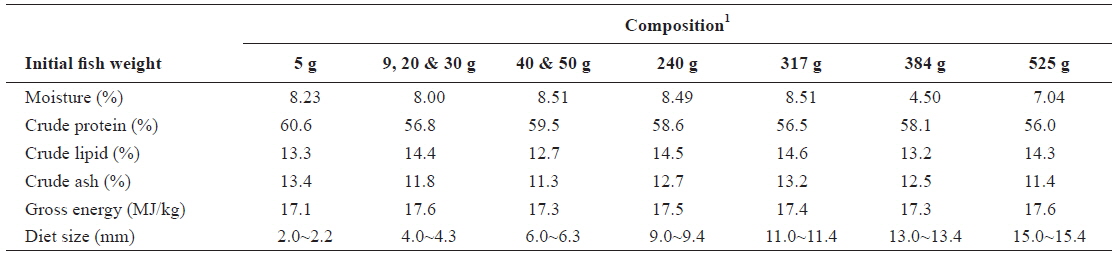
The commercial feed used in all the feeding trials was supplied by Suhyup Feed Company Limited (Uiryeong, Gyeongsangnamdo, Republic of Korea). Pellet sizes with the corresponding proximate composition were selected according to the sizes of fish, as done on farm and in line with the company recommendation. Proximate composition of the experimental diets organized according to the initial fish weights is shown in Table 1.
[Table 1.] Proximate composition of the experimental diets (dry matter basis)

Proximate composition of the experimental diets (dry matter basis)
Feed of 2.0-2.2 mm diameter was used in experiment 1 (5 g) of the first stage of juvenile olive flounder and the feed contained 60.6% crude protein, 13.3% crude lipid, 13.4% crude ash, 8.23% moisture and 17.1 MJ/kg gross energy. In experiment 2, 4-4.3 mm feed containing 56.8% crude protein, 14.4% crude lipid, 11.8% crude ash, 8.0% moisture and 17.6 MJ/kg gross energy was used.
In experiment 3 and experiment 4 in the second stage of juvenile olive flounder, 4.0-4.3 mm feed containing 56.8% crude protein, 14.4% crude lipid, 11.8% crude ash, 8.0% moisture and 17.6 MJ/kg gross energy was used. Experiment 5 and experiment 6 of this stage were done with 6.0-6.3 mm feed containing 59.5% crude protein, 12.7% crude lipid, 11.3% crude ash, 8.51% moisture and 17.3 MJ/kg gross energy.
The 9.0-9.4 mm diameter feed used in experiment 7 in the growing stage of olive flounder contained 58.6%, 14.5%, 12.7%, 8.49% and 17.5 MJ/kg crude protein, crude lipid, crude ash, moisture and gross energy, respectively. Experiment 8 was conducted using 11.0-11.4 mm diameter feed containing 56.5% crude protein, 14.6% crude lipid, 13.2% crude ash, 8.51% moisture and 17.4 MJ/kg gross energy.
In experiment 9 in the sub-adult stage of olive flounder, 13.0-13.4 mm diameter feed containing 58.1% crude protein, 13.2% crude lipid, 12.5% crude ash, 4.50% moisture and 17.3 MJ/kg gross energy was used. Experiment 10 was conducted using 15.0-15.4 mm diameter feed containing 56.0% crude protein, 14.3% crude lipid, 11.4% crude ash, 7.04% moisture and 17.6 MJ/kg gross energy.
>
Experimental fish and feeding trials
Fish for the feeding trials in the first stage of olive flounder were collected from Hampyeong, Cheonnam while those for the rest of the trials were obtained from Jeju-do, both in the Republic of Korea. Prior to start of the experiments, fish were fed the commercial diet twice daily to apparent satiation for a week to acclimate them to the experimental diet and conditions.
Twenty and fifteen fish with initial body weights of 4.97 ± 0.11 and 9.18 ± 0.13 g (mean ± SD) in experiment 1 (5 g) and experiment 2 (9 g) of the first stage of juvenile olive flounder, respectively were randomly distributed into each of 28 aquaria. Each aquarium was then randomly assigned to one of four replicates of 7 respective feeding rates: 0, 3.0, 4.0, 4.25, 4.5, 4.75 and 5.52 (satiation)% body weight (BW)/day in experiment 1 and 0, 2.0, 3.0, 3.5, 4.0, 4.5 and 4.64 (satiation)% BW/day in experiment 2. Fish were fed three times a day (7:00, 13:00 and 19:00 h). The feeding trials were conducted by using a semi-recirculating system with twenty-eight 40-L rectangular aquaria receiving filtered seawater at the rates of 0.8 and 1.0 L/min in experiment 1 and experiment 2, respectively from the center tank.
In the second stage of juvenile olive flounder fifteen fish with initial body weights of 20.2 ± 0.54, 29.8 ± 0.52, 40.4 ± 0.69 and 50.2 ± 0.46 g (mean ± SD) in experiment 3 (20 g), experiment 4 (30 g), experiment 5 (40 g) and experiment 6 (50 g), respectively were randomly distributed into each of 18 aquaria. Each aquarium was then randomly assigned to one of three replicates of 6 respective feeding rates: 0, 1.0, 2.0, 3.0, 3.5 and 4.12 (satiation)% BW/day in experiment 3; 0, 1.0, 2.0, 2.6, 3.2 and 3.53 (satiation)% BW/day in experiment 4; 0, 1.0, 2.0, 2.4, 2.8 and 3.04 (satiation)% BW/day in experiment 5; and 0, 1.0, 1.5, 2.0, 2.5 and 2.73 (satiation)% BW/day in experiment 6. Fish were fed three times a day (8:00, 12:00 and 18:00 h). The feeding trials were conducted by using a flowthrough system with eighteen 50, 100, 150 and 150 L aquaria in experiment 3, experiment 4, experiment 5 and experiment 6, respectively receiving filtered seawater from the center tank.
For the growing olive flounder, twenty fish with initial body weights of 240.4 ± 11.01 and 316.7 ± 6.18 g (mean ± SD) in experiment 7 (240 g) and experiment 8 (317 g), respectively were randomly distributed into each of 10 aquaria. Each aquarium was then randomly assigned to one of duplicates of 5 respective feeding rates: 0, 0.5, 0.75, 1.0 and 1.25 (satiation)% BW/day in experiment 7; and 0, 0.4, 0.6, 0.8 and 1.0 (satiation)% BW/day in experiment 8. Fish were fed twice a day (9:00 and 16:00). Each feeding trial was conducted by using a flow-through system with ten 1 metric ton aquaria receiving filtered seawater from the center tank.
The feeding trials in the sub-adult stage were conducted with twenty-seven and thirty fish with initial body weights of 384.2 ± 5.91 and 525.37 ± 7.12 g (mean ± SD) in experiment 9 (384 g) and experiment 10 (525 g), respectively. In each experiment fish were randomly distributed into each of 10 aquaria. Each aquarium was then randomly assigned to one of duplicates of 5 respective feeding rates: 0, 0.3, 0.5, 0.7 and 0.9 (satiation)% BW/day in experiment 9; and 0, 0.2, 0.4, 0.6 and 0.8 (satiation)% BW/day in experiment 10. Fish were fed twice a day (9:00 and 16:00). Each feeding trial was conducted by using a flow-through system with ten 1 metric ton aquaria receiving filtered seawater from the center tank.
Each daily ration was divided into portions according to the feeding frequency in each trial. For satiation feeding, an excess amount of feed was weighed out daily and fish were fed as much as they would ingest (within 20 min) at each feeding time. Feeding was done slowly and carefully to ensure total ingestion of feed. The remaining feed was weighed and its weight subtracted from the initial weight.
Total body weight in each aquarium was determined every week and the amount of diet fed to the fish was adjusted accordingly in each trial. All the experimental aquaria were maintained at 14:10 (light:dark) and 12:12 (light:dark) in the first and second juvenile stages, respectively while the aquaria in the growing and sub-adult stages were maintained at natural light. The seawater was maintained at 20 ± 1℃ by heaters in the center tank in the juvenile stages while in the growing and sub-adult stages the seawater temperature was 22 ± 2℃ during the whole experimental period (Iwata et al. 1994). Supplemental aerations were provided to maintain dissolved oxygen levels near 6.5 ± 0.5 ppm and the salinity was 33 ± 1 ppt in all experiments. The duration of the experiments in the two stages of juvenile olive flounder was 2 weeks while the trials in the growing and sub-adult stages lasted for 3 weeks.
>
Sample collection and analysis
Weight gain (WG), specific growth rate (SGR), feed efficiency (FE), protein efficiency ratio (PER), survival and whole-body proximate composition were calculated and measured at the end of the feeding trials. Blood analyses were also carried out on fish in the second juvenile, growing and sub-adult stages, as fish in the first juvenile stage were too small for blood to be obtained easily. Hematocrit (packed cell volume; PCV), hemoglobin (Hb), glutamic oxaloacetic transaminase (GOT), glutamic pyruvic transaminase (GPT), blood glucose and serum total protein were determined. Blood samples were obtained from the caudal vessels by using a heparinized syringe. Hematocrit was determined from three fish per aquarium using the microhematocrit method (Brown, 1980) and hemoglobin (Hb) was measured in the same three fish by the cyanmethemoglobin procedure using Drabkin’s reagent. An Hb standard prepared from human blood (Sigma Chemical, St Louis, MO, USA) was used. Three fish from each aquarium were used to analyze whole-body proximate composition. Proximate composition analyses of experimental diets and fish body were performed by the standard methods of AOAC (1995). Samples of diets and fish were dried to a constant weight at 105℃ to determine moisture content. Ash was determined by incineration at 550℃; crude lipid by soxhlet extraction using Soxtec system 1046 (Foss, Hoganas, Sweden) and crude protein by Kjeldahl method (N×6.25) after acid digestion.
Clinical signs of fish were carefully monitored daily throughout this experiment. At the end of the feeding trial fish were autopsied and processed for histological examination. Autopsies were carried out on three randomly selected fish from each tank. All tissues and organs obtained were fixed in Bouins solution and processed for a routine histological examination.
All data were analyzed by one-way ANOVA (Statistix 3.1, Analytical Software, St. Paul, MN, USA) to test for the dietary treatments. When a significant treatment effect was observed, a least significant difference (LSD) test was used to compare means. Treatment effects were considered significant at the
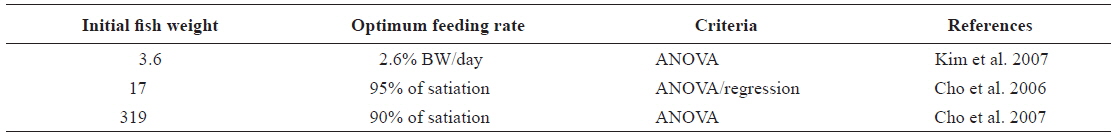
Weight gain and feed efficiency of fish in all the feeding trials are presented by the growth stages below. Growth performance (weight gain, specific growth rate, feed efficiency, protein efficiency ratio and survival), whole-body proximate composition, serological characteristics and histological observation were calculated, measured and observed in all growth stages (except for serological characteristics in the first juvenile stage) of fish. However, for clarity and conciseness only weight gain and feed efficiency are included in this review. Full results can be seen in articles on individual growth stages of fish such as in Okorie et al. (2013). Optimum feeding rates in this species in previous studies are presented in Table 2 and compared with our findings below.
[Table 2.] Optimum feeding rates in olive flounder Paralichthys olivaceus in previous studies

Optimum feeding rates in olive flounder Paralichthys olivaceus in previous studies
>
Optimum feeding rates for the first stage (5 and 9 g) of juvenile olive flounder
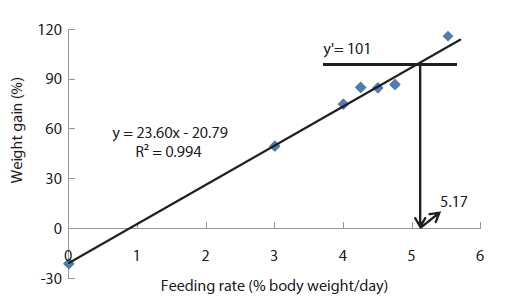
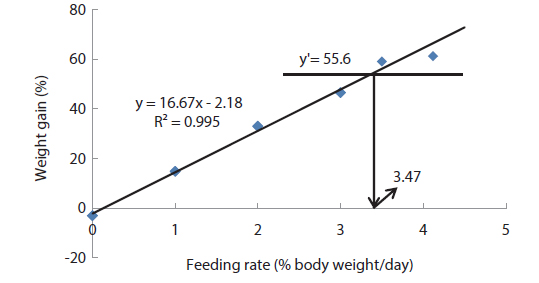
At the end of two weeks of feeding trial in experiment 1, weight gain (WG) of fish fed at 5.52 (satiation)% body weight (BW)/day was significantly higher than those of fish fed at 0 (unfed), 3.0, 4.0, 4.25, 4.5 and 4.75% BW/day (
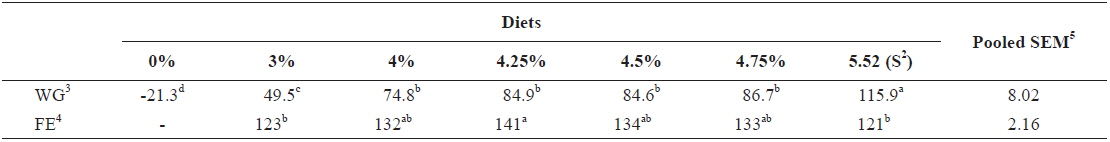
Effects of feeding rates on growth performance of 5 g juvenile olive flounder Paralichthys olivaceus1
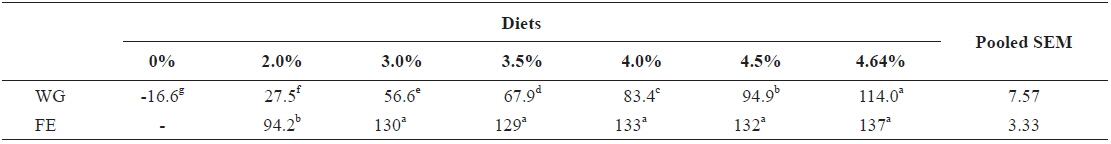
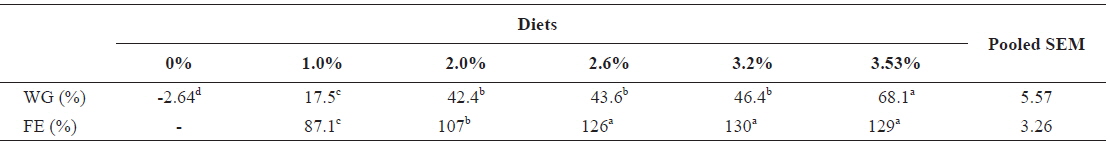
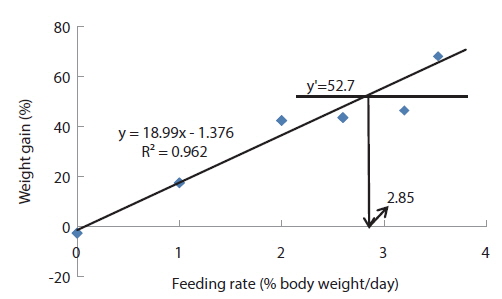
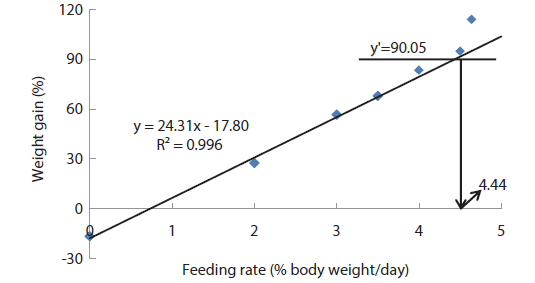
In experiment 2, WG of fish fed at 4.64 (satiation)% BW/day was significantly higher than those of fish in the other treatments (Table 4). This parameter progressively increased, being significantly higher for each treatment than for the preceding one. Feed efficiency of fish fed at 2.0% BW/day was significantly lower than values for all the other fed fish. However, there were no significant differences in FE among fish fed at 3.0, 3.5, 4.0, 4.5 and 4.64% BW/day. Broken line analysis of weight gain showed that the optimum feeding rate in 9 g olive flounder could be 4.44% BW/day (Fig. 2).

Effects of feeding rates on growth performance of 9 g juvenile olive flounder Paralichthys olivaceus
>
Optimum feeding rates for the second stage (20, 30, 40 and 50 g) of juvenile olive flounder
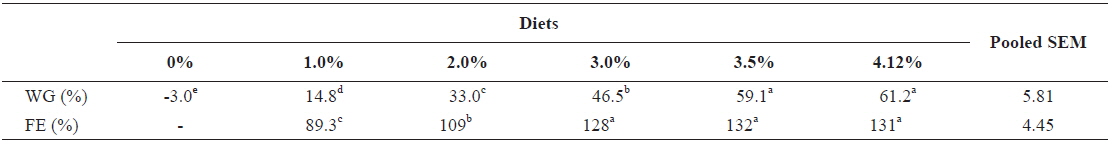
Weight gain and FE of 20 g juvenile olive flounder,

Effects of feeding rates on growth performance of 20 g juvenile olive flounder Paralichthys olivaceus
Table 6 shows growth parameters of 30 g juvenile olive flounder,

Effects of feeding rates on growth performance of 30 g juvenile olive flounder Paralichthys olivaceus
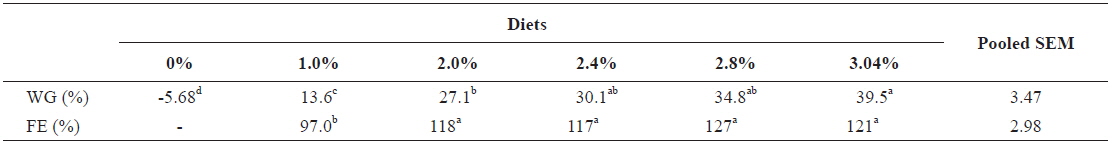
Growth parameters of 40 g juvenile olive flounder,

Effects of feeding rates on growth performance of 40 g juvenile olive flounder Paralichthys olivaceus
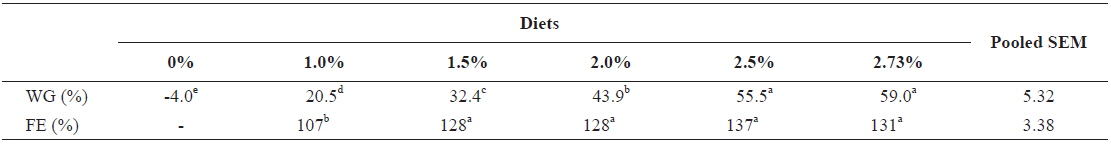
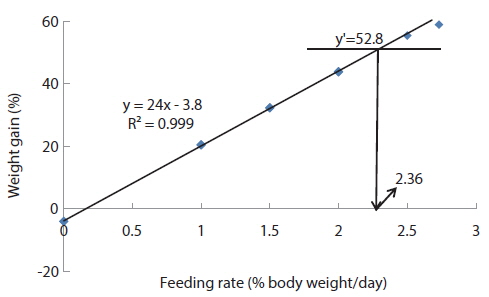
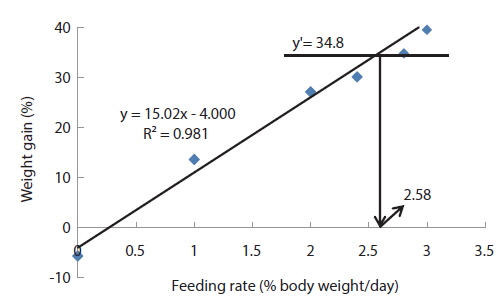
In experiment 6, WG of fish fed at 2.5 and 2.73 (satiation)% BW/day were significantly higher than those of fish in the other treatments (Table 8). This parameter increased with feeding rate for other treatments, being significantly higher at each feeding rate than the preceding one. Values of FE for the fed fish were not significantly different except for fish fed at 1.0% BW/day, which was significantly lower than values for other treatments. The optimum feeding rate in 50 g juvenile olive flounder was estimated to be about 2.36% BW/day based on broken line analysis of WG (Fig. 6).

Effects of feeding rates on growth performance of 50 g juvenile olive flounder Paralichthys olivaceus
>
Optimum feeding rates for growing (240 and 317 g) olive flounder
Weight gain and FE of 240 g growing olive flounder,
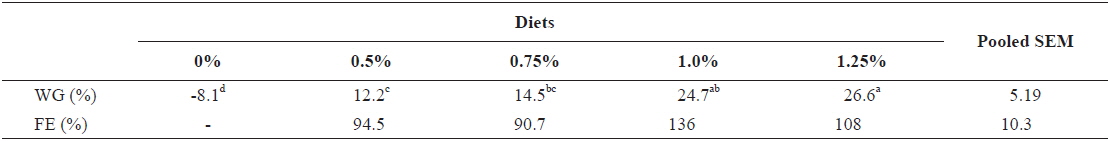
Effects of feeding rates on growth performance of 240 g growing olive flounder Paralichthys olivaceus
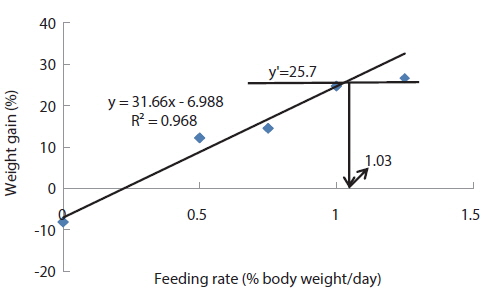
Growth performance of 317 g growing olive flounder,
Effects of feeding rates on growth performance of 317 g growing olive flounder Paralichthys olivaceus
>
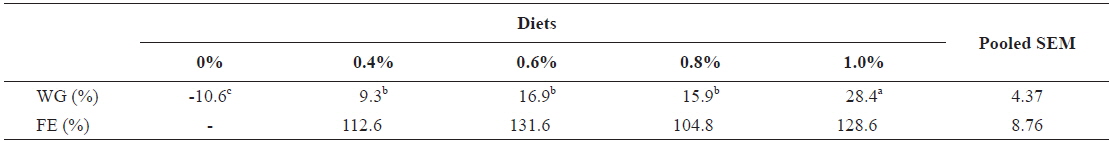
Optimum feeding rates for sub-adult (384 and 525 g) olive flounder
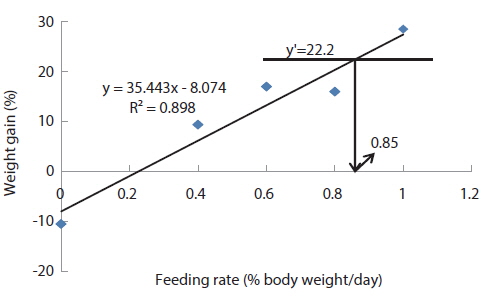
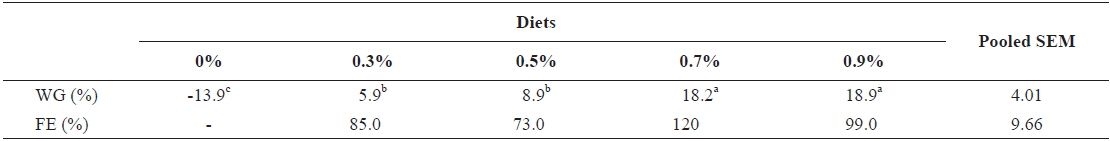
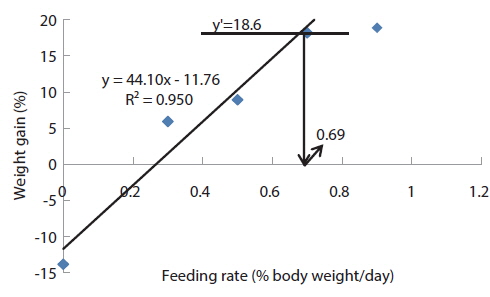
At the end of the 3 weeks of feeding trial, WG of fish fed at 0.7 and 0.9 (satiation)% BW/day were significantly higher than those of fish fed at 0 (unfed), 0.3 and 0.5% BW/day in experiment 9 (Table 11). Weight gain of the unfed fish was negative and significantly lower than those of fish fed the experimental diet at all feeding rates. There were no significant differences in WG among fish fed at 0.3 and 0.5% BW/day and among those fed at 0.7% BW/day and satiation. There were no significant differences in FE of fish in all treatments. The optimum feeding rate in 384 g sub-adult olive flounder,

Effects of feeding rates on growth performance of 384 g sub-adult olive flounder Paralichthys olivaceus
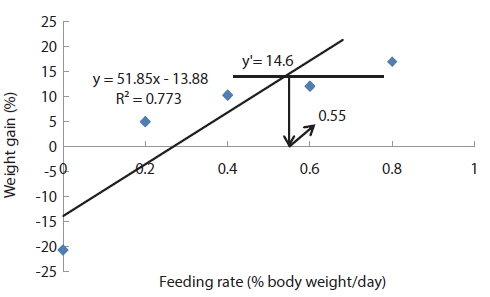
In experiment 10 (Table 12), WG of fish fed at 0.8 (satiation)% BW/day was significantly higher than those of fish fed at 0 (unfed) and 0.2% BW/day. There were no significant differences in WG among fish fed at 0.2, 0.4 and 0.6% BW/day and among those fed at 0.4, 0.6 and 0.8% BW/day. Weight gain of the unfed fish was negative and significantly lower than those of fish fed the experimental diet at all feeding rates. There were no significant differences in FE of fish in all treatments. Broken line analysis of WG indicated the optimum feeding rate in 525 g sub-adult olive flounder,
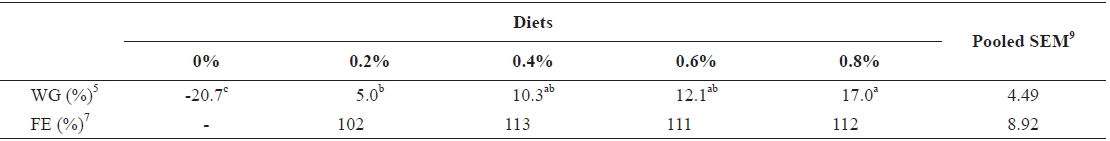
Effects of feeding rates on growth performance of 525 g sub-adult olive flounder Paralichthys olivaceus
In the above series of feeding trials we determined the optimum feeding rates at various growth stages of olive flounder at the optimum rearing temperatures using commercial feed. Representative sizes of fish were selected to cover the various growth stages, including the juvenile, growing and subadult stages. Proximate composition of the commercial feed used for the feeding trials was similar to the one used in a similar study by Iwata et al. (1994) in this species. Water temperatures of 20 ± 1°C for the juvenile stages and 22 ± 2°C for the growing and sub-adult stages were within the range of 20 and 25℃ suggested by Iwata et al. (1994) as the optimum temperature for the growth of olive flounder.
Feeding rate affected growth performance in all the feeding trials. Similar to previous findings in other species (De Silva et al., 1986; Hung and Lutes, 1987; Xiao-Jun and Ruyung, 1992; Adebayo et al., 2000; Ng et al., 2000; Mihelakakis et al., 2002), weight gain of olive flounder improved with feeding rate in all the feeding trials in this series. Continuous increase in weight gain with feeding rate has been recorded in blackspot seabream,
Feed utilization on the other hand leveled out or peaked and dropped after a certain feeding rate in almost all the feeding trials. This could be seen from the peak in feed efficiency for fish fed at 4.25% BW/day and the drop after the peak in this parameter in the 5 g fish. Maximum feed efficiency has been reported to be achieved at feeding rates below that required for maximum growth (Andrews, 1979; Brett and Groves, 1979). At low feeding rates, fish tend to optimize their digestion to extract nutrients more efficiently (Zoccarato et al., 1994; Van Ham et al., 2003). This implies an inverse relationship between feeding rate and feed efficiency after a peak. The peak in feed efficiency in the present study could be explained on the basis of greater weight gain than the incremental feed intake at feeding rates below the peak value. But beyond the peak fish could not efficiently utilize the additional food, leading to the drop in feed efficiency.
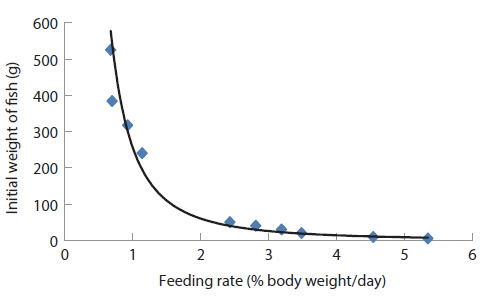
Comparing the optimum feeding rates in the different growth stages, it could be seen that the optimum feeding rates decreased with fish size (Fig. 11 and Table 13). This observation agrees with results in previous studies in various species (Page and Andrews, 1973; Skalli et al., 2004; Hatlen et al., 2005; Sweilum et al., 2005). The optimum feeding rate for 30 g white sturgeon,
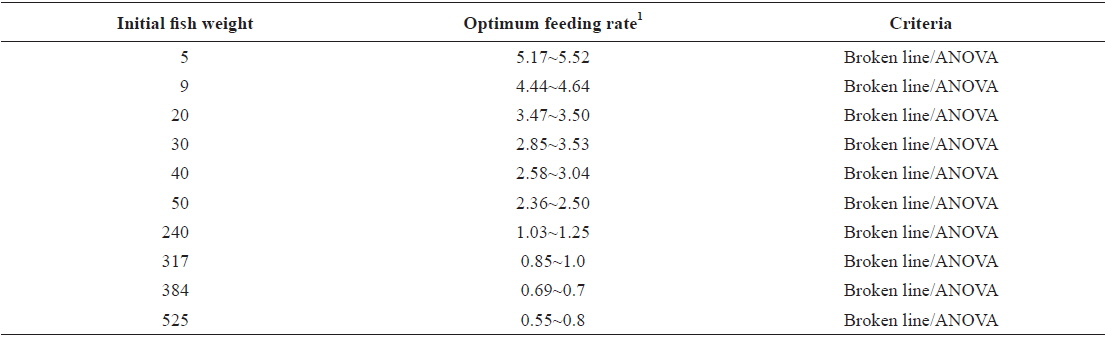
Optimum feeding rates in olive flounder Paralichthys olivaceus in the current feeding trials
The optimum feeding rates of >5.17 but <5.52, >4.44 but <4.64, and >3.47 but <3.50% BW/day obtained in 5, 9 and 20 g juvenile olive flounder, respectively in these feeding trials are higher than the 2.6% BW/day in 3-18 g fish in a previous study in this species (Kim et al., 2007). It is hard to explain the higher feeding rates in the current trials compared to the value in the earlier study, but by physical observation, fish were underfed at our first two feeding rates of 3 and 4% BW/day for 5 g and of 2 and 3% BW/day for 9 g fish, suggesting that the optimum feeding rates for these two sizes could be higher than the values reported by Kim et al. (2007). The optimum feeding rates of >0.85 but <1.0 % BW/day for 317 growing olive flounder as well as >0.69 but <0.7 and >0.55 but <0.8% BW/day for 384 g and 525 g sub-adult fish, respectively are lower than 1.5-2.0% BW/day for 250-500 g white sturgeon,
In conclusion, based on ANOVA and broken line analysis of WG the optimum feeding rates in 5, 9, 20, 30, 40 and 50 g juvenile olive flounder,