The effects of food deprivation and feeding ratio on the growth, feed utilization and body composition of juvenile olive flounder Paralichthys olivaceus were investigated in 810 juvenile fish averaging 6.4 g in weight randomly distributed in 27 400-L flow-through tanks. A 3 [food deprivation: 8-week feeding without food deprivation (8W), 7-week feeding after 1-week food deprivation (7W) and 6-week feeding after 2-week food deprivation (6W)] × 3 (feeding ratio: 100%, 95% and 90% of satiation, hereafter denoted by 100, 95 and 90, respectively) factorial design was applied. The weight gain of the fish was significantly affected by both food deprivation and feeding ratio. The weight gain of the fish under the 8W-100 treatment was higher than that of those under the 7W-95, 7W-90, 6W-100, 6W-95 and 6W-90 treatments, but did not differ from those of fish under the 8W-95, 8W-90 and 7W-100 treatments. The specific growth rate (SGR) and the feed intake of the fish were affected by both food deprivation and feeding ratio. However, the feed conversion ratio (FCR) was unaffected by both food deprivation and feeding ratio. The protein efficiency ratio (PER) was affected by the feeding ratio, but not by food deprivation. The protein retention (PR) was affected by food deprivation, but not by feeding ratio. Juvenile olive flounder subjected to 1-week food deprivation at 100% satiation (7W-100 treatment) achieved full compensatory growth.
Olive flounder
The possibility of compensatory growth in fish varies depending on fish size and age (Bilton and Robins, 1973), feeding protocol (Reigh et al., 2006; Huang et al., 2008; Cho and Cho, 2009; Abolfathi et al., 2012; Cho, 2012), feed nutrients (Gayloard and Gatlin, 2001; Cho and Heo, 2011; Cho, 2012), duration of the feeding trial (Heide et al., 2006), and water temperature (Cho, 2005; Cho et al., 2006a). Juvenile olive flounder subjected to 2-week feed deprivation were able to achieve full compensatory growth in the 8-week trials (Cho, 2005; Cho et al., 2006a). Similarly, Huang et al. (2008) reported that olive flounder subjected to low temperatures (8.5, 13 and 17.5°C) and high temperature (26.5°C) for 10 days and then grown at 22°C for 30 days achieved full compensatory growth compared to fish grown at 22°C for 40 days.
Turbot
Determination of the optimum feed allowance is a critical factor affecting fish performance and total feed cost (Cho et al., 2006b, 2007; Kim et al., 2007). The optimum daily feeding ratio for juvenile and subadult olive flounder averaging 17- and 319-g body weight were reported to be 95 and 90% satiation, respectively, when fish were fed diets to satiation twice daily (Cho et al., 2006b, 2007). Thus, both feeding regime and feeding ratio can affect fish production and feed efficiency.
In this study, the effects of food deprivation and feeding ratio on the growth, feed utilization and body composition of juvenile olive flounder were determined.
>
Fish and experimental conditions
Juvenile olive flounder were purchased from a private hatchery, transferred into the laboratory and acclimated for 1 week before initiation of the feeding trial. During the acclimation period, the fish were fed daily with a commercial flounder feed (Suhyupfeed, Korea) containing 54% crude protein and 11% crude lipid at a ratio of 2.5-3% body weight. Eight hundred and ten fish (with an initial body weight of 6.4 g) were randomly distributed in 27 400-L flow-through tanks (water volume: 300 L) (30 fish per tank). The flow rate of water into each tank was 10 L/tank/min. The water source was sand-filtered natural seawater, and aeration was supplied to each tank. The water temperature was monitored daily and ranged from 12.0 to 22.5°C (mean ± SD: 17.1 ± 1.40°C), and the photoperiod followed natural conditions.
A 3 [food deprivation: 8-week feeding without food deprivation (8W), 7-week feeding after 1-week food deprivation (7W) and 6-week feeding after 2-week food deprivation (6W)] × 3 (feeding ratio: 100%, 95% and 90% of satiation, denoted by 100, 95 and 90, respectively) factorial design was applied. A feeding ratio of 95 and 90% satiation was calculated daily based on the mean feed consumption of the fish under 100% satiation treatment, in which the fish voluntarily consumed as much as they could, under each feeding regime. The experimental diet (Table 1) was prepared to satisfy the dietary nutrient requirements of olive flounder (Lee et al., 2000a, 2002). The ingredients of the experimental diet were well mixed with water at a ratio of 3:1 and pelletized using a pellet-extruder. The diet was dried at room temperature overnight and stored at -20°C until use. At the end of the experiment, the fish were starved for 1 d and then fish in each tank were collectively weighed.
[Table 1.] Ingredients and chemical composition (%, DM basis) of the experimental diet
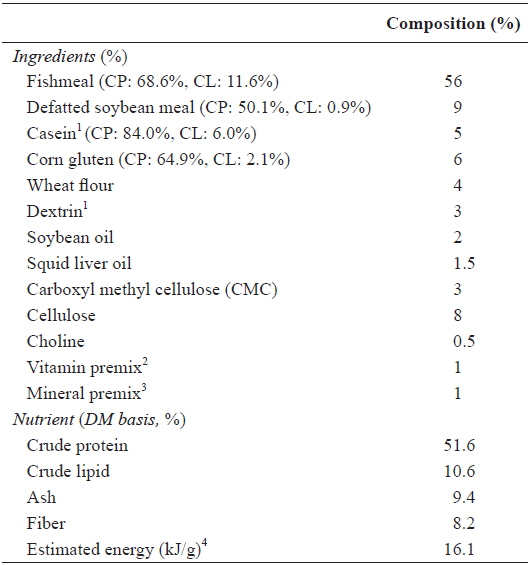
Ingredients and chemical composition (%, DM basis) of the experimental diet
From each tank, 10 fish at initiation and 5 fish at termination of the feeding trial were sampled and killed for proximate analysis. The crude protein was determined by the Kjeldahl method (Kjeltec 2100 Distillation Unit, Foss Tecator, Hoganas, Sweden), crude lipids were determined using an etherextraction method (Soxtec TM 2043 Fat Extraction System, Foss Tecator, Sweden), moisture was determined by oven drying at 105°C for 24 h, fiber was determined using an automatic analyzer (Fibertec, Tecator, Sweden), and ash was determined using a muffle furnace at 550°C for 4 h; all methods were according to standard AOAC (1990).
>
Calculations and statistical analysis
The following variables were calculated: specific growth rate (SGR) = (Ln final weight of fish – Ln initial weight of fish) × 100/number of days of feeding, feed conversion ratio (FCR) = feed intake/weight gain of fish, protein efficiency ratio (PER) = weight gain of fish/protein consumed, protein retention (PR) = protein gain of fish/protein consumed, condition factor (CF) = body weight (g)/total length (cm)3, hepatosomatic index (HSI) = liver weight (g)/body weight (g).
Two-way ANOVA was used to compare the effects of feeding regime and feeding ratio on the performance, feed utilization and biochemical composition. When a significant effect was found, a Duncan's multiple range test (Duncan, 1955) for multiple comparisons of means was performed. All statistical analyses were conducted using SAS version 9.3 (SAS Institute, Cary, NC, USA).
The survival of olive flounder, which ranged from 97.8% to 100%, was not affected by either food deprivation or feeding ratio (Table 2). However, the weight gain (g/fish) of the fish was significantly affected by both food deprivation (
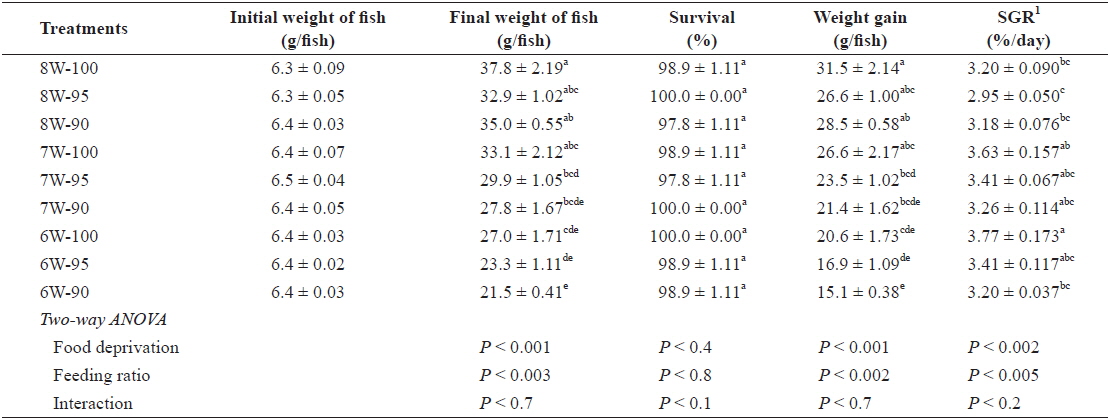
Survival (%), weight gain (g/fish) and specific growth rate (SGR) of olive flounder Paralichthys olivaceus fed the experimental diet at different food deprivation and feeding ratio
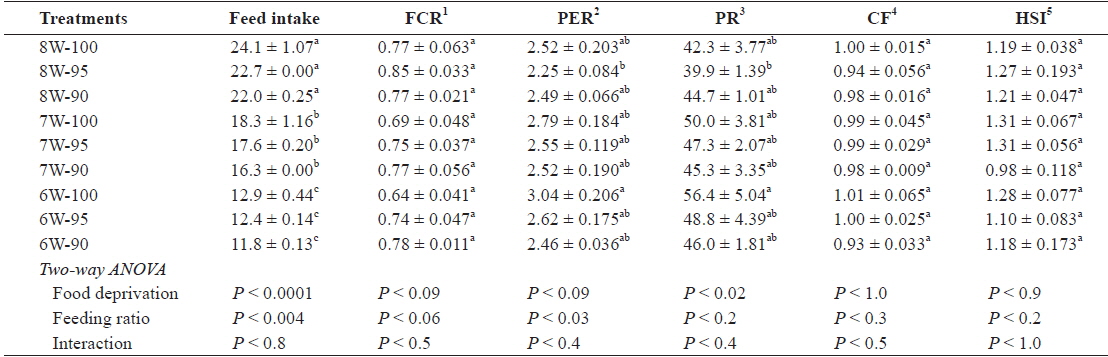
The feed intake (g/fish) was significantly affected by both food deprivation (

Feed intake (g/fish), feed conversion ratio (FCR), protein efficiency ratio (PER), protein retention (PR), condition factor (CF) and hepatosomatic index (HSI) of olive flounder Paralichthys olivaceus fed the experimental diet at different food deprivation and feeding ratio
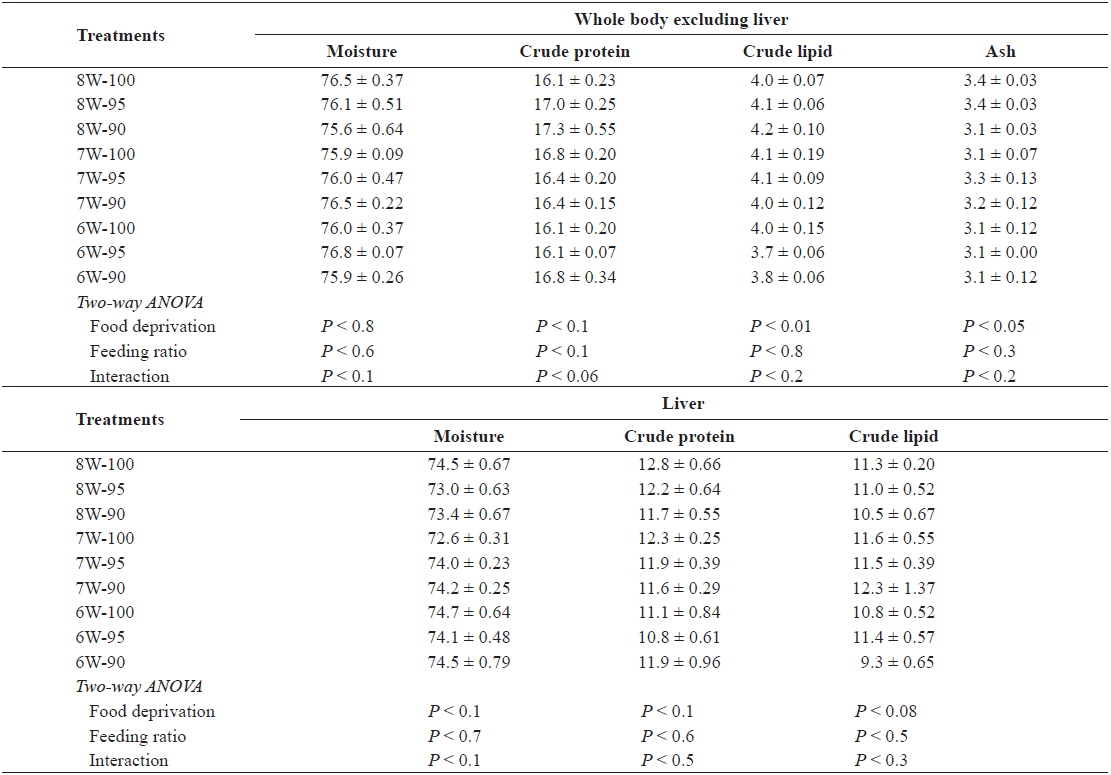
The whole-body moisture and crude protein excluding the liver, and the moisture, crude protein and crude lipid content of the liver in the olive flounder was not significantly affected by either food deprivation or feeding ratio (Table 4). However, the whole-body crude lipid and ash content excluding the liver was significantly affected by food deprivation (
Chemical composition (%, wet weight basis) of the whole body excluding liver and liver in olive flounder Paralichthys olivaceus fed the experimental diet at different food deprivation and feeding ratio
The weight gain of the olive flounder tended to decrease with decreasing number of weeks of feeding at the same feeding ratio. No significant difference in weight gain between the 8W-100 and 7W-100 treatments probably indicates that the fish subjected to 1-week food deprivation were able to fully compensate compared to those fed daily for 8 weeks. The difference in the ability of the olive flounder to achieve full compensatory growth between this study (of fish with an initial body weight of 6. 4 g) and our earlier studies (Cho, 2005; Cho et al., 2006a), which showed that juvenile fish (with an initial body weight of 16 g and 53.8 g) were able to achieve full compensatory growth with up to 2-week food deprivation in 8-wk trials can be explained by the fact that the smaller fish may be more susceptible to food deprivation, which is in agreement with the findings of Bilton and Robins (1973).
No significant difference in the weight gain for different feeding ratios under the 8-weeks feeding treatment (8W-100, 8W-95 and 8W-90 treatments) indicated that the daily feeding ratio for the juvenile olive flounder could be lowered by up to 90% satiation with no adverse effects, partially agreeing with Cho et al. (2006b), who estimated the optimum daily feeding ratio for juvenile flounder to be 95% satiation when fish were fed commercial extruded pellets twice per day at various daily feeding ratios (100, 95, 90, 85, 80, 75 and 70% satiation). Although no significant difference was observed within the same food deprivation treatment, there was a trend toward increased weight gain and SGR of fish with higher feeding ratio.
Hyperphagia is a common phenomenon to explain how fish achieve compensatory growth after feed deprivation for a certain period of time (Saether and Jobling, 1999; Ali et al., 2003; Wu et al., 2003; Cho, 2005; Cho et al., 2006a; Heide et al., 2006; Kankanen and Pirhonen, 2009), but in our study, feed intake was lower under the 7W-100 treatment, in which the fish achieved full compensatory growth, compared to the fish under the 8W-100 treatment. Significantly less feed intake, but only slight and not significant weight gain under the 7W-100 treatment compared to the 8W-100 treatment probably suggests that farmers who wish to achieve compensatory growth in their fish should consider the balance between the price they can obtain for the fish they produce and the total feed cost.
Reigh et al. (2006) reported that channel catfish under 5 repetitive days of fasting followed by 14 days of satiation feeding (112-days feeding), or 10 days of fasting followed by 14 days of satiation feeding (97-days feeding) consumed 30 and 38% less than fish under 158 days of daily satiation feeding, but gained 24 and 29% less weight, respectively, and they concluded that that feeding practices which incorporate repetitive periods of fasting and satiation feeding could provide economic benefits through reduced feed and labor costs. Saether and Jobling (1999) showed that turbot became hyperphagic and displayed compensatory growth after the change from daily restricted feeding (0.25 and 0.38% of body weight) to excess feeding (1% of body weight), with compensatory growth being most marked among the fish that had been subject to the most severe feed restriction.
The PER and PR of the fish under the 6W-100 treatment was higher than those of the fish under the 8W-95 treatment, but no different from those of the fish under all other treatments in our study. Similarly, other studies showed no significant improvement in the feed efficiency although the fish achieved full compensatory growth after food deprivation (Zhu et al., 2004; Cho et al., 2006a). The CF and HSI were not affected by food deprivation or feeding ratio in this study. Similarly, in other studies, biological indices, such as the CF and HSI were not affected by feeding regime (Cho et al., 2006a). Unlike our study, however, HSI was a suitable index of compensatory growth (Gaylord and Gatlin, 2000; Cho, 2005, 2012). Therefore, the use of the CF and HSI indices as indicators to determine the compensatory growth is still controversial. In a recent study, biological criteria, such as length that incorporates condition factor have been considered in characterizing the compensatory growth of fish (Bavcevic et al., 2010), but no difference in the digestive index or the intestinal surface areas of the fish were found (Abolfathi et al., 2012).
The whole-body moisture and crude protein excluding the liver, and the moisture, crude protein and crude lipid content of the liver in the olive flounder was not significantly affected by either food deprivation or feeding ratio in our study. Similarly, in other studies, there was no significant difference in the proximate composition of the fish under different feeding regimes (Cho et al., 2006a) or feeding ratios/feeding rates (Cho et al., 2007; Kim et al., 2007).
In conclusion, juvenile olive flounder subjected to 1-week feed deprivation at 100% satiation (7W-100 treatment) achieved full compensatory growth. The feed intake was affected by both food deprivation and feeding ratio. However, the PER was affected by feeding ratio, but not by food deprivation.