In the injection-molded light guide plate the replication quality, i.e. the reproduction accuracy, of micro-patterns should be high and uniform over the entire surface area. However technical difficulty in meeting the necessary replication quality arises as the plate size becomes large for TV applications. We propose a simulation technique to optimize the distribution of micro-patterns on a 55-inch injection molded light guide plate considering non-ideal replication quality of micro-patterns. The luminance uniformity could be improved by more than 16% by optimizing the pattern distribution in spite of the same replication quality.
Successful development of efficient backlight units has made it possible to expand the application of liquid crystal displays (LCD) to various fields including mobile devices and large-size TVs [1-11]. The light guide plate (LGP) is the most important optical component in the edge-lit backlight for LCD applications. Light-emitting diodes (LEDs) are usually used as light sources in the backlight. Edge-lit backlight technology has traditionally been applied to small- and medium-size LCDs, but recent development of large-size LGP has made it possible to fabricate very thin, efficient LCD TVs, which are commercially called “LED TVs”. Because of increase in the emitting power and efficiency of LEDs, the number of LEDs adopted in one edge-lit backlight has decreased continuously. In addition, many studies on the optimization of micro-patterns formed on LGPs have been reported, where the authors suggested various designs to improve the light-utilization efficiency and the luminance uniformity.
An extrusion or injection molding process has been used to fabricate plate-type LGPs. One of the important methods for fabricating large-size light guide for LED TV applications is the injection molding process. Recently, injection molding technology has attracted attention for improving the luminance property of large-size LGPs for LCD TV applications [12]. This is due to the fact that micro-patterns, such as micro-prisms, can be formed on LGPs by injection molding. Various shapes of micro-prismatic pattern geometry have been applied to the light guide plate for achieving high luminance. When the injection molding is used to fabricate micro-patterned LGPs, it is desirable to reproduce the accurate shape of the mold on the LGP having the high “replication quality” because poor micro-patterns can seriously deteriorate the on-axis luminance distribution on the LGP. Several groups have studied to design new injection molding processes in order to improve the replication quality of LGPs.
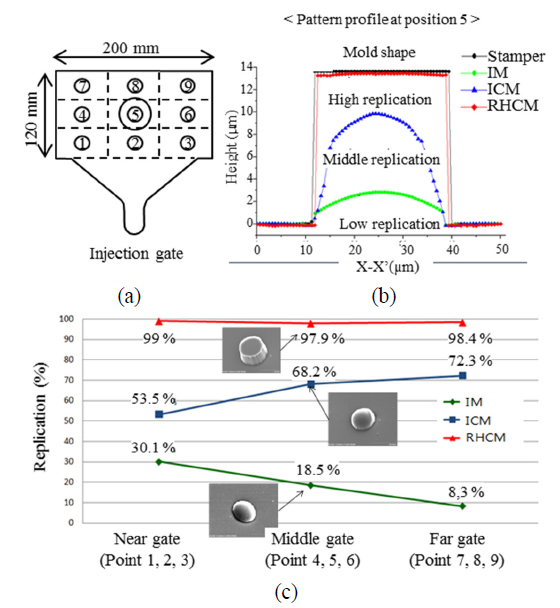
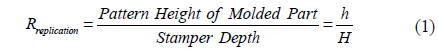
Several injection molding technologies have been used to fabricate patterned LGPs, for example, general injection molding (IM), injection compression molding (ICM), and rapid heat compression molding (RHCM) technologies. Figure 1 shows the measured replication quality of a small-size LGP with dimensions of 120 × 200 × 4 mm3, which was fabricated via the three injection molding processes by using a micro-cavity type mold. The numerical value for the degree of replication, denoted as
In previous optical designs of backlights, the ideal micro-patterns were usually assumed over the whole area of the LGP. The arrangement of the micro-patterns, such as density and/or size, formed on the backside of the LGP was adjusted to meet the uniformity quality. In the case of the fabricated LGP, the replication quality is not ideal, which is the main reason for the difference in the optical properties between the prediction by optical simulation and the measurement from the real LGP. This suggests that the replication quality on the LGP should be considered and reflected in the optimization process of the optical design of LGPs for large-size backlights. In this study, we will suggest a design method for optical patterns on large-size LGPs considering the replication quality depending on the detailed micro-shape of the pattern and the injection molding process. For this purpose, positional dependence of the replication quality
II. MEASUREMENT OF REPLICATION QUALITY
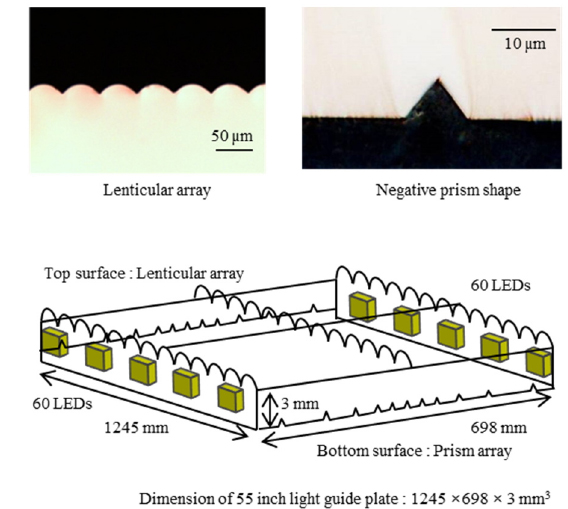
In this section, the measurement method for the replication quality of micro-patterns is introduced. Figure 2 shows a schematic figure of the 55-inch light guide plate investigated in this study. The dimensions are 1245 × 698 × 3 mm3, and total 120 LEDs were attached on two edges. A lenticular lens array with a pitch of 50 μm was formed on the upper surface pitch, while one-dimensional prism patterns were engraved on the bottom surface. The width and the inclination angle were 10 μm and 50°, respectively, and the pitch was adjusted to satisfy the uniformity requirement.
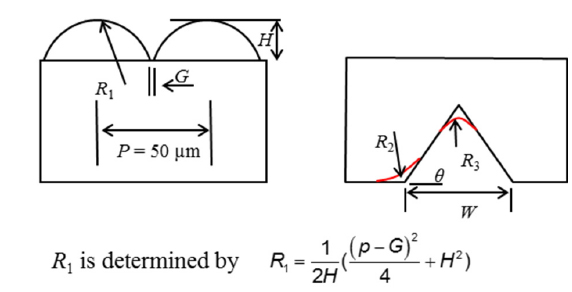
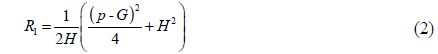
Based on the cross-sectional view of micro-patterns, we defined shape parameters of micro-patterns as shown in Fig. 3. The cross-section of lenticular lenses was assumed to be part of a semicircle. The radius of the semicircle
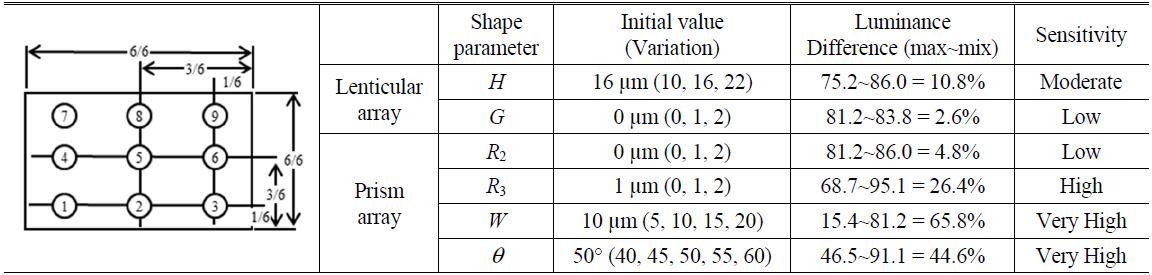
We carried out optical simulation for the LGP under various conditions to monitor the 9-point luminance uniformity. The inset of Table 1 shows the luminance measurement points on the LGP. Table 1 shows the simulation condition (initial value and the range of variation) and the difference between the maximum and the minimum luminance values obtained from the 9-point measurements. We can easily know that the height

Simulation conditions (initial value and the range of variation) of each shape parameter and the difference between the maximum and the minimum luminance values obtained from the 9 points. Sensitivity indicates the degree of effect of each shape parameter on the luminance uniformity. The inset figure shows the measurement points of luminance
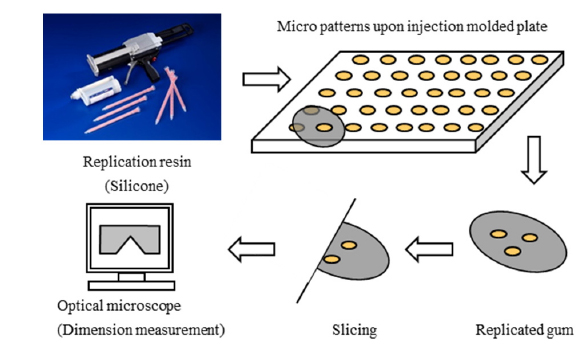
Figure 4 shows the measurement method of shape parameters of micro-patterns. Room-temperature-vulcanized silicone rubber (Repliset F5, Struers corp.) was used to cut out the pattern on a certain region on the 55-inch LGP. The replication error caused by using the silicon rubber is usually less than 1 μm. The vulcanized silicon gum was sliced and observed under the optical microscope. The shape parameters were determined by using shape-measurement software which was combined with the optical microscope.
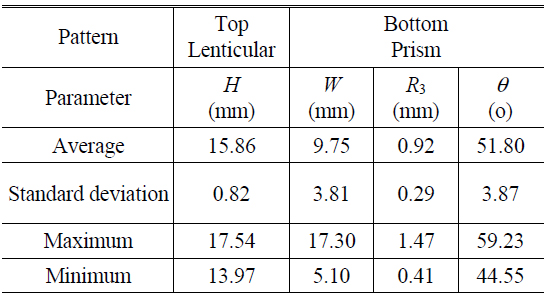
Table 2 shows the measurement results of the shape parameters

Measurement results of the shape parameters H, W, R3, and θ, that is, the average, the standard deviation, the maximum and the minimum values of each parameter


III. SIMULATION OF LIGHT GUIDE PLATE CONSIDERING REPLICATION MAP OF MICRO-PATTERNS
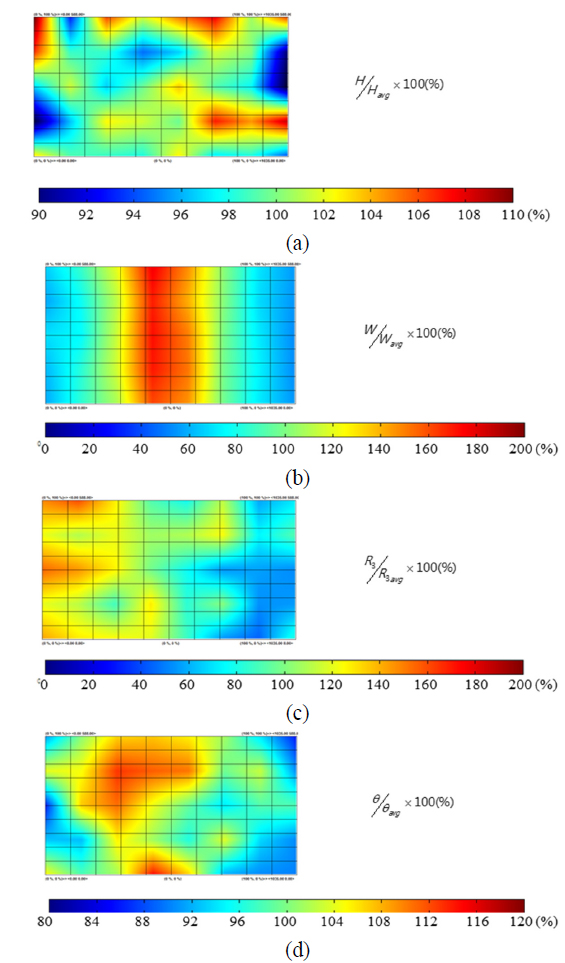
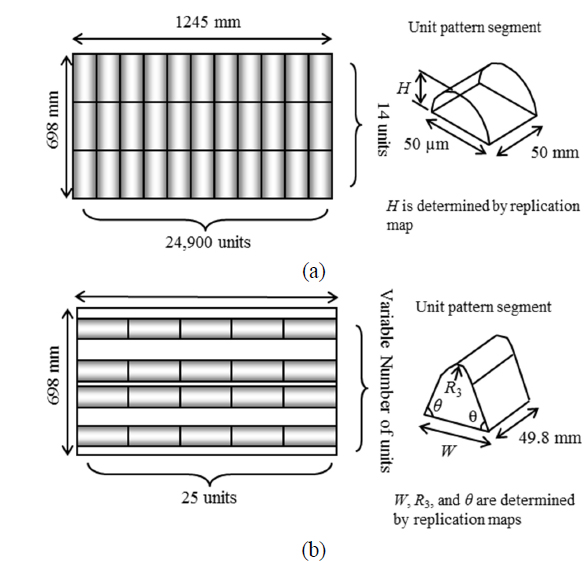
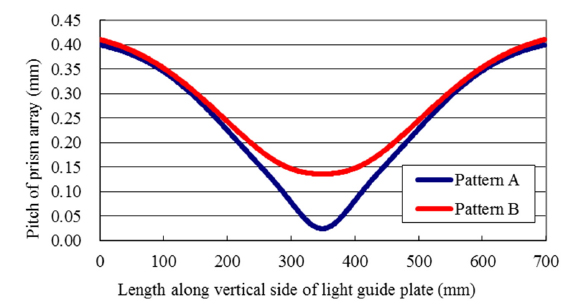
A 55-inch backlight model was constructed and used in the simulation to search for the right approach toward optimized optical design of light guide plates. Figures 6 (a) and (b) show the geometrical model of lenticular and prism array, respectively. The one-dimensional lenticular or prism lens was assumed to consist of unit pattern segments in the simulation. The unit pattern segment was defined according to the right figures of Fig. 6(a) and (b). The total number of segments is shown on the left side. At first, we assumed that the micro-patterns were ideal, that is, the replication quality was perfect, and carried out the optical simulation under this assumption. The 55-inch backlight model consisted of one LGP shown in Fig. 2, one reflection film (E6SV, Toray), one diffusion film (SD743, Shinhwa), and one prism film. The pitch variation of micro-prisms was optimized in the simulation by monitoring the 9-point luminance uniformity. The optimized pitch distribution is shown as a dark blue line denoted as (A) in Fig. 7. The simulated luminance distribution is shown in Table 3, and the calculated luminance uniformity is 81.2 %. As a next step, we included the measured, real replication quality, shown in Table 2, into the optical simulation under the same pitch distribution (A). In this case, the luminance uniformity decreased substantially down to 68.1 %. This degradation in luminance uniformity suggests that the simulation result obtained under the perfect replication quality cannot be used for optimization of micropatterns and that the replication quality should be considered in the optimization process of pattern distribution of large-size LGPs. In order to reflect the replication quality in the simulation, the shape parameters of the unit segment shown in Fig. 7 (
[TABLE 3.] Simulation conditions and the obtained luminance uniformity. See the text for details
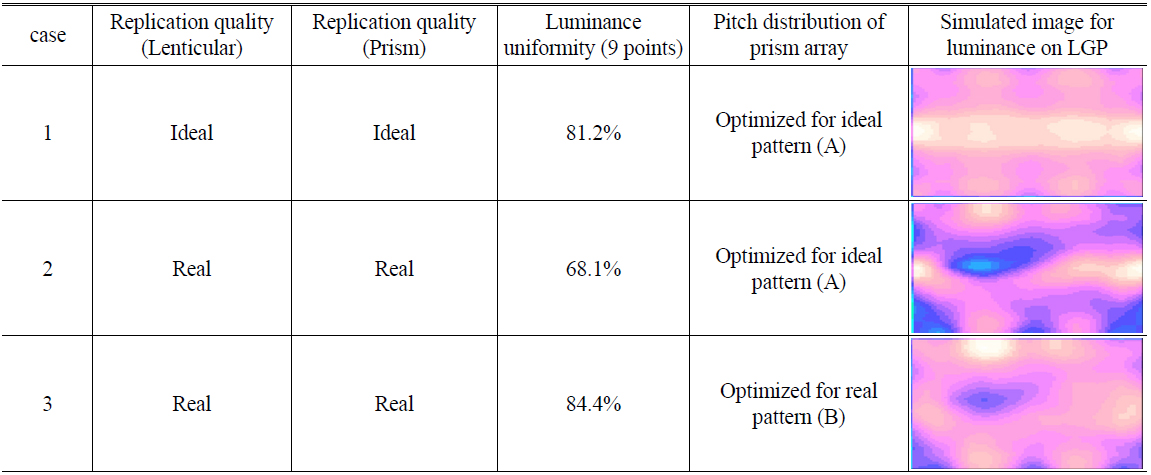
Simulation conditions and the obtained luminance uniformity. See the text for details
The prism pattern used in this study is one-dimensional. In this case, the design degree of freedom is only the pattern pitch. Therefore, it is difficult to improve the luminance uniformity along the direction parallel to the prism grooves. If the prism pattern is divided into many segments and if the pitch between the segments is optimized, better luminance uniformity will be achieved based on the proposed design approach.
We proposed an optical design method where the replication quality of large-size light guide plates could be implemented for improving luminance uniformity. Micro-lenticular and micro-prism arrays were formed on the top and the bottom surfaces of 55-inch light guide plate, respectively. The replication quality of the light guide plate fabricated by injection molding technology was measured by using silicone resin and an optical microscope, and replication maps were constructed for important shape parameters of lenticular and prism arrays. The prism pitch was optimized by optical simulation under the condition of perfect replication quality in order to maximize the luminance uniformity, which, however, decreased significantly once the measured replication quality was reflected in the optical modeling. The degraded luminance uniformity could be increased substantially by considering the measure replication map in the optical simulation. This study showed that the optical performances of large-size backlight could be improved by measuring and reflecting real replication quality of LGP into the optical modeling even though the replication quality is far from perfect.