Muscle vibration measurement has long been an unique scientific study, in general, and the direct reaction of animals to feel pain (algesia), either from vascular or muscle contraction, is a complex perceptual experience. Thus this paper proposes a way to measure animal algesia quantitatively, by measuring the changes in muscle vibration due to a pinprick on the surface of the skin of a Spodoptera litura larva. Using the laser optical triangulation measurement principle, along with a CMOS image sensor, linear laser, software analysis, and other tools, we quantify the subtle object point displacement, with a precision of up to μm, for our chosen Spodoptera litura larva animal model, in which it is not easy to identify the tiny changes in muscle contraction dynamics with the naked eye. We inject different concentrations of formalin reagent (empty needle, 12% formalin, and 37% formalin) to obtain a variety of different muscle vibration frequencies as the experimental results. Because of the high concentrations of reagent applied, we see a high frequency shift of muscle vibration, which can be presented as pain indices, so that the algesia can be quantified.
For an animal, algesia is a complex perceptual experience. Putting aside the cause of the algesia and the pathway of message transduction, mostly it is expressed by means of body twitching and muscle or vascular contraction, when an animal is subjected to certain external stimuli, and it cannot be expressed in words or actions of such unpleasant degree. Most experimental research on animal algesia is the observation of biological responses to pain, such as tail swinging, screaming, and twitching rates of limbs, but these behaviors are unstable and less objective measurements [1-11].
In previous studies, there have been many algesia experiments using acidic reagents to cause pain, and formalin has been found to have the strongest effect for causing feelings of pain in animals. For example, Rosland and Candelletti injected formalin into mice [12, 13]; Shima adapted it to cats [14]; Alreja chose primates [15]; Carli used rabbits [16]; Takahashi used guinea pigs in experiments [17]; Kanui used crocodiles [18]; Hughes focused on domestic fowl [19]; and Pelissier selected
Most previous studies used low concentrations of formalin, ranging from 10 to 15% [12-20]. Nonetheless, Oyadeyi considered that using lower formalin concentrations did not produce easily detectable responses [21], so he chose 37% formalin in his experiment. In our study we used two concentrations: We chose 12%, the average from 10 to 15% in previous papers, as our low concentration, and 37% as our high concentration, according to Oyadeyi’s research. The use of an optical measurement system in this paper proposes a way to measure animal algesia, using a CMOS image sensor, linear red laser optics, and the software analysis of the composition of the laser triangulation, as the measurement tools. We inject several different concentrations of formalin into our chosen animal model,
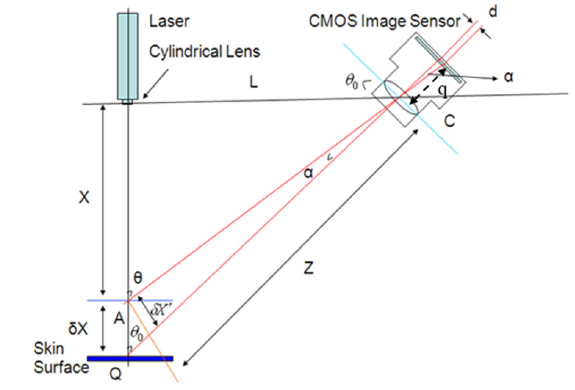
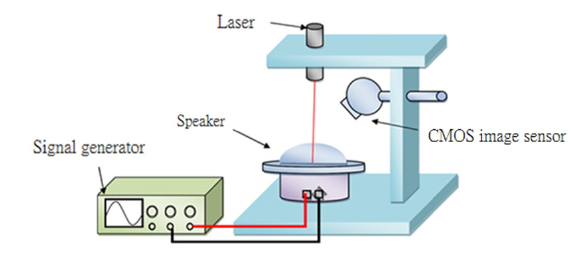
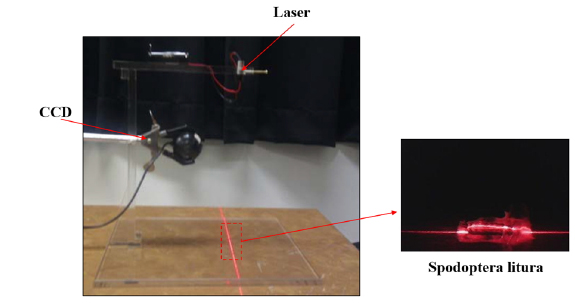
We use the laser optical triangulation technology, which is a noninvasive, noncontact measurement device for muscle vibration. The vibration information of a muscle can be obtained with this measurement system. An algorithm to evaluate the muscle vibration activities from the center of the laser spot intensity on a certain wrist point has been conducted by Fast Fourier Transform (FFT). The amplitude and frequency of muscle vibration can be read via this measurement system. The basic principle of the optical noncontact pain point measurement device is to project a spot of light onto a muscle surface, and then define the amplitude and frequency of muscle vibration by processing the scattered light. Our system adopts a simple structure based on laser optical triangulation, the geometrical layout is shown in Fig. 1, in which we define the following quantities.
Q is the intersection of the optical axis of the camera lens and the laser light axis. From Fig. 1 we learn that in ΔABQ,

Using similar triangles to replace equation (1),
In ΔABC,
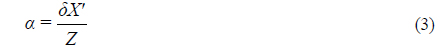
The geometry after the lens is
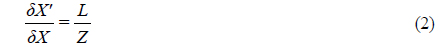
From equations (3) and (4) we see that
From equation (2) we see that and input (5) to obtain

From equation (6) we see that the shorter the tested distance, the higher the resolution, and is a constant, so
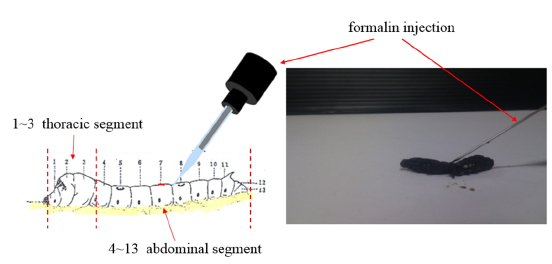
We can analyze the image on the CMOS sensor to obtain the muscle vibration amplitude. By setting a threshold level, any pixel with an intensity below that level will be neglected. The threshold gray level was set to 80% at the highest level in these experiments. The centroid method has been widely used to locate a light spot on image features of various types, to subpixel accuracy. By introducing subpixel processing, the resolution of this system can be increased. The intensity of the

After using FFT (Fast Fourier Transform) on the waveform of the algesia point variation, we obtain the spectrum in frequency space, from which we can extract the peak frequency,
2.2. Materials and Sample Preparation
We selected as our biological model the cutworm
2.3. Experimental Methods and Procedures
In this study we chose a red diode laser modulewith a wavelength of 635-680 nm and an output power of 3 mW; in the part of the CMOS image sensor, its image resolution is 1280×720 pixels and the shooting speed is 30 frames/second.
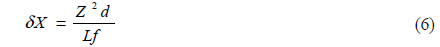
The experimental framework is set up with a fixed optical laser line by the cylindrical lens of the laser light source, and the object to be tested is placed in the line of the laser. Therefore, during measurement the subject must stay within the scope of the laser line, which is the only region that can be measured; even though the synthetic rubber resin was used to fix the abdomen of the larva, its head and tail struggled severely and nonetheless occasionally deviated from the laser line. Only the larval body section in the middle part of the abdomen (the 7th somite of the body, for larvae of 13 somites) struggled relatively moderately, such that it would not deviate from the optical line. Therefore, the injection site was the abdominal blood vessel of the larva at the center of the back, as shown in Fig. 3. Chemicals were injected into the five-year-old larva’s abdomen, near the back of the blood vessel, a distance of about 1 mm, subcutaneously approximately 1 mm. The back of the
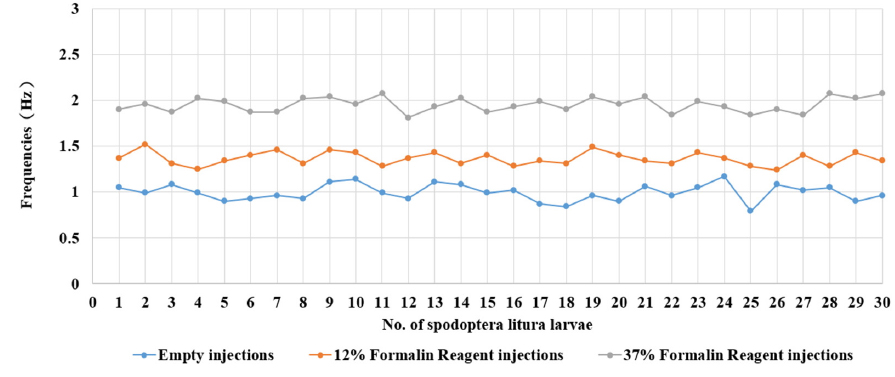
The study was performed by injecting of two different concentrations of reagents into 30 different five-year-old
2.4. System Calibration and Error Analysis
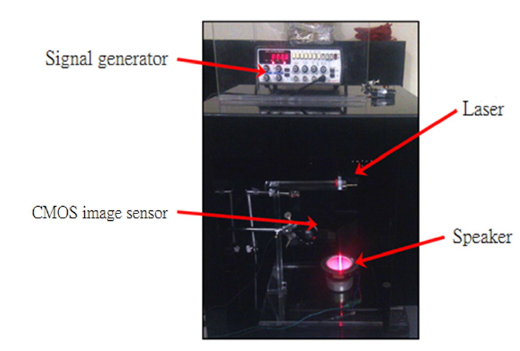
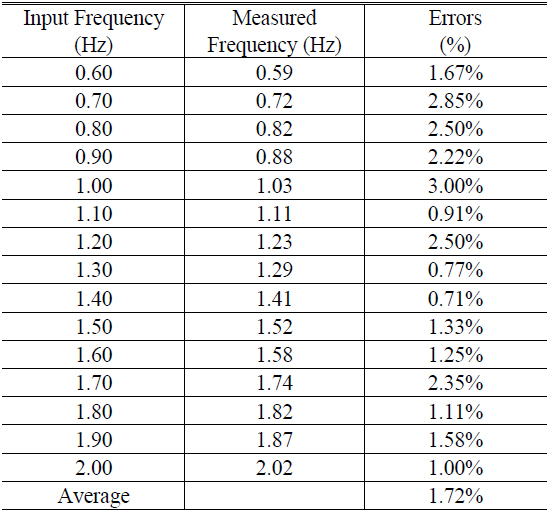
To increase the reliability of the experimental data, before the measurement of the muscle vibration we put a horn on the acrylic plate and projected a laser line on the surface of the horn to measure the vibration frequency of the horn, generated by a signal generator. We then compared our measurement results with the original signal generator output to determine the errors of our measurements. The signal generator output frequency is accurate to one decimal point (but the frequency from the frequency signal generator cannot be a fixed value, as it drifts over time), and we adjusted the output frequency from 0.60 to 2.00 Hz in steps of 0.10 Hz. Figure 5 is a schematic diagram of the frequency calibration experiment, while Fig. 6 shows the actual setup of the calibration system. Based on our need to measure from 0.60 to 2.0 Hz, the calibration experiments show that the error are less than 3%, as presented in Table 1.
[TABLE 1.] Calibration of the detection system for frequencies 0.60 to 2.00 Hz

Calibration of the detection system for frequencies 0.60 to 2.00 Hz
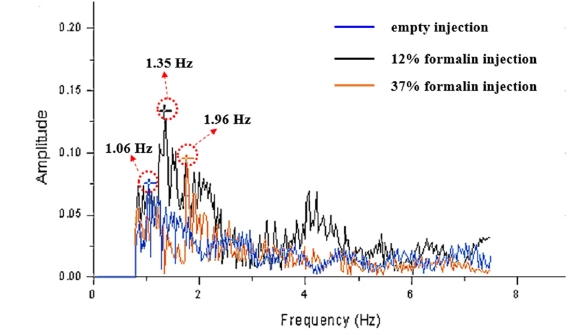
Figures 7 and 8 present for each repeated experiment the muscle vibration amplitudes versus frequencies and the main frequencies for the
Here we use the statistical
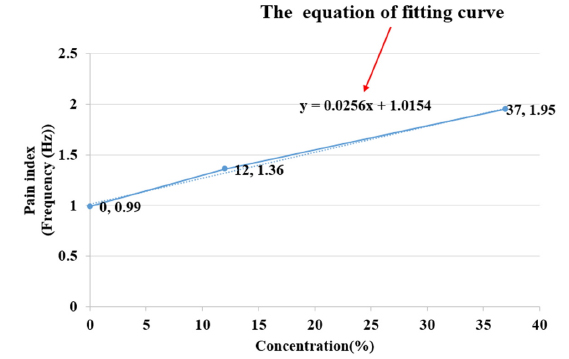
The comparison of different concentrations of reagents displays a similarly high muscle vibration of the exponential increase on the algesia in
Here we conclude that algesia causes muscle contraction; the more pain, the more frequently muscle contractions occur. The results are summarized in Figs. 7 through 9. According to our measurements, the main (peak) frequency and formalin concentration (pain feeling) have a positive correlation.
In Figure 7, we find that no regular pattern in amplitude is observed in our experiments. When
The energy causing its muscle contraction, in this extreme case, becomes body twitch, so the amplitude of the main (peak) frequency diminishes. In Fig. 7 the amplitude of the peak frequency for 37% formalin injection is less than that for 12%. Meanwhile, our measurement only focuses on partial muscle contraction, not the whole body. Therefore, in this study we choose the main (peak) frequency, not the amplitude, to be the pain index.
Meanwhile, since the muscle contraction is not a pure sine curve but a complicated distortion, the Fast Fourier Transform generates other peaks. In this study we focus on the main frequency because it has a more significant relation to pain, and we leave the study of other peaks for the future.
This study selects the muscle vibration frequency of
In this study, a CMOS image sensor and the linear laser optical triangulation method were used as measurement tools, with software for image processing and data analysis. We obtained a pain index quantity. We chose