The system in this study is mainly used for the measurement of pulse. In Western medicine, the pulse measurement is conducted by signals to the touch that are drawn into a pulse waveform to be analyzed. Among the currently published literature, there are descriptions of the pulse waveforms of normal people and of ones who suffer from hypertension, arteriosclerosis and various cardiovascular diseases. There is also much research that uses a variety of methods in time domain and frequency domain to explore the properties of blood vessels [1-3].
In traditional medicine, the doctors use fingertips to read the pulse. The reading may be affected by each doctor’s own experience, and that pulse reading by contact may also influence patients’ physical or psychological conditions, thereby affecting the pulse judgment [4-6].
Currently, there are two methods for measuring the information of an object surface. The first is the contact measurement and the second is the non-contact measurement. Contact measurement uses a probe to detect the contour information of the object surface, and non-contact measurement can detect such information without using a probe. Non-contact measurement has good benefits as there is no impact of human error. The measurement time is short. It does not cause damage to the object surface. There is no measurement error caused by the pressure feedback from the surface where the probe is pressed. It is a type of non-destructive optical measurement [7].
This study mainly uses moiré to measure pulse. This system selects the appropriate grating density and near-infrared spectroscopy to precisely measure the fringe displacement generated by the subcutaneous pulse. It is different from the previously seen spectroscope equipment which can only measure the vibration of the skin surface, and it can pair up with an integrated program to achieve a simplified operational process.
The basic principle in this paper is moiré. Place a grating flat on the wrist of the test subject and then apply near-infrared light on the grating, then a shadow moiré will appear under the wrist skin of the tester. Next, use a near-infrared photography device to observe the image after irradiation and retrieve the moiré produced by the reference grating and the shadow grating. The pattern is imported into the program to obtain the time-domain relationship of the pulse wave scanned by the light source, and then the relationship is converted into a frequency relationship after a fast Fourier transform.
Shadow moiré is one of the many moirémeasurements, and it is mainly used for measuring the surface height of an object and the deformation of the height. A reference grating is placed flat on the surface of the test object. A light source irradiates the grating to produce the shadow of the grating fringe, and that it is called a model grating, also known as a shadow grating. A photography device is then used to observe the irradiation and retrieve the image overlapped by the reference and shadow gratings. The image is a moiré generated by the interference of the two grating fringes.
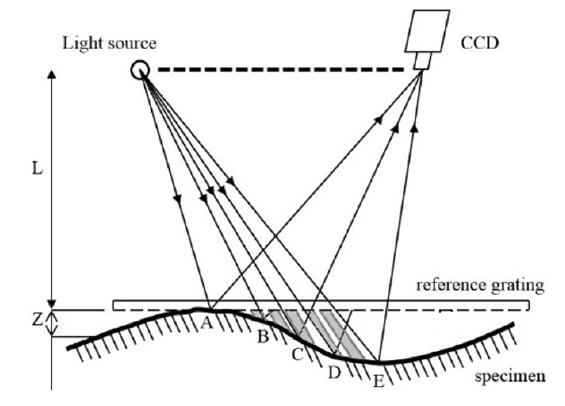
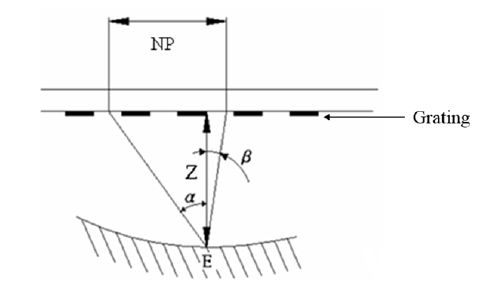
The interferometry of a shadow moiré fringe is shown in Fig. 1. At the A, C and E spots on the surface of the test piece, the light directly passing through the transmittance of the reference grating is retrieved by the camera, therefore forming the bright part of the moiré pattern. B and D spots are blocked by the dark part of the grating, forming the dark part of the moiré pattern as it cannot be retrieved by CCD.
Figure 2 shows the enlarged view around point E. α is light source’s angle of incidence with respect to the grating. β is camera’s observation angle with respect to the grating. We can learn from the geometric relationship:

After transposition we obtain the distance, Z, from the grating at point E.

Z:The distance between the surface of the test piece and the grating; P:Period of of the grating or period of the Ronchi gratings expressed in line-pair (a pair of black line and blank line.) N:Ordinal of moiré fringes, N=1, 2, 3,… α:Light source’s angle of incidence; β:CCD’s observation angle Applicable to any spot, Z(x, y), on the moiré pattern.
When the height, L, of the light source and CCD from the grating is much further than the distance, Z, of the surface of the test piece from the grating, the angle of incidence tends to be parallel, and that α and β can be seen as two reference values. The above equation (2) can be rewritten as:

he above is the characteristics equation for shadow moiré measurement, where K is a constant that is only relevant to the measurement system. Z(x, y) represents the height of any coordinate on the moiré pattern, and it is linearly proportional to the ordinal of moiré fringes, N. This is to say that the change of every fringe represents the change of a fixed height. This study uses this relationship to measure the topographic map of the surface height of a test piece and the displacement in height [8].
2.2. Simplifying Shadow Moire Method
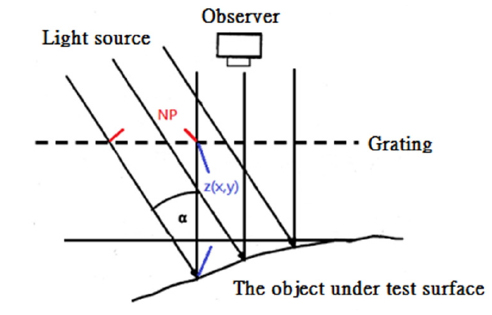
Also, we make the observer (CCD) do vertical observation of the grating to simplify the equation, and it is shown below:
As shown in Fig. 3 above, the observer is vertical to the grating which means β=0 and tanβ=0, and that the characteristic equation of the shadow moiré can be simplified from equation (3) as:

The above is the characteristics equation for shadow moiré measurement, where K’ is a constant that is only relevant to the measurement system. Z(x, y) represents the height of any coordinate on the moiré pattern, and it is linearly proportional to the ordinal of moiré fringes, N. This is to say that the change of every fringe represents the change of a fixed height.
The system program in this paper completes the measurement of the dynamic changes of fringes and height with respect to time using the above principles [9-14].
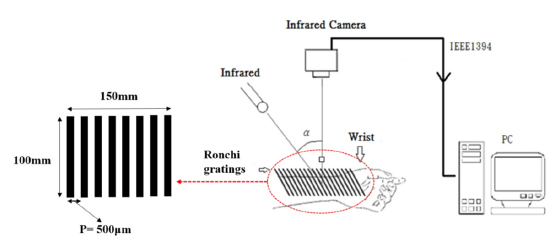
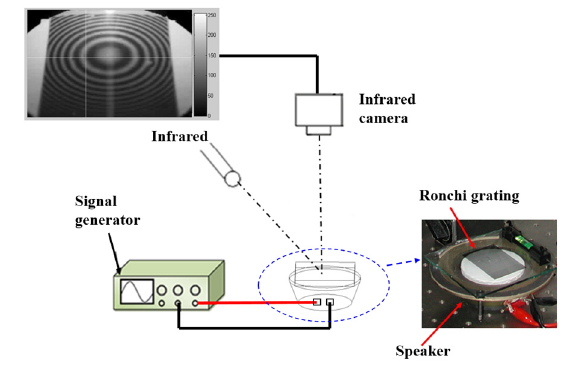
In accordance with the principle of shadow moiré measurement, the system architecture is as shown in Fig. 4 below. Use a set of printed Ronchi rulings with straight-line fringe interval as the reference grating, place it above the wrist at an appropriate distance, apply near-infrared laser with stable light intensity as the light source to illuminate the grating and the wrist, and then use a near-infrared camera right above to take the shadow moiré image generated under the wrist skin.
This system uses the simplified method that makes the observer vertical to the grating. Angle of incidence α= 40°, observation angle β= 0°, the fringe space of the reference grating P = 500 μm, put them into the simplified equation (4) of the shadow moiré to obtain the measured resolution at K'=595.88 μm.
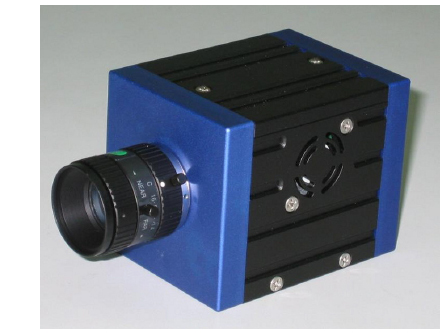
The specifications of the infrared laser module in this system are: Wavelength: 980 nm, output power: 1600 mW, and the spectral accuracy of the laser module is ∆λ = ± 5 nm. Near-infrared camera is an InGaAs short-wavelength infrared camera as shown below in Fig. 5, the manufacturer of the IR camera is U&U Engineering, Inc. Taiwan, and the model number is SWIR-320DE3. It uses indium gallium arsenide focal plane arrays (InGaAs FPA) as the detector module with imaging circuit and image processing module. The image resolution is 320 × 256 pixels and the shooting speed is 30 (frames/second).
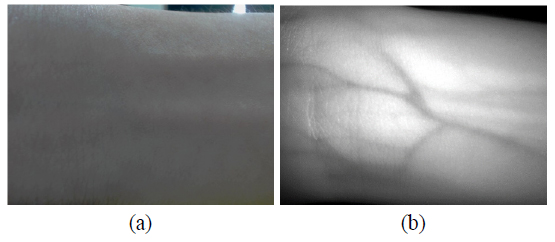
The difference of wrist skin image using visible photography and using infrared is shown in Fig. 6. Here we can notice that using visible photography can only see the skin of the wrist, but using infrared can observe the artery under the skin.
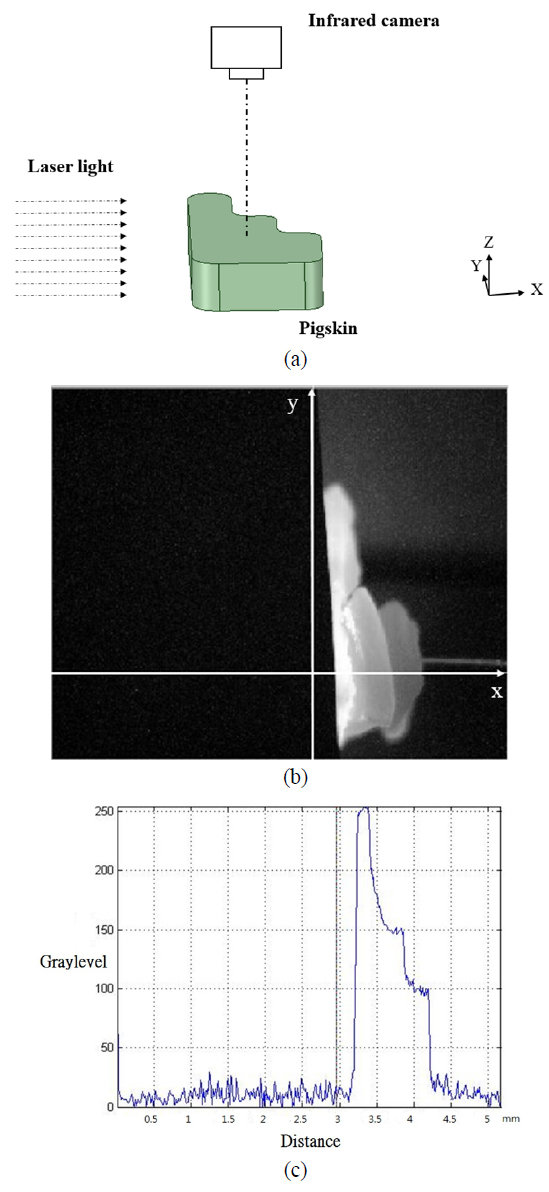
In order to understand whether the infrared light source and the infrared camera can work or not, therefore, we set up a pigskin experiment, before the experiment on the human skin. We use the pigskin to check whether our infrared system can work or not. The human skin depth from the surface of the skin to the dermis is 0.3~3 mm approx. [15], the pigskin depth from the surface of the skin to the dermis is 1mm (Fig. 7) by our measurement, 1mm of the pigskin is equivalent of humans’ 0.3~3 mm approx. This study measures how deep infrared can penetrate the skin by illuminating infrared to pigskin. Figure 7 illustrates how the experiment works and indicates the result that infrared could penetrate the pigskin about 1mm (from 3.25 mm to 4.25 mm).
Ronchi rulings grating with black-white fringe interval is used as a reference grating that generates shadow moiré. The fringe interval P is positively proportional to the measured resolution K, but is inversely proportional to the measured maximum distance Zmax. Amplitude grating with printed interval P=500 μm is used, and that the printed fringe can be seen on the transparent sheet.
IV. CALIBRATION AND ERRORS ANALYSIS
In order to check the accuracy of the moiré system measuring frequency for the human pulse waveform, we make a calibration: to check our moiré measurement system, we set up a standard electric function generator to drive a speaker instead of human wrist at guan pulse as a standard reference target. The guan pulse will be more completely described in Section V. A standard electric signal generator vibrates the speaker, and then we put a Ronchi grating which is above a speaker instead of human wrist and measure the vibrated frequency of the speaker by our moiré method. In the next step, we compare our measurement results with the original signal generator output signal to find the error of our system. Figure 8 is an experimental set up of the calibrated system, which is based on measuring the speaker vibration frequency drive by electric function generator in the frequency range 0.7 Hz to 2Hz. The error of comparing the speaker vibration frequency measured result by the moiré measurement frequency and the function generator frequency is less than 3%, as shown in Table 1.
[TABLE 1.] Table of the Calibrated Detection System for 0.7 Hz-2 Hz frequency
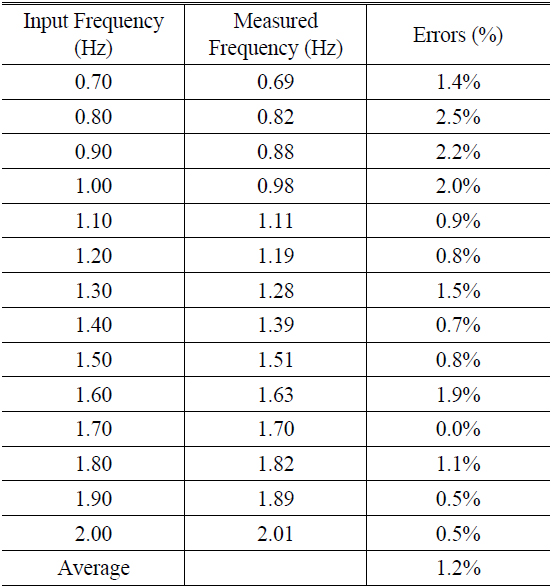
Table of the Calibrated Detection System for 0.7 Hz-2 Hz frequency
V. THE FLOW CHART OF THE PULSE SHAPE MEASUREMENT AND THE EXPERIMENT RESULTS
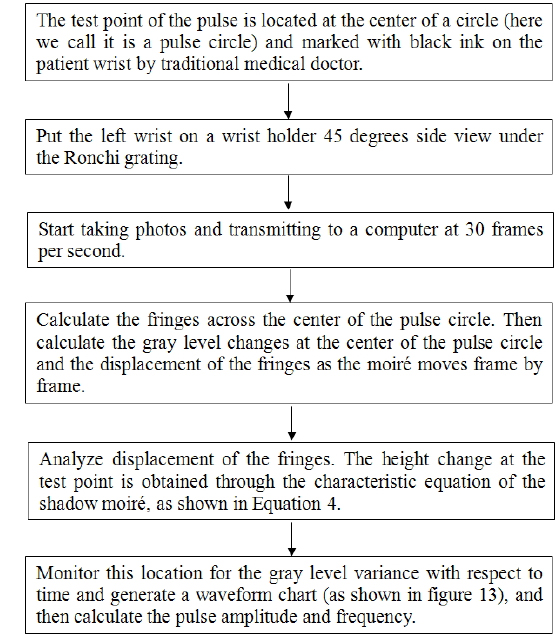
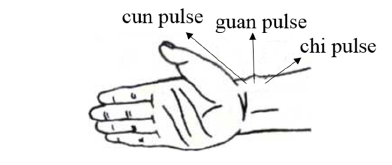
The flow chart of the pulse shape measurement is shown in Fig. 9. First, the test point of the pulse is located at a center of a circle (here we call it a pulse circle) and marked with black ink on the patient’s wrist by a traditional medical doctor. Before the pulse test, according to traditional medical principle, pulse-taking means that the doctor uses his or her hand to press certain part of the patient’s pulse to examine the conditions of the pulse and to diagnose disease. Cunkou is the usual region selected to take the pulse, it refers to pulsation of the radial artery on the wrist. Pulse over cunkou is divided into three parts: cun, guan and chi. The part slightly below the styloid process of radius is the guan pulse, the part anterior the guan pulse is the cun pulse, and the part posterior the guan pulse is the chi pulse (as shown in Fig. 10). Both hands have three divisions of pulse, i.e. cun pulse, guan pulse and chi pulse. So altogether there are six divisions of pulse. Here we take the guan pulse of the left hand as our measurement target.
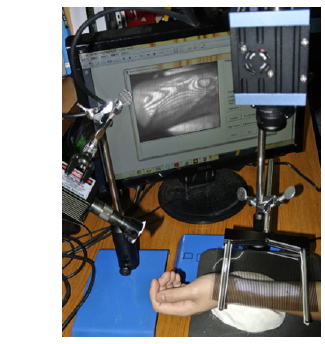
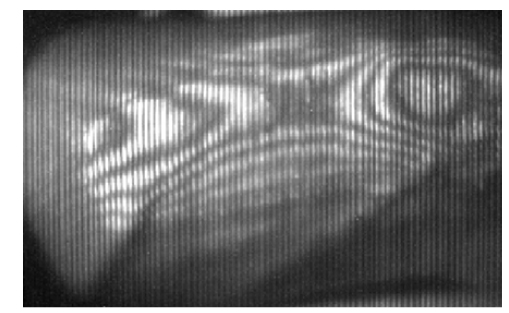
We put our left wrist on a wrist holder 45 degrees side view under the Ronchi grating as shown in Fig. 11 and we started taking photos. The moiré pattern is generated and captured by the near-infrared camera is shown in Fig. 12, and the photos transmitted to a computer at 30 frames per second. The program begins by calculating the fringes across the center of the pulse circle. Then calculate the gray level changes at the center of the pulse circle and the displacement of the fringes as the moiré moves, frame by frame. The height variance (gray level variance) at the test point is obtained through the characteristic equation of the shadow moiré, as shown in Equation 4. Monitor this location for the gray level variance with respect to time and generate a waveform chart (as shown in Fig. 13), and then calculate the pulse amplitude and frequency.
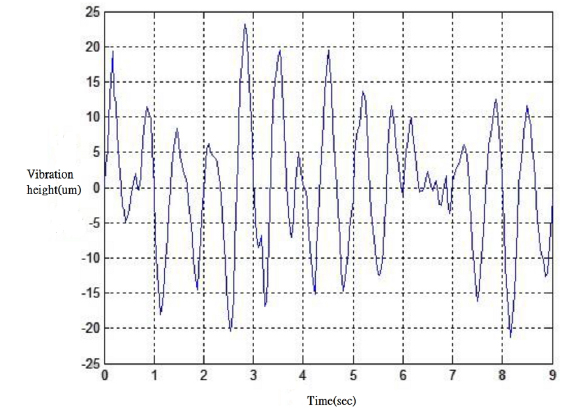
The preset measuring time frame is 9 seconds. The video is converted into 271 images and imported into the moiré positioning pulse program to obtain a pulse amplitude changes diagram as shown in Fig. 13.
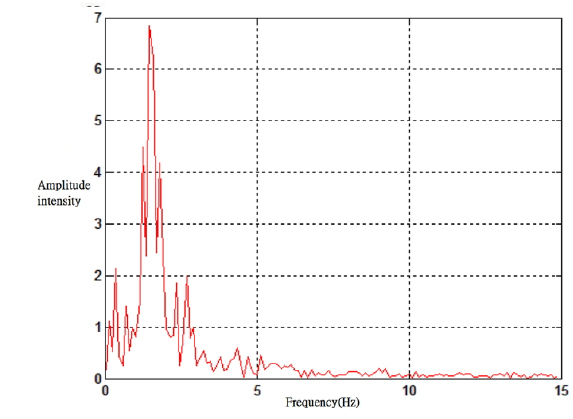
The pulse waveform diagram obtained from Fig. 14 shows the result from a fast Fourier transform (FFT) program which converts the time domain into frequency domain and obtains the patient main pulse is at 1.44444 Hz which is equal to 87±2.5 beats per minute.
The camera placement in Fig. 12 is a side view of the wrist and the Fig. 6(b) is the front view. The side view of the wrist has fewer blood vessels than front view, besides the infrared light shining on the Ronchi grating will generate a shadow of skin overlap in the side view, and its blood vessels image which will decrease the contrast of the blood vessel image and make the blood vessels unrecognizable. Here we are not only measuring the blood vessels shape changes, but also measuring the shape changes of the muscle near the blood vessels, which is similar to the traditional medical doctor using their finger to touch the area of the blood vessels and the nearby muscle to get the pulse features.
This paper studies a non-contact optical moiré pulse measurement system and utilizes the penetration ability of near-infrared to measure the vibration of pulse under the skin. It is different from the commonly seen visible photography which can only measure the vibration of the skin surface, and the pulse wave obtained for the near-infrared is closer to the actual result. This system currently can accurately and quickly measure the pulse wave and heartbeat, automatically, improving the efficiency and accuracy of measurement and reducing the error due to hand touch in the traditional medical doctor’s pulse taking.