Kr-85 is a radioactive gas released to the atmosphere by nuclear explosions, nuclear power plants, volcanoes, and earthquakes. The major source of Kr-85 is nuclear fission in nuclear reactors and nuclear weapon tests. It is worth mentioning that, as a result of nuclear weapon tests from 1945 through 1962, an estimated 5 million curies of Kr-85 were released to the atmosphere. This radionuclide is odorless, colorless, and tasteless; and emits low levels of both gamma and beta radiation [1]. It is used in gas mixtures with argon or xenon to improve ionization in light bulbs by reducing their starting voltage. This radionuclide is also used in plasma displays, spark gaps, and leak detection. The most important concerns occur when a very small amount of Kr-85 is taken into the body, dissolved in the blood stream, and distributed to the organs and tissues throughout the whole body. The tissue most affected by beta particles emitted from Kr-85 radioactive decay, is the skin. Unfortunately, Kr-85 does not generally participate in any chemical separation processes due to its fully occupied electronic valance shell. Separation of such an important gas is an interesting subject for scientific investigation.
Separation of gas mixtures using nanoporous materials is an emerging field of research with great potential such as gas sensor and gas purification applications. The materials that are currently being investigated for these applications include zeolites [2], silica [3], carbon [4], and polymers [5]. These membranes all have the key properties of chemical resistance and thermal stability. Graphene, an atomically thin single sheet of graphite comprising sp2-bonded carbon atoms arranged in a hexagonal lattice [6], holds significant promise for gas separation due to its unique properties. Pristine graphene has been shown to be impermeable to gases [7]. However, several studies have suggested that graphene has the potential to induce highly selective transport by generation of pore defects [8-14], in which atoms can be removed from the graphene lattice to create pores of specific size and geometry.
Despite the simple architecture of such molecular sieves, the experimental set-up remains challenging. Drilling such delicate nanopores on single graphene sheets is one of the challenges in current research on molecular sieves, as is detection of single molecules (e.g., for DNA sequencing) [15]. For example, UV-induced oxidative etching [16] can create pores in micrometersized graphene membranes and the resulting membranes could be used as molecular sieves. Jiang et al. [10] designed two one-atom-thin porous membranes for gas separation by simulation and modeling, and computed diffusion barriers. They estimated H2/CH4 selectivity on the order of 108 and 1023 for the N-functionalized, and all-H pores, respectively. First principles molecular dynamics simulations indicate a high flux of H2 through the N-functionalized pores in a graphene membrane, which is in accord with the relatively low H2 diffusion barriers. Blankenburg et al. [13] proposed and characterized a one-atom-thick membrane for atmospheric gas separation. They performed simulation and modeling calculations for different atmospheric gas molecules entering the membrane pores. The determined separabilities for hydrogen and helium ranged from 103 up to 1023 at room temperature, with a permeance greater than 10−6 m−2 s−1 Pa−1, which is superior to those of classical membranes. They proposed that such membranes show high hydrogen and helium selectivity and could be useful for membranes in fuel cells or gas sensors, for separation of CO, CO2, or ammonia, as well as for extraction of helium.
After that; Koenig et al. [17] investigated the transport of a variety of gases (H2, CO2, Ar, N2, CH4, and SF6) through the pores and compared their results with those of Blankenburg et al. [13] and Jiang et al. [10] Koenig et al. [17] found a H2 leakrate on the order of ~10−20 mol s−1 Pa−1 for a H-passivated pore in graphene consisting of two missing benzene rings at room temperature. The similarity in the H2 leakage reported in the previously mentioned work suggests a H2 energy barrier to pore entry
Recent advances in molecular simulation make it possible to study these systems at atomic resolutions. Based on the aforementioned reasons, at the moment, we suppose that validating the results of such delicate simulations is impossible by experiment; however, we expect that our results might motivate experimental research to validate these results in the near future.
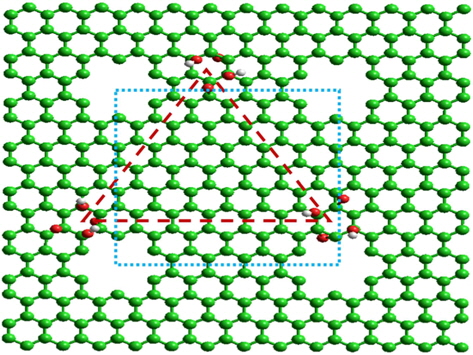
Graphene oxide (GO) is a chemically modified graphene with oxygen-containing functional groups (e.g., hydroxyl, carbonyl, epoxy, and carboxyl groups) on the graphene basal plane [18]. In recent years, it has become one of the most studied nanomaterials [19-24]. GO has a long history, dating back to at least 1859, when Brodie reported its synthesis [19]. Despite this history, the structure of GO is still under debate. GO based materials have generated incredible interest for energy-related applications because of its multifunctional flexibility [25,26]. Moreover, GO has recently been studied for various biological applications [27], and has been applied in areas such as fabrication of intercalated GO composites [28]. Recent studies showed that successful separation of gas mixtures using GO-based membranes, represents remarkable potential of GO in the field of gas separation [29-33]. Considering the theoretical surface area of graphene (2630 m2/g) [34] and the hydrophilic surface of GO, it is expected to have huge space in which to store polar and hydrophilic gas molecules. This space could be used for storage and separation of hydrophilic gas. Despite the enormous potential for applications of GO, improvements in porosity and surface area are rarely found for gas separation applications. Separation processes based on membranes, depend on several properties, including pore size, stable structure, and appropriate permeability. The porosity and accessible surface area can easily be tuned for electrochemical, gas storage/separation, and catalytic ability by changing the spacing in the graphene layer, or by functionalizing with various chemical groups. For example Kim et al. [31] reported highly permeable and selective GO membranes for separating mixtures of gases of industrial relevance. They focused on the gas-transport properties of thin defective graphene and GO membranes, and reported that graphene itself displays outstanding gas separation properties. However, to the best of our knowledge, molecular sieving of radionuclide gas by nanoporous GO (NPGO) has never been reported. Demonstration of this capability is fundamental knowledge for further application of NPGO for gas separation. A popular structural model of GO, shown in Fig. 1, was proposed by Guo et al. [35]: an equilateral triangle formed by three C8O2 (OH)2 units. In this model the C8O2 (OH)2 units are homogeneously distributed on the carbon sheet. Each C8O2 (OH)2 unit contains two para-epoxy groups at opposite sides of the carbon plane, and two para-hydroxyl groups above the plane of the carbons.
2. Simulation Details and Methods
Molecular permeation of three different gases (namely Kr-85, O2, and N2) through NPGO with different pore sizes was simulated based on a molecular dynamic approach. For simplicity, hereafter Kr is used to represent 85Kr. All molecular dynamic simulations were performed using the large-scale atomic/molecular massively parallel simulator (LAMMPS) package [36] and structures were visualized using the visual molecular dynamics (VMD) package [37]. The all-atom optimized potentials for liquid simulations (OPLS-AA) was used for GO, which is able to capture essential many-body terms in inter-atomic interactions (i.e., bond stretching, bond angle bending, van der Waals, electrostatic interactions, and partial charges) [38]. All molecular dynamic simulations were performed in an NVT ensemble for 10 ns. The Nose-Hoover barostat and thermostat [39] were applied to maintain the pressure and temperature at 1 atm and 300 K, with damping coefficients 1 ps−1 and 0.1 ps−1, respectively, and time steps of 0.5 fs were used during all molecular dynamic simulations. Energy minimization was performed to find the thermally stable morphology and to achieve a conformation with the minimum potential energy for all molecules. Non-bonded van-der-Waals interactions were modeled in terms of 12-6 Lennard-Jones famous potentials [40] with a cut-off distance of 1.2 nm, that is:
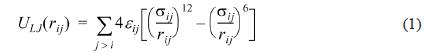
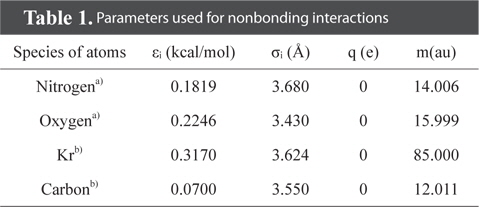
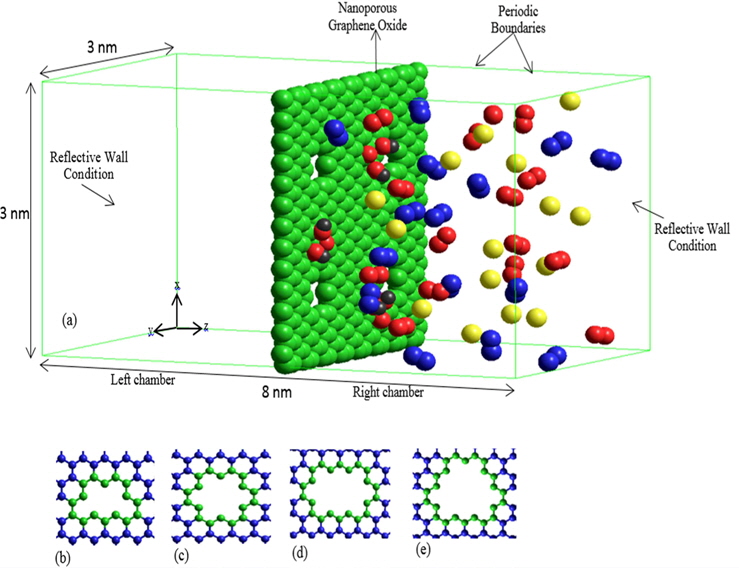
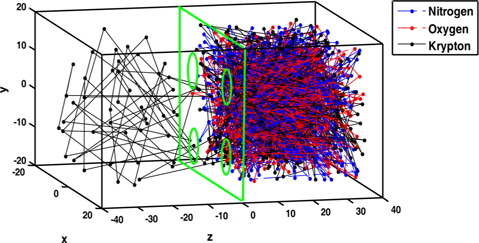
The parameters used for non-bond interactions are given in Table 1 [41,42]. The SHAKE algorithm was applied for the stretching terms between oxygen and hydrogen atoms of GO to reduce high-frequency vibrations that require shorter time steps [43]. The particle mesh Ewald (PME) [44] method with a 10.0 Å real-space cutoff, 1.5 Å reciprocal space gridding, and splines on the order of ‘4’ with a 10-5 tolerance was implemented to compute the electrostatic interactions. A simulation box with the dimensions of 30 × 30 × 80 Å was constructed and a NPGO membrane was placed in the middle of the box at Cartesian coordinate origin (0, 0, 0) as the separator, dividing the simulation box with the height of 4 nm into two equal volume chambers, right and left chambers for all molecular dynamic simulation (Fig. 2). Initially, an equal number of 15 species of gases of Kr, O2 and N2 were loaded into the right chamber (see Fig. 2), while the other side (left chamber) was vacuum for all molecular dynamic simulations.
[Table 1.] Parameters used for nonbonding interactions

Parameters used for nonbonding interactions
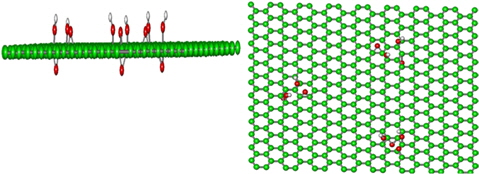
To construct the NPGO membrane, four pores on the GO sheet were regarded as a unit cell, and the NPGO model had three C8O2 (OH)2 units on the carbon plane, as can be seen in Fig. 3. Reflective boundary conditions were applied in the z-direction of the simulation box (normal to the graphene plane) while periodic boundary conditions were considered in the other two directions [45]. To avoid vertical displacement of the entire NPGO membrane, the NPGO was frozen during the simulation. Nanopores were created by selectively removing atoms from the GO sheet. Various sizes of pores were considered, which were called by the number of graphene ring units removed or partially opened (i.e., P-5 (P-5), P-7, P-10 and P-12; see Fig. 2). As shown in Fig. 2b-e, some carbon atoms of the single layer GO were arbitrarily removed to generate an axially symmetric shape of the nanopores. Some pores (P-7 and P-10) were fabricated by removing carbon atoms whose coordinates fulfilled the condition , circle equation, where “r” is the radius of the pore. Moreover, x, and y are the Cartesian coordinates of atoms, with respect to the origin of the coordinate system. The other pores were constructed by removing carbon atoms to build the noted pore, without any specific equation. The fabrication procedure for all nanopores was conducted using the VMD package [37].
3.1. The mean-squared displacement analysis
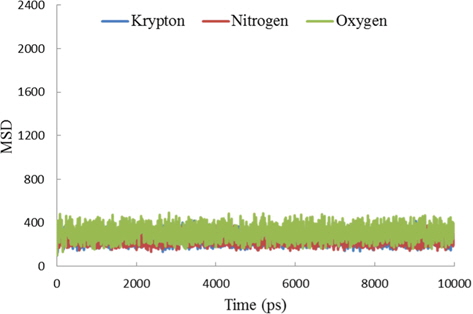
The results of mean-squared displacement (MSD) calculations pertaining to the titled gases at P-5, P-7, and P-10 GO pore sizes are displayed in Figs. 4-6, respectively. As can be seen, none of the species of the gases could cross the NPGO membrane through P-5, because the size of these pores was smaller than the kinetic diameter of all species of gases (Fig. 4). Because the pore size was very small, three gases were confined to the right chamber. They have some non-zero value for MSD.
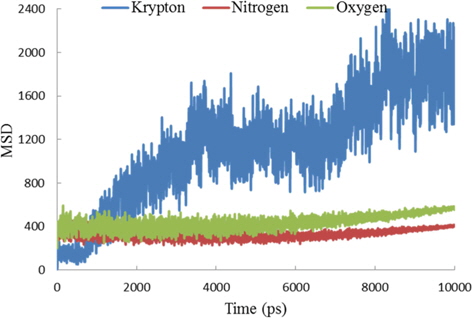
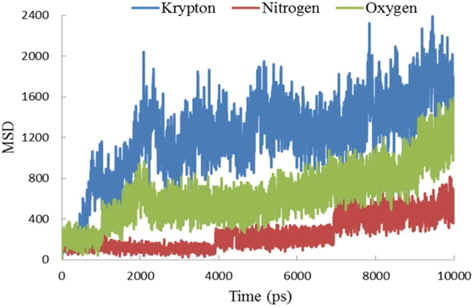
Fig. 5 shows the calculated MSD versus time in the P-7 GO membrane. As can be seen obviously in Fig. 7, only Kr could cross the nanoporous graphene membrane through P-7 due to a pore size adequate for the entry of Kr atoms. For NPGO with this pore size, it can be concluded that molecular sieving occurred and that Kr gas was separated selectively from the gas mixture, whereas the size and shape of the pores restricted the permeation of the nitrogen and oxygen molecules. The corresponding simulation snapshots of molecular sieving of Kr atoms are shown in Fig. 7. Fig. 6 shows the calculated MSD versus time in a P-10 GO membrane. As expected, increasing the pore size to P-10, removed the restrictions and all the gases were able to pass through the graphene membrane.
3.2. The comparison of diffusion coefficients
Using MD trajectories, the diffusion coefficients of Kr and di-atomic gases through the various rings of the NPGO membrane could be calculated from the limiting slope of the MSD curve against time using the Einstein relation [46]. This equation relates the long-time (t) limit of MSD of the particles to diffusivity, D, through

Where
[Table 2.] Calculated coefficient diffusions for Kr, N2 and O2 at various pore sizes
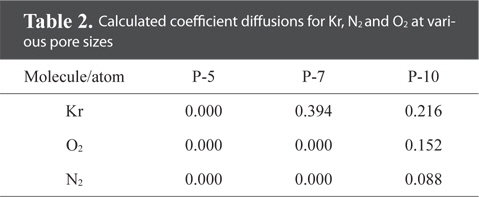
Calculated coefficient diffusions for Kr, N2 and O2 at various pore sizes
3.3. Number of species of gases passed through the NPGO membrane
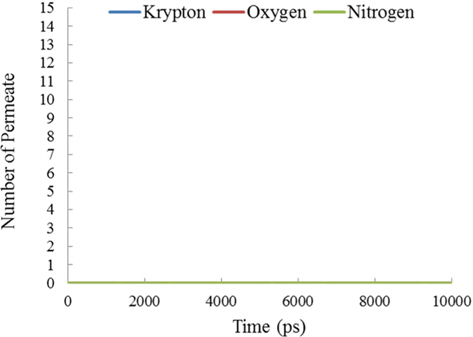
To find the effect of the pore size on the number of gas species passing through the NPGO membrane, the number of gases passing the NPGO membrane was calculated. Fig. 8 shows the total number of gases crossed, versus time, for Kr, N2, and O2 through a P-5 NPGO membrane.
Graphene is an excellent starting point for developing size selective membranes [47] because of its atomic thickness and impermeability to all gases [48,49]. However, this means that pores that can exclude larger molecules, but allow smaller molecules to pass through, have to be introduced into the material. In Fig. 8, the size of the pores is much smaller than the molecular size of all the investigated gases. Therefore, none of the species of gases could cross the P-5 NPGO membrane, and both the fluctuations and the value of graphs are zero.
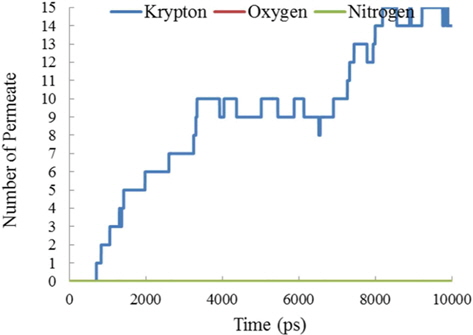
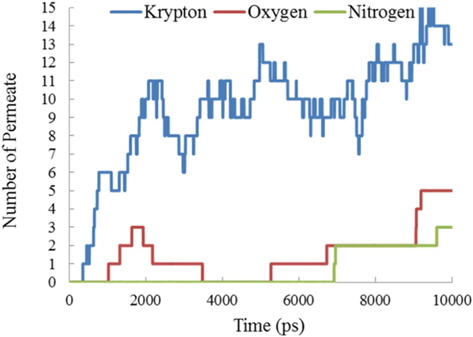
When the pore size was increased to P-7, O2 and N2 molecules could not cross the membrane. Fig. 9 shows the total numbers of crossed gases versus time for Kr, N2, and O2 for P-7 NPGO. Fig. 10 shows the typical trajectory of gas separation; and finally, molecular sieving of Kr occurred for P-7 NPGO during 10 000 ps of simulation time. Fig. 11 shows the total number of crossed gases versus time for Kr, N2 and O2 in the P-10 NPGO. For pores at the size of P-10, all three gases could cross the NPGO membrane; whereas, P-7 only allowed Kr atoms to permeate. In the case of O2 and N2, the restriction of the molecular orientation largely prohibited permeation. When nitrogen and oxygen molecules were not blocked by the size of the pores (i.e., P-10), more oxygen molecules passed through the NPGO membrane than nitrogen molecules. This might be related to a lower potential barrier of permeation for oxygen molecules. Permeation events were calculated in Table 3.
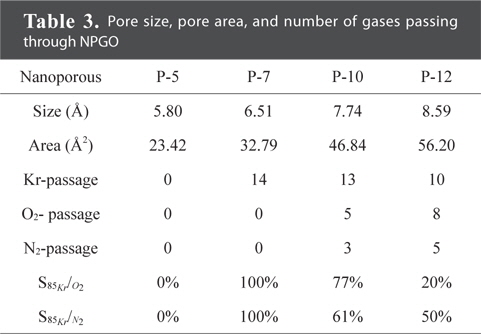
[Table 3.] Pore size, pore area, and number of gases passing through NPGO

Pore size, pore area, and number of gases passing through NPGO
As shown in Table 3, no gas was observed to permeate through P-5 during 10 ns simulation, while Kr atoms of P-7 went through the pores. This issue was completely due to the pore size restriction as P-7 pores were too small for nitrogen and oxygen to get through, but large enough for Kr. In this way, Kr atoms can be completely separated from nitrogen and oxygen molecules by P-7 NPGO. For pore size P-10, during 10 ns of simulation, thirteen Kr atoms passed through pores, while the corresponding number of oxygen and nitrogen molecules was five and three, respectively. For pore size P-12, more nitrogen and oxygen molecules, and fewer Kr molecules, permeated than with P-10. Moreover, the number of oxygen molecules permeating the P-12 membrane increased and exceeded that of nitrogen molecules. For pore size P-12, still more oxygen molecules permeated the membrane than did nitrogen. Also, the configurations of oxygen and nitrogen molecules placed at the center of the pore were different. The permeation ratio, defined as the ratio of the numbers of permeation events of the two types of gas molecules, could be used to describe the selectivity of the membrane. Here, the permeation ratio is reported as Kr/O2 and Kr/N2 permeations. A higher permeation ratio means better selectivity of the NPGO membrane. If the permeation ratio is equal to one, there is no selectivity. Maximum Kr/O2 and Kr/N2 permeation ratios were observed for P-7 membranes. The Kr/O2 and Kr/N2 ratios decreased as the pore size increased, until P-12.
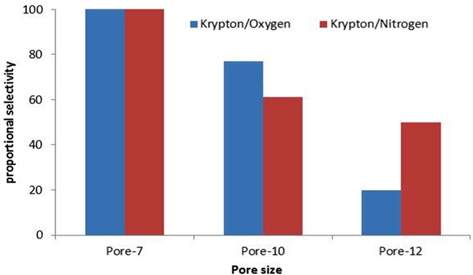
Fig. 12 shows proportional selectivity of Kr from the gas mixture. As Fig. 12 shows, when the well-defined pore size P-7 was selected, Kr yield and selectivity were remarkable (to the maximum of 100%). With larger pore sizes, Kr yield and selectivity decreased according to pore size such that for P-10 and P-12, with pore area of 46.84 and 56.20 (Å2), the Kr yield and selectivity were 62% and 43%, respectively.
Preliminary results indicate an additional approach might further increase Kr gas separation. Fig. 12 indicates that there is discrimination between Kr gas and the O2/N2 mixture, as applied gases which contribute to higher separation selectivity in P-7. It is concluded that more carefully defined pore size could intensify separation of Kr gas from the mixture. Thus the proper pore size actually plays a key role in the enhancement of selectivity for Kr.
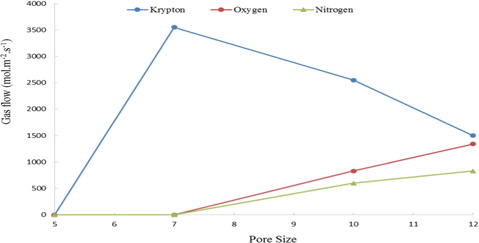
3.4. Calculating the flow of gases
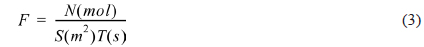
The flow is used to characterize the membrane permeability quantitatively, and is defined as:

Where N is the moles of gases that permeated through the NPGO membrane, S refers to the total area of the nanoporous membrane, and T is the time. The flow of Kr, O2, and N2 was calculated for the various pore-size models, as shown in Fig. 13. There was a prodigious increase in the flow of Kr atoms near the pore size of P-7, where restrictions related to the size and shape of the pores to Kr permeation began to vanish. At larger pore sizes, the flow of Kr atoms became reduced. In the case of the nitrogen and oxygen molecules, flow increased as the pore area increased.
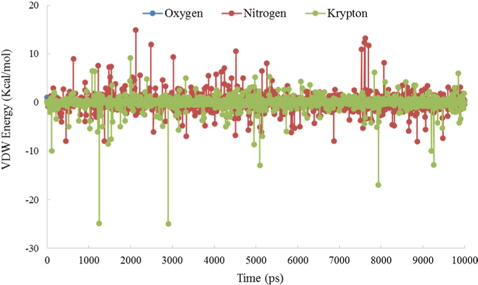
3.5. Van der Waals interaction
The van der Waals interactions between gas molecules and the atoms at the edges of pores in the NPGO membrane were also calculated, and are shown in Fig. 14. As shown there, the VDW energy between the Kr gases and edge atoms of the P-7 NPGO was more negative than for oxygen and nitrogen. This caused transit of Kr gases through the NPGO membrane, which resulted in more Kr-permeation events than for oxygen and nitrogen.
3.6. Compare porous graphene and GO nanopores
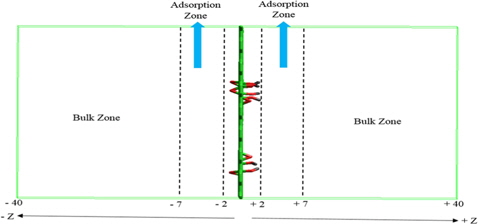
Results of simulation showed that N2 gas is strongly adsorbed onto NPGO, thus forming an adsorbed layer that can contribute to comparison of graphene and GO membranes. Fig. 15 shows schematic adsorption onto the NPGO surface as a function of the distance from the membrane GO nanopore (z = 0). Nitrogen features strong adsorption layers, while oxygen and krypton are significantly less attracted by the NPGO membrane. In order to analyze the relative contribution of the bulk (gas phase) and adsorbed layer to compare graphene and NPGO membranes, we divided each chamber into two different zones along the z-direction, namely the adsorption and the bulk zone (gas phase). We defined the adsorption zones as the regions 2 Å < |z| < 7 Å and the bulk zones as the regions 7 Å < |z| < 40 Å, as shown in Fig. 15. To compare graphene and GO membranes, the probability density of finding molecules of each of the gases involved in this study, was calculated as a function of the distance from the membrane.
Regarding the placement of C8O2 (OH)2 on the graphene sheet; two C8O2 (OH)2 molecules are close to two pores while the other C8O2(OH)2 is in the middle of the other two pores. Thus, two pores are influenced by C8O2 (OH)2 while the other two pores are without such influence. As a whole, the results showed that the gas features involved in this study have the densest adsorbed zone in NPGO, compare with a graphene membrane. The adsorbed zone is defined as the number of gas particles divided by the volume of the simulation box. The gas density was calculated by considering only the particles in the adsorption zone (2 Å < |z| < 7 Å) and the volume available to them. The probability density by simulation was 1.6%, 14.4%, and 18.2% (for, Kr, O2, and N2 respectively for graphene); and 2.1%, 27.4%, and 39.5% (for Kr, O2, and N2 respectively for GO). This means that more molecules cross through NPGO than through porous graphene.
Using simulations of molecular dynamics, we showed that NPGO membranes could be applied to separate Kr-85 gas radio-nuclides from natural air. The results of the simulation showed that separation of Kr-85 from air could best be achieved using pore size P-7, which was barely larger than the Kr-85 gas radio-nuclides, and was smaller than the nitrogen and oxygen molecules. Thus P-7 pores were too small for nitrogen and oxygen molecules to get through, but large enough for Kr-85 to permeate. In this way, Kr-85 gas radionuclides could be completely separated from nitrogen and oxygen molecules by P-7 NPGO membranes. When the pore size was P-10, thirteen Kr-85 molecules permeated through the pores during 10 ns simulation and the corresponding numbers of oxygen and nitrogen molecules were five and three, respectively. When the pore size was P-12, nitrogen and oxygen molecules permeated the nanoporous graphene. When nitrogen and oxygen molecules were not blocked by the pores (i.e., for P-10 or larger), there were more oxygen molecules permeating through the NPGO membrane than nitrogen molecules.