The growth of the demand for social development stimulates the development of electronic equipment, especially small portable devices. Among them, lithium ion batteries have attracted much interest as they have the ability to reversibly store and release electric energy with high charge density. In lithium ion batteries, the cathode plays an important role and critically determines the performance of the batteries. Nowadays, LiFePO4 is widely recognized as a promising cathode material for large-scale applications. It is used in batteries to power portable devices such as mobile phones and laptops or in power sources for electrical and hybrid vehicles.
The LiFePO4 battery has a high theoretical specific capacity (~170 mAh g−1) [1-3], high-temperature stability, low cost, and is environmentally benign [4]. However, it also has the disadvantage of low electronic conductivity (~10−9 S cm−1) [5] which causes loss in the initial discharge capacity, poor rate discharge capacity, and low diffusion of lithium ion. Fortunately, this problem can be solved using different approaches such as doping with some elements to increase the electronic conductivity in the interface, the addition of a carbon source to provide a homogenous carbon coating around the particles, and the modulation of particle properties such as shape, size or phase distribution. Among them, element doping emerges as a good method to solve this issue. Recently, it was found that doping with alien cations (such as Nd, Mo, Ni, Mg, Ti, V, and W) at Li-site and/or Fe-site [6,7] was another feasible way to enhance the intrinsic conductivity; Fe-site doping may be a more suitable strategy to enhance the intrinsic conductivity. Consequently, significant efforts have been made to investigate the doping effects at Fe-site on the physicochemical and electrochemical properties of LiFePO4. The doping at Fe-site can be implemented using various methods such as sol-gel method and hydrothermal method [8,9]. In comparison with other methods, hydrothermal synthesis has some advantages such as the simple synthesis process, short time required for synthesis, low energy consumption, and the small particle size obtained.
In this study, Ga doped LiFePO4 composites were prepared using the hydrothermal method. The electrochemical properties of the composites were investigated using cyclic voltammetry and electrochemical impedance spectroscopy.
Ga-doped LiFePO4 (i.e., LiFe1−xGaxPO4 (x = 0.00, 0.02, 0.04)) composites were prepared using a hydrothermal method. LiOH·H2O (Aldrich Co., 99.95%), FeSO4·7H2O (Aldrich Co., >99%), H3PO4 (Aldrich Co., >99.999%), ascorbic acid (C6H8O6) (Aldrich Co., >99%), and Ga(NO3)3·xH2O (Aldrich Co., 99.9%) as precursor materials were mixed at a stoichiometric ratio (nLi/nFe/nGa/nP = 1:1-x:x:1). The mixtures were heated at 170℃ for 12 h in a Teflon obturation vessel (TAF-SR-50, TAIATSU TECHNO, Korea) and sealed in a stainless steel autoclave. The resulting solutions were filtered and washed many times with distilled water to obtain a precipitate powder. The precipitate mixtures were then milled at 300 rpm for 10 h in a Planetary Mono Mill in N-methylpyr-rolidone (NMP). The powders were pelleted and further heated at 500℃ for 1 h in a tube furnace (J-FCA, Jisico, Korea) under nitrogen atmosphere. After cooling to room temperature, LiFe1−xGaxPO4 was ball-milled at 300 rpm for 10 h. Finally, the mixtures were dried at 90℃ for 12 h.
The crystal structures and morphologies of the synthesized LiFe1−xGaxPO4 powders were characterized using high-resolution X-ray diffraction (HR-XRD, D/MAX Ultima III, Rigaku, Japan) with scanning steps of 0.02° over the range of 10°~50°, field emission scanning electron microscopy (FE-SEM, Hitachi, Japan), and energy dispersive X-ray spectroscopy (EDS, EMAX Energy EX-200, Horiba, Japan).
The electrodes were made from mixtures of LiFe1−xGaxPO4 with carbon black (SP-270) as the conductive material and polyvinylidene fluoride (PVdF) as the binder material in a percent weight ratio of 70:25:5. After ball-milling, the slurries were coated onto aluminum foils and dried at 90℃ for 1 h. The electrodes were roll-pressed (0.6 m min−1, 20 μm), cut into 2×2 cm2 sections and dried at 110℃ for 24 h under vacuum. The CR2032 cells were assembled in an argon-filled glove box using lithium as the anode, 1 M LiPF6/EC-DMC (1:1) as the electrolyte, and a Celgard #2500 membrane as the separator. Cyclic voltammetry (CV) was carried out on automatic charge/discharge equipment (WBCS3000, WonATech Co., Korea) with the scan rate set to 0.1 mV s−1. The electrochemical impedance measurements were performed with an IM6 impedance measurement system (ZAHNER IM6, Germany). AC voltage was set to a 5 mV amplitude over the frequency range from 10 mHz to 2 MHz. The charge-discharge experiment was carried out with the abovementioned WonATech system in the voltage range from 2.5 to 4.0 V at room temperature to investigate the charge/discharge behavior.
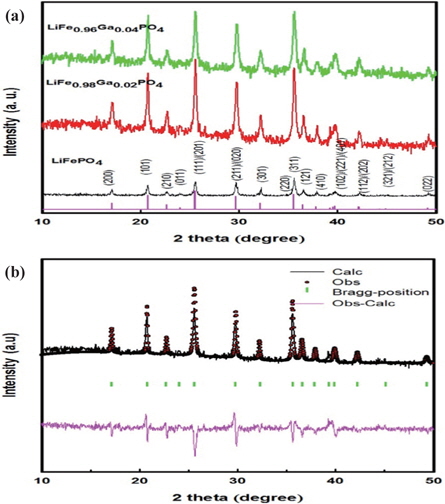
The XRD patterns of LiFe1−xGaxPO4 powders are shown in Fig. 1(a). The LiFe1−xGaxPO4 samples have the same peaks as those in the X-ray powder diffraction data file (JCPDS card number 81~1,173). All the patterns index to a single-phase material that has an orthorhombic olivine-type structure with a space group of Pnm. The XRD results demonstrate that the only phase observed is LiFePO4, and no secondary phases were detected. Figure 1(b) shows the Rietveld refinement results of XRD data for the typical gallium ion-doped sample of LiFePO4 based on an ordered olivine (orthorhombic) structure. As can be seen from the figure, the calculated data closely fits the observed data. The other samples have similar refinement results.
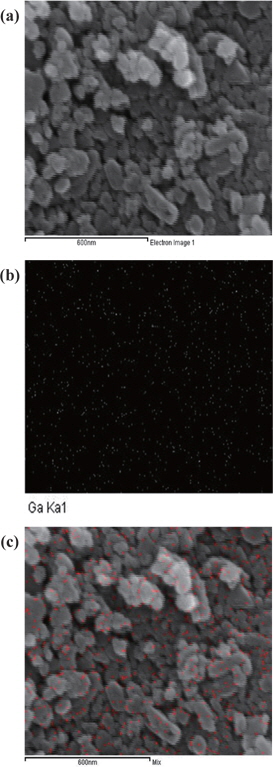
The surface morphologies of the LiFe1−xGaxPO4 powder particles were observed using FE-SEM (Fig. 2(a)). In addition, the gallium distribution information of a LiFe1−xGaxPO4 sample by EDS mapping is shown in Figs. 2(b) and 2(c). The gallium was well dispersed and distributed around the LiFePO4 particles, which allowed the lithium ions to diffuse more easily in the composites, resulting in superior rate capability and higher reversible capacities compared to LiFePO4 particles.
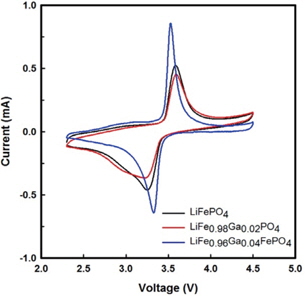
The cyclic voltammograms of Li/ LiFe1−xGaxPO4 batteries at 3rd cycle are shown in Fig. 3. Through CV, the kinetics of lithium intercalation/ deintercalation can be observed. All batteries exhibit oxidation and reduction peaks at around 3.4 V, corresponding to the two-phase charge-discharge reaction of the Fe2+/Fe3+ redox couple. It can be seen that the LiFe0.96Ga0.04PO4 battery delivers a better step in the oxidation-reduction process than the pristine battery. Further, the polarization defined as the potential difference between the oxidation and reduction peaks is reduced with the Ga3+ substitution for Fe2+. The voltage difference between the oxidation and reduction peaks of LiFePO4, LiFe0.98Ga0.02PO4, and LiFe0.96Ga0.04PO4 are 0.33, 0.36, and 0.21 V, respectively. In addition, the current of LiFe0.96Ga0.04PO4 evidently increases to 0.82 mA. These results suggest that kinetic limitations on the electro-chemical redox reaction were excluded with the substitution.
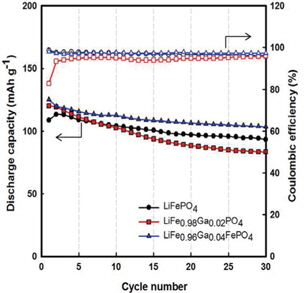
Figure 4 illustrates the cycling performances of Li/LiFe1−xGaxPO4 batteries. Through Fig. 4, we also recognize that Gadoped LiFePO4 shows better performance than LiFePO4, and LiFe0.96Ga0.04PO4 shows the best value of initial discharge capacity (125 mAh g−1) (compared to 113 mAh g−1 for LiFePO4). Further, the Coulombic efficiencies for LiFePO4, LiFe0.98Ga0.02PO4, and LiFe0.96Ga0.04PO4 are 96%, 95%, and 98%, respectively. Here, Ga3+ substitution may induce a Li+ defect in LiFePO4 and residual Fe2+/Fe3+ coexistence state due to the balance of the valence electron. This is because the ion dopant mainly takes the site of lithium, leading to the co-existence of Fe2+and Fe3+ in a single phase, resulting in an improvement in the crystal electronic conductivity and thus inducing the Li+ defect in the LiFePO4 and residual Fe2+/Fe3+ coexistence state [10,11]. Therefore, high discharge capacity and good reversibility were obtained.
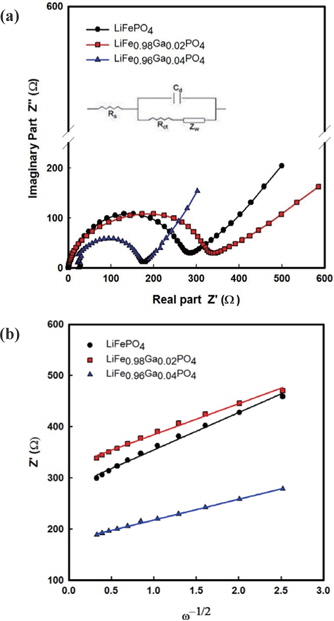
The impedance spectra of the Li/LiFe1−xGaxPO4 batteries at the 3rd cycle are shown in Fig. 5. The semicircles in the high to medium frequency are mainly related to the complex reaction process at the electrolyte/cathode interface. The inclined line in the lower frequency is attributed to the Warburg impedance, which is associated with lithium ion diffusion in the LiFePO4 electrode. The impedance spectra can be interpreted on the basis of an equivalent circuit in which Zw is the Warburg impedance, Rct is the charge-transfer resistance, Cd is capacitance of the electrode/ electrolyte double layer, and Rs is the ohmic resistance. The lithium ion diffusion coefficient is calculated from the following equations [12-14]:
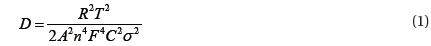
where n is the number of electrons per molecule during the oxidization, A is the surface area of the cathode, D is the diffusion coefficient of lithium ion, R is the gas constant (8.314 J mol−1K−1), T is the absolute temperature, F is the Faraday constant (96485 J), C is the concentration of lithium ion, and σ is the Warburg factor which is related to Z’:

The relation between Z' and the square root of the angular frequency ω−1/2 in the low frequency region is illustrated in Fig. 5(b). Straight lines imply the diffusion of the lithium ions into the layers of materials in the electrode. From the results, the resistance of 283 Ω from pristine LiFePO4 decreases to 170 Ω for LiFe0.96Ga0.04PO4. Further, the diffusion coefficients of LiFePO4, LiFe0.98Ga0.02PO4, and LiFe0.96Ga0.04PO4 are 8.09×10⁻¹⁵, 5.85×10⁻¹⁵, and 1.38×10⁻¹⁴cm2s−1, respectively. This concurs with the CV results.
LiFePO4 powders with partial substitution of Ga3+ for Fe2+ were successfully prepared using a hydrothermal method. Among the as-prepared composites, LiFe0.96Ga0.04PO4 shows the highest reversible capacity of 125 mAhg−1 and a high lithium ion diffusion coefficient of 1.38×10⁻¹⁴cm2s−1. Taking into account all the analysis and results presented above, it can be concluded that the enhancement of electrochemical performance through Ga3+ substitution is attributed to the structure stability, which facilitates the lithium ion diffusion.