Reflective electronic displays using positively and negatively charged particles, such as a quick response-liquid powder display (QR-LPD) and a toner display [1-3], have the following advantages: (1) images can be maintained over a long period of time without additional bias voltage; (2) such a display has a wide viewing angle and a very fast response time; and (3) both the active and the passive matrices can be driven by the intrinsic threshold voltage [4-6]. Despite these obvious advantages, expensive driving boards resulting from a high driving voltage, a short lifetime, and other drawbacks still impede the progress of this technology in the display market. The major factors contributing to the abovementioned problems are mostly related to the movement of charged particles.
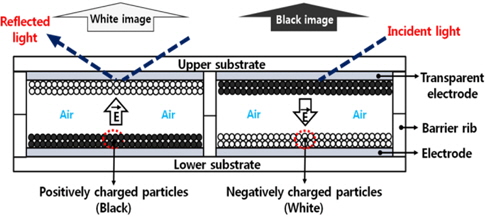
Figure 1 shows the driving principle of a display with a simple panel structure. When the positively and negatively charged particles are in the same cell without any bias voltage, the charged particles exert a Coulomb force (i.e., attractive and repulsive force) and an image force is associated with the charged particles and the conductive electrodes. These forces are in proportion with the value of q/m, where q is the amount of the electric charge of a particle, and m is the mass of the particle [7,8]. Therefore, a force greater than the abovementioned forces is required to move the charged particles. If an electric field sufficient to move the charged particles is applied to the electrodes of the upper and lower substrates, the oppositely charged particles move freely in the opposite direction in air within their respective cells according to the direction of the electric field and then adhere to the electrodes, as shown in Fig. 1 [9]. Subsequently, the charged particles take a long time to detach from the electrodes because of the image force, even when the electric field is no longer applied. However, it is easy for the charged particles to deviate from the initial values of q/m due to friction, even if the charged particles initially have an appropriate range of q/m values that would make them likely to move. The values of q/m vary during the particle-mixture and particle-insertion processes. Additionally, this variation in q/m induces an irregular movement of the charged particles by non-moveable charged particles, including a short lifetime, a high driving voltage, and degradation of the optical properties [8].
In this work, a discharging process is proposed to achieve stable movement of the charged particles and the resultant effect on electrical and optical properties, especially reflectivity and response time.
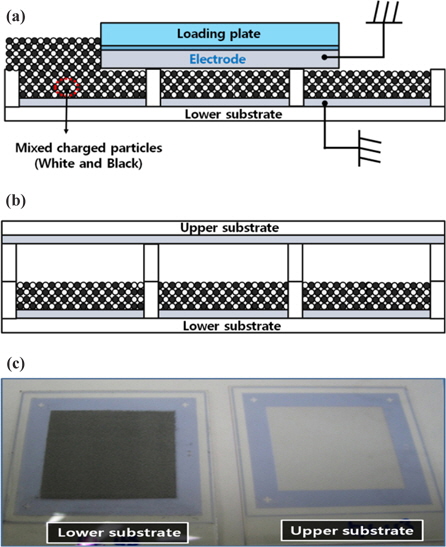
Sample panels for this study are fabricated with an indium tin oxide (ITO) coated glass substrate, where ribs with a height of approximately 55 μm and a width of 5 μm are formed using a photolithographic process [10]; the cell size of the fabricated panels is 100 μm × 100 μm. The fabricated panels were used as the upper and lower substrates, with the same panel structure and defined height as those of the barrier rib in order to control the number of charged particles inserted in their cells. In addition, images were observed by the movement of the charged particles with an optical microscope after biasing the driving voltage and debonding these driven panels. In our experiment, white particles with a negative charge consist of TiO2, negative charge control agents (CCAs), and a polymer, whereas black particles with a positive charge consist of carbon black, positive CCAs, and a polymer. The average diameter of the white and black particles is 10 μm, and their q/m values are -4.5 μC/g and +4.5 μC/g, respectively. In a mixture process, we mixed the charged particles with an agitator to obtain a uniform blend. Mixtures of the oppositely charged particles were inserted into cells of the lower substrates with a simple particle-insertion method. Fig. 2 shows the simple particle-insertion method [7]. The charged particles are inserted with a loading plate, as shown in Fig. 2(a). The upper and lower substrates are then packaged, as shown in Fig. 2(b). In this study, the number of mixed particles was controlled by the height of the barrier ribs on the lower substrate, whereas the barrier ribs of the upper substrate were used to obtain the movable space of the charged particles. The volume of the inserted particles is approximately 50% of the total cell volume, and the total cell gap between the upper and lower substrates is 110 O2m. Fig. 2(c) shows a photograph of the upper substrate (right-hand side) and the lower substrate (left-hand side), where the charged particles were inserted using the simple particle-insertion method shown in Figs. 2(a) and 2(b).
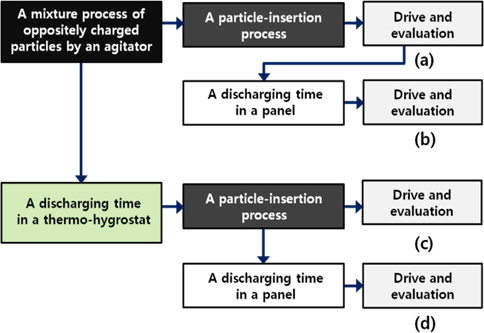
Figure 3 shows the process flow of experiments. In the flowchart, the term “discharging time” indicates the time for which the charged particles were kept in a thermo-hygrostat immediately after mixing the oppositely charged particles or the time for which the charged particles were kept in a panel before the driving process. The sample panels consist of four parts that can be used to compare the movement of the charged particles by varying the discharging time and place. First, the panel described in Fig. 3(a) is driven without any discharging time, after mixing the charged particles. Second, the panel shown in Fig. 3(b) is driven with a discharging time, after the first driving process shown in Fig. 3(a). Third, the panel shown in Fig. 3(c) is driven after the charged particles are given a discharging time in a thermo-hygrostat, before the particle-insertion process. Finally, the panel shown in Fig. 3(d) is driven after the charged particles are given a discharging time, before and after the particle-insertion process. For the processes shown in Figs. 3(a) and 3(b), we prepared only one panel sample. For the process shown in Fig. 3(b), the reflectivity of this panel was measured at the discharging times of 1, 2, 4, 8, 16, 32, and 40 hours in the panel after the panel was driven without the discharging time by the process shown in Fig. 3(a). The results of this experiment are shown in Fig. 4. For the process shown in Fig. 3(c), we prepared 8 panel samples. After the charged particles were given discharging times of 0 (no discharging time), 1, 2, 4, 8, 16, 32, and 40 hours, these discharged particles were inserted in the lower substrate separately. The respective reflectivity of these panels was immediately measured without the discharging time. To obtain the optimum discharging condition of the charged particles in a thermo-hygrostat and a panel, the process shown in Fig. 3(d) is carried out with different discharging conditions as shown in Figs. 3(a)~3(c). For control of the temperature and humidity, an automatic thermohygrostat was used within the range of −20 ~ 120℃ and 95%, respectively. We ascertained the most effective discharging condition only for this experimentation of the temperature of 60℃ and the humidity of 90%.
Although all of the white and black particles were fabricated with similar values of q/m, these values can be changed by friction with the oppositely charged particles in the mixture process [11,12]. If the charged particles deviate from the appropriate range of the q/m values, for most of the particles to move with the same driving voltage, the charged particles will show an irregular movement because of the obstruction of their movement. Moreover, the electrical and optical properties of the panel must be degraded with a short lifetime [7,8].
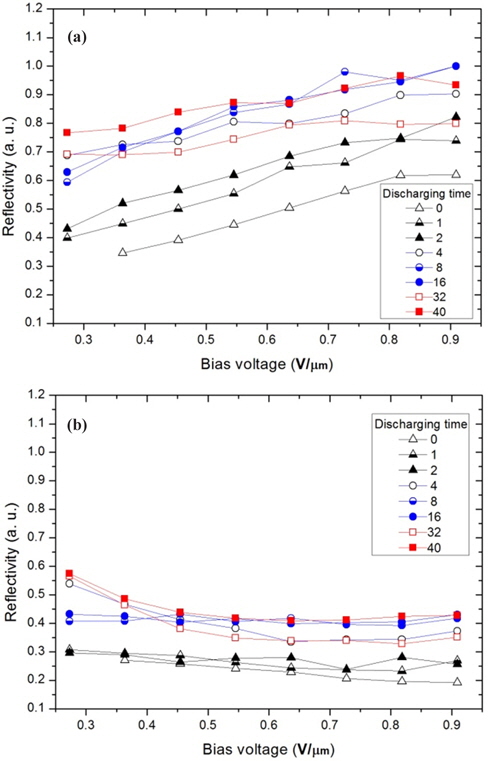
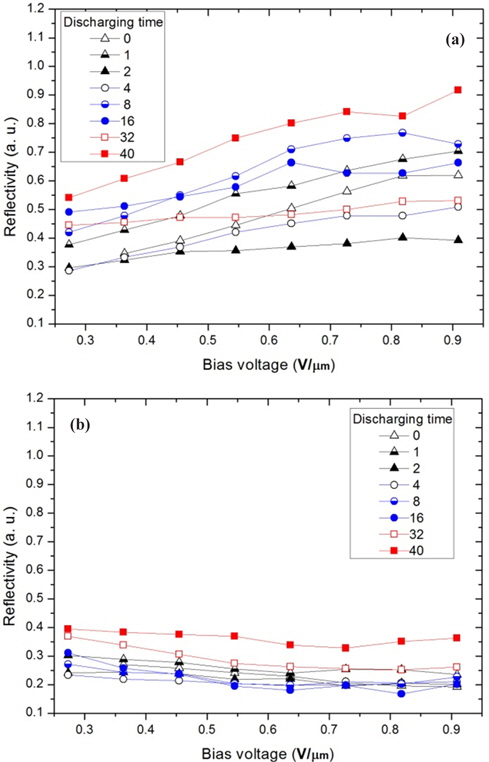
In this study, the variation of the movement of the charged particles is analyzed with reflectivity, which is measured from the moved particles on the electrode of an upper substrate occupied by the charged particles [1]. Fig. 4 shows the reflectivity depending on the process shown in Figs. 3(a) and 3(b). The mixing ratio of the white and black particles was 1:1, and the charged particles were immediately inserted without any discharging process in a thermo-hygrostat. Subsequently, the panel was immediately driven according to the process shown in Fig. 3(a). Next, this panel was again driven with seven discharging durations of 1, 2, 4, 8, 16, 32, and 40 hours using the process shown in Fig. 3(b). Thus, the discharging process was carried out only in this panel. Fig. 4(a) shows the reflectivity of the white image and Fig. 4(b) shows that of the black image according to the bias voltage.
As reported in a previous study, the reflectivity of the reflective e-paper, QR-LPD, is proportional to the bias voltage, as shown in Fig. 4, and presents the ratio of the moved white and black particles on the electrode in a cell by an electric field [7,13]. In Figs. 4(a) and 4(b), the reflective data are divided into two parts: up to 2 hours and after 4 hours. For discharging times up to 2 hours, the reflectivity of the white image increases with the discharging time, but reaches a saturation value with some fluctuation after 4 hours. This trend is similar to that shown in the black image in Fig. 4(b) and is not coincident with the reported data, in which the reflectivity of the black image decreases while that of the white image increases. In this figure, some analysis is needed to show that the reflectivity of the black image increases with that of the white image.
To explain this phenomenon, many suppositions are possible. For example, the white particles move faster with a larger kinetic energy than the black particles after the discharging time (>4 hours); therefore, the black particles are involved in the movement of the white particles. We are not completely certain of this explanation. However, it is certain that the simultaneous increase in the reflectivity of the white and black images is induced by an imbalance or non-neutralization of q/m (charge per mass for a particle) for the white and black particles. It has been reported that the existence of particles that deviate from the normal range of the q/m values induces non-moving particles and undesirable optical properties [7]. Additionally, we assume that the electrically well-defined particles can temporarily be changed to the deviated particles from the normal range of q/m during the particle-insertion process, in which particles can gain or lose charge by friction. Therefore, it is important that the particles obtain an intrinsic q/m value and approach an electrical balance or neutralization in their cell, which is an objective of this study.
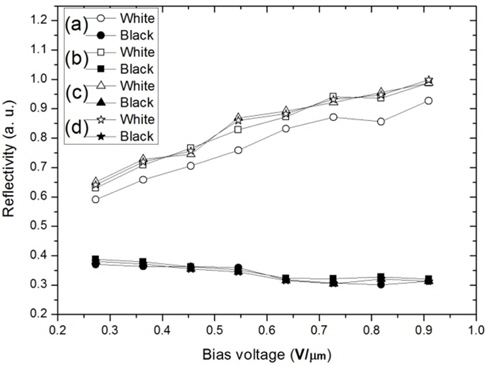
Figure 5 shows the reflectivity of the white image (a) and black image (b) according to the electric field for the panel discharged using the case shown in Fig. 3(c), in which the discharging process was performed only in a thermo-hygrostat prior to the particle-insertion process. Unlike the results shown in Fig. 4, a saturation region and a linear increase according to discharging time in the thermo-hygrostat are not found. Also, the reflectivity of both white and black images increased sharply in the case of the panel of which charged particles had the discharging time of 40 hours. From the result shown in Figs. 4 and 5, it is possible that the discharging process only in the thermo-hygrostat without the discharging time in a panel is meaningless, although the discharging process in the thermo-hygrostat may further significantly improve the optical property.We believe that most of the charged particles throughout the particleinsertion process have been electrically changed and induce an irregular reflectivity, as shown in Fig. 5. We therefore considered a discharging process in a thermo-hygrostat and in a panel together as shown in Fig. 3(d).
To improve the electrical neutralization of the charged particles in a cell, we proceeded with both discharging processes in a thermo-hygrostat and a panel as shown in Fig. 3(d). Fig. 6 shows the results of this experimentation. For this experimentation, we prepared 4 panels, of which the inserted particles were commonly discharged for 40 hours in the thermohygrostat, and the reflectivity was measured according to the discharging time of 1, 4, 10, and 40 hours in each panel. All the panels were driven for the first time after the discharging time passed, which differs to the experimentation of Fig. 4. From the results of this experimentation shown in Fig. 6, we ascertained that the reliable optical saturation with reproducibility is obtained after a discharging time of 4 hours in the panel, besides the discharging time of 40 hours before the particle-insertion process.
We believe that the discharging process in a thermo-hygrostat and a panel induces an electrical balance or neutralization of the charged particles in a cell so that their optical properties are improved. We also believe that the discharging process must be regarded in the fabrication process of the charged particles and in the particle-insertion process at panel fabrication.
It is easy to change the values of q/m of the charged particles by the application of friction, particularly from the mixture process to the particle-insertion process, so that the electrical and optical properties of the display are degraded by the unmoved particles that deviated from the appropriate range values of q/m. Further, the lifetime can be shorter with the irregular movement due to the unmoved charged particles. Hence, the charged particles must have sufficient discharging times before the driving process to obtain the stable movement due to the charged particles which achieved an ideal electrical balance or equilibrium with discharging times in a thermo-hygrostat. For future research, discharging the electronic ink such as by using a temperature variation or biasing this ink with electrical grounding will be important.