수소를 환원제로 사용한 산화철의 유동 환원에서, 환원율에 대한 다양한 공정 변수를 통해 산화철의 하나인 적철광의 환원 거동을 면밀히 관찰하였다. 본 연구를 위해 특별히 설계된 실험실 규모의 유동층 장치에서 목적으로 하는 환원 특성에 대한 가스 속도, 환원 시간 및 온도의 최적 값을 평가 하였다. 최적의 환원율을 나타낸 온도는 750 ℃, 환원 시간은 30분이며 이들을 다음의 시험을 위한 시작점으로 매개 변수 값을 설정 하였다. 가장 높은 관심을 갖는 변수들 중 하나는 가스의 소비 원단 위로, 이는 최적의 조건에서 산화철 1톤을 기준하여 90% 이상의 환원율을 달성하기 위해 요구되는 가스의 양을 말한다. 이 매개 변수는 실험실 수준 장치의 스케일 엎에 있어서 중요한 인자이며, 본 연구를 통해 1,500 Nm3/ton-ore가 산화철이 가장 높은 환원율을 갖기 위한 최적의 가스 소비 원단위 임을 확인하였다.
Traditional iron making industry is well known to be one of the most serious courses of CO2 emissions. The CO2 generation is a great challenge for the operators of the blast furnace especially. In blast furnaces iron ore is fed together with coke to produce pig iron. To cope with the problems in traditional furnaces, new processes of iron making are in use recently and fewer are in development. Direct reduction (DR) process is one of them and is characterized as a CO2 free iron making process. This process is utilized commercially in industry and uses gas, compounds consisting of CO and hydrogen for direct reduction of iron ore. A process called MIDREX is well established and has been operated alongside the blast furnace to deliver iron for steel making electric arc furnace, Chatterjee[1]. A detail review of the DR processes available can be found in Schenk[7]. At the early stage of research on DR authors in Turkdogan and Vinters[2], Turkdogan et al.[3] and Turkdogan and Vinters[4] have studied detail aspects of the gaseous reduction of iron oxides with focus on the iron ore pore structure and its effects on the reduction rate.
Direct reduction is a process which takes place without changing the phase of the raw material, different from blast furnace process where the iron ore is melted to reach the pure iron as a product. Direct reduction, as other reactions are, is dependent on the reduction rate. Reducibility is the measure of the metallization of iron ore by removing the oxygen and forming gaseous compounds. In the literature Chatterjee[1] there are several parameters or variables mentioned as responsible parameters for the reduction rate such as the pore size of the iron ore particles, particle shape, porosity, crystal structure and composition. The above mentioned parameters are related to the iron ore structure. Temperature, reducing gas flow velocity, iron ore sample amount and the gas flow rate are among operating conditions with the impact on the reproducibility discussed in numerous studies, where these operating parameters were varied to achieve the optimal iron ore direct reduction parameters. The key aim is to find the parameter which is mainly responsible for reduction rate control. Authors in the work Turkdogan et al.[3] found that gas diffusion in porous layer of the iron ore particles played a significant role on the reduction rate control.
In numerous studies researchers have applied pure hydrogen as reducing agent in direct reduction. Authors Pang et al.[5] have utilized a fluidized bed for reduction of iron ore by hydrogen. They have reported that the process is able to reach high reduction rates by increasing the gas velocity or reaction time. Temperature was found to be optimal in the range 700 to 750 ℃.
Reduction of hematite in fluidized bed reactor was demonstrated also by authors in Feilmayr et al.[7]. The authors have reported the effect of the temperature and residence time on the reduction rate. They found that the reducibility is strongly dependent on the iron ore particle characteristics.
Researchers Ranzani da Costa et al.[6] have conducted experimental study on the hydrogen steelmaking process and developed a reduction model. Hematite cubes were used for the experiments. In their work they found that the hydrogen, compared to CO, as reducing agent exhibited an acceleration of the reduction process indicating a possibility to reduce the rector size compared to the current DR facilities and help reducing the CO2 emissions by more than 80%.
In this study, numerous tests have been conducted in order to evaluate the effect of the main parameters on the reduction process. Hematite samples were prepared and tests were conducted using a lab scale fluidized bed reactor. The main aim was to find out as to which extent these parameters influence the DR process and find out their effect on the hydrogen gas consumption rate, which would help the scale up process.
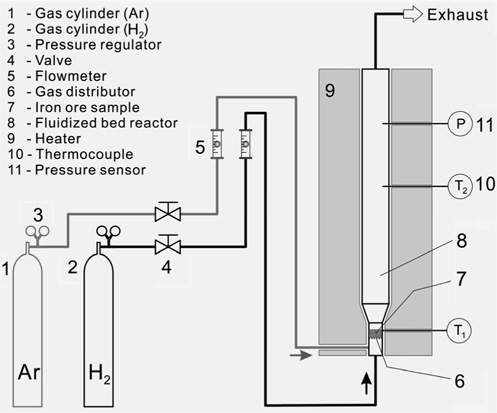
Tests were performed using a lab scale fluidized bed unit depicted in the Figure 1. Test unit consists of following functional units: gas feeding unit consisting of the gas container for argon (1) and hydrogen (2), pressure controller (3), valve (4) and flow meter (5); lab scale fluidized bed reactor (8) with heating unit (9), thermocouples (10) and pressure sensors (11). Samples (7) were loaded inside the bottom part of the reactor placing the sample on the 20 mm perforated gas distributor (6) with 1.5 mm holes and open ratio of 41.6%.
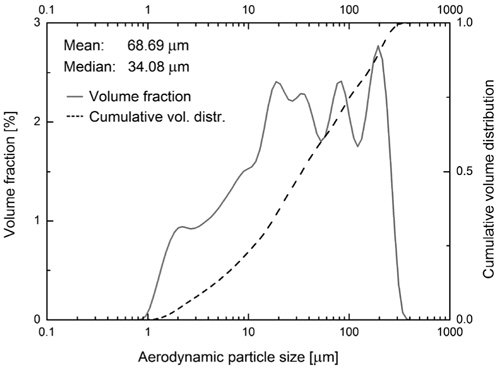
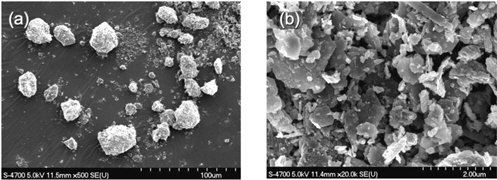
Hematite of type Mt. Newman (Feilmayr et al.[7]) was used as the ore sample and hydrogen as reducing agent. Argon was used for the initial phase of heating of the test unit. For the reduction process hydrogen was used. Hematite samples were taken directly from the yard and screened in a mesh of the size 300 m. Hematite particle size and distribution was measured using Particle Size Distribution Analyzer (TSI, model 3603) and the data are displayed in the Figure 2. Scanning electron microscope (SEM) images in the Figure 3 show the particle size and a magnified structure of a single particle.
2.3. Experimental procedure and conditions
In a batch type process, hematite samples are placed inside the test unit. The unit is tightly closed and the heating process is started. During the heating process argon gas was used with temperature increasing rate of 10 ℃/min at the flow rate of 1 L/min. Gas flow rate was controlled using rotameters and pressure regulators on the gas cylinder. When the reaction temperature was reached the injection of gas was switched from argon to hydrogen. Temperature sensors were installed to control the heating of the reactor. In this study the temperature range was between 500 and 900 ℃. After the test the reactor was cooled down to ambient temperature without purging with gas. Sample amount was varied between 80, 100 and 140 g. Samples of hematite and reduction products were investigated by X-ray diffraction (XRD) and SEM.
The reduction rate was calculated by measuring the oxygen content in samples before and after the test. The method is based on the Korean standard KS E ISO2597-1:2007[8] and describes

where O2 (b), O2 (a) stand for oxygen content before and after the reduction of iron ore.
In the Table 1 the test conditions are listed. All the tests were conducted at the same room conditions by varying the test parameters of interest such as gas flow rate, sample amount, reaction temperature and reaction time.
[Table 1.] Hematite hydrogen reduction tests conditions
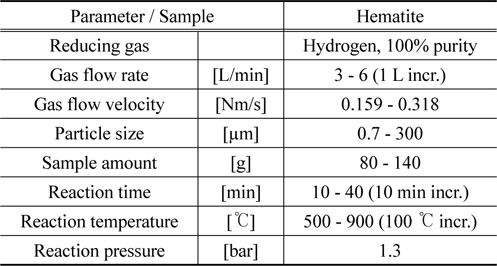
Hematite hydrogen reduction tests conditions
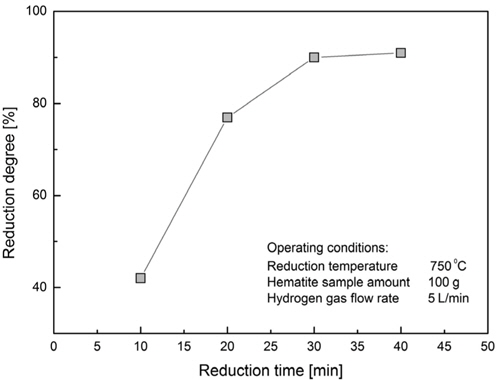
The effect of reaction time on the reducibility of the hematite sample is demonstrated and the results show an optimum reaction time of 30 minutes (Figure 4). This value of reduction time was used for further tests as the optimal reduction time to observe the effects of other parameters. After this optimal time the reduction rate starts slowing, showing almost no increase for further reduction. This phenomenon is observed in the work of Zhu et al.[9] where the reduction rate starts slowing at the time of 30 minutes, although the authors did performed the test at the temperatures less than 550 ℃.
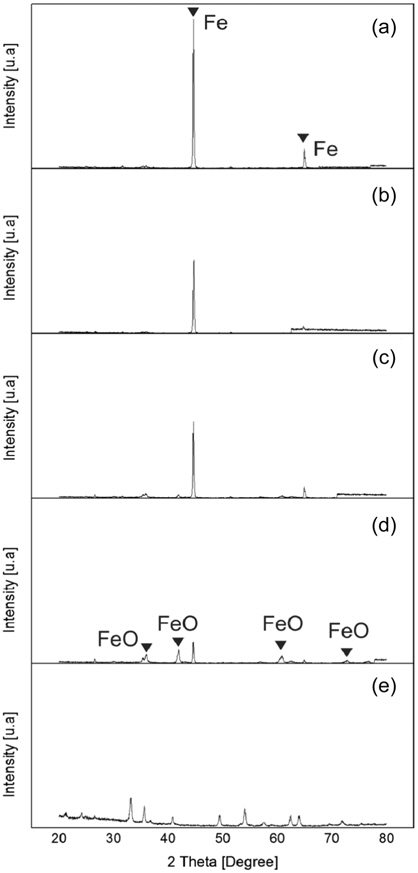
XRD images of the samples after hydrogen reduction show the change in the peak structure of the samples according to the reduction time. Also, it is clear from the images that the peaks representing wustite and hematite in Figure 5 (d) and 5 (e) are diminished in the Figures 5 (a) to 5 (c). At the reduction time of 20 minutes there are small but noticeable peaks of wustite present. The drastic reduction of wustite peak intensity and increase of two Fe peak intensity with the increase of reduction time confirms the impact on the iron ore reduction. Similar findings are found in previous study Pang et al.[5] showing the peaks of the Fe rising clearly with increasing of the reduction time.
3.2. Reduction temperature effect
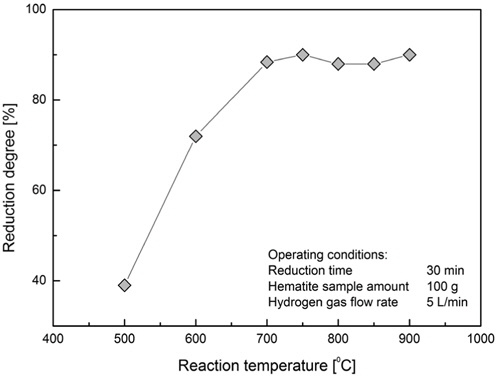
The reducibility of a sample of 100 gram hematite as function of reaction temperature during the reduction time of 30 minutes is shown in Figure 6. The reduction rate increased until the temperature of 750 ℃. As the temperature was further increased the reduction rate started falling slightly and raised again as the temperature increased over 850 ℃. This phenomenon is observed in the early study Turkdogan and Vinters[2]. In the research work Ranzai da Costa et al.[6] the reason for slowing the reduction rate at the temperatures higher than 800 ℃ was mentioned the structure of the iron formed at these temperatures which is denser, having thinner and lesser pores. Reducing of pore volume and the number of pores has an impact on the gas diffusion through iron pores and contribute to low reduction rates. Authors in this work suggest the optimal temperature of 800 ℃ for the highest reduction rate in lesser time. In our tests we could confirm an optimal temperature, where the reducibility exhibits highest value, to be round 750 ℃ as displayed in the Figure 6.
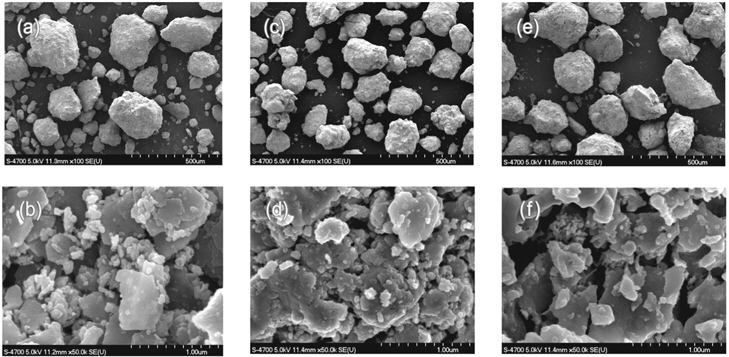
After the test SEM images were made by examining the samples after being reduced at certain temperature by keeping the reaction time and hydrogen flow rate the same. The particle shape is almost identical for all samples reduced at different temperatures (Figures 7 (a), 7 (c), 7 (e)). The magnified images reveal the differences in the structure of the sample particles showing more porous and isolated particle bulk connected for the reduction temperature of 500 ℃ (Figure 7 (b)) and a more connected structure with less pore structure for temperatures 750 ℃ (Figure 7 (d)) and 900 ℃ (Figure 7 (f)). This is an evidence for the sintering of the iron ore particles as the temperature is set above 850 ℃ as stated in the section above and in the literature Ranzai da Costa et al.[6].
3.3. Superficial gas velocity effect
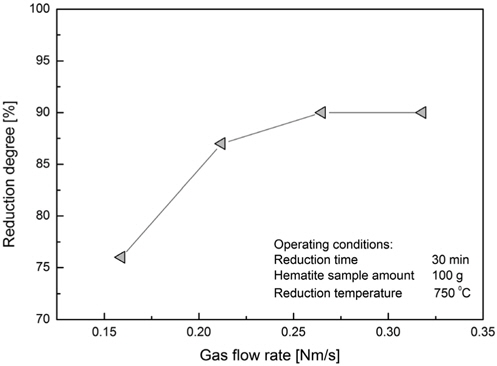
The following test was conducted by keeping the reduction time and temperature fixed and by varying the superficial gas velocity. The highest reduction rate value was reached at the 0.28 Nm/s of superficial gas velocity (Figure 8). This can be explained that for the same amount of hematite mass flow rate of the reducing agent is increased and the reaction rate is accelerated but a further increase of gas velocity would not help increasing the reaction rate due to saturation. The amount of hematite sample was 100 g and the reaction time was fixed at 30 min. Temperature was fixed at 750 ℃.
3.4. Hematite sample amount effect
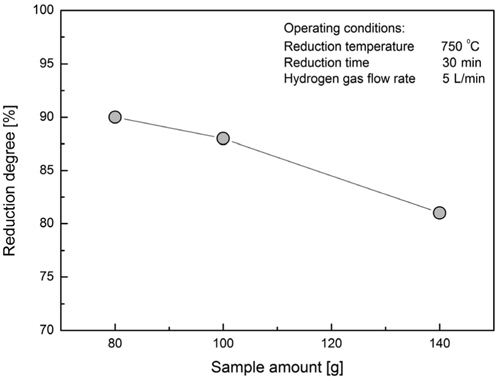
The amount of hematite sample was varied between 80, 100 and 140 g as shown in the Figure 9. It was found that the optimal amount of hematite for the given dimensions of the lab scale fluidized bed is 80 g. At the flow rate of 5 L/min, 750 ℃ and reduction time of 30 min the reduction rate was round 90%. For the sample of 140 g the reduction rate was 10% lower. For the same given dimensions of the reactor, the increase of sample amount would translate in the increase of the bed height. The flow of the reducing gas through the hematite bed is considered laminar and the residence time of the reducing gas inside the bed is increased with the height of hematite bed.
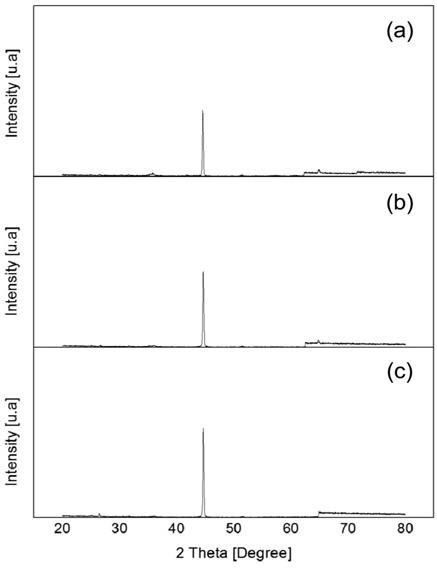
As the sample amount is varied the iron peak intensity is decreasing with the increase of the sample amount as it is shown in the Figure 11 (a) to 11 (c). This findings indicate that the amount of sample facing the same flow rate will react with less hydrogen and thus the rate of reduction lower for large amount of ore. The Fe peak intensity exhibits highest value for the sample amount of 80 g indicating the highest reduction rate. The real oxygen content measurement reveal the sample of 80 and 100 g exhibit almost similar reduction rate.
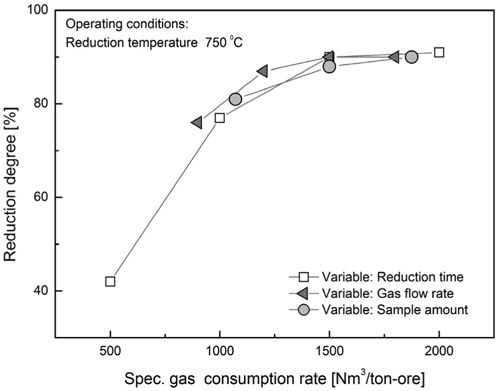
3.5. Estimation of reducing gas consumption rate
The rate of reducing gas consumption to the amount of hematite was calculated based on the parameters reduction time, reducing gas flow rate and the sample amount. To evaluate separately the effect each parameter on the reduction rate, one of the parameters was varied by keeping others fixed.
For the reduction time of 30 minutes and the hematite sample amount of 100 g the gas consumption varies according to the flow rate. For the gas consumption values the reduction rate changes from 76 to 90% where a saturation is visible when the flow rate is increased above 5 L/min.
The parameter with the most significant impact on the reduction rate is found to be the reduction time. When the time is set as 30 minutes the reduction rate reaches 90%. After this point the effect of reduction time is diminished.
By varying the amount of the reducing gas, reduction degree as function of the specific gas consumption rate at the reducing temperature 750 ℃ reaches the value of 90% for the amount of 80 g. This indicates that if less sample is to be reduced the gas consumption values increase but the reduction ratio increases.
The samples of the hematite were investigated to estimate the gas consumption rate for given amount of the ore to be reduced. Results show that temperature effect is well conform with the results from other research works and confirms the temperature range at which the reduction rate can be seen as the highest. In XRD images we could find evidence of the impact of reduction parameters by viewing the intensity peaks on diagrams.
For the given geometry of the test fluidized bed the reduction time of 30 minutes and temperature of 750 ℃ are considered optimal for reaching a reduction rate of over 90%. For these conditions the variation of the sample amount and flow rate result in an optimal gas consumption rate of 1500 Nm3/ton-ore. The gas consumption rate is considered in this work as the most important parameter. For the scale-up purpose the data from these test can be very useful to calculate the fluidized bed dimensions and gas consumption rate. After enlargement of the test facility further tests are required to confirm the data presented in this study.