검색 전체 메뉴
PDF
맨 위로
OA 학술지
Condurango (Gonolobus condurango) Extract Activates Fas Receptor and Depolarizes Mitochondrial Membrane Potential to Induce ROS-dependent Apoptosis in Cancer Cells in vitro
  • 비영리 CC BY-NC
  • 비영리 CC BY-NC
ABSTRACT
Condurango (Gonolobus condurango) Extract Activates Fas Receptor and Depolarizes Mitochondrial Membrane Potential to Induce ROS-dependent Apoptosis in Cancer Cells in vitro
KEYWORD
apoptosis , condurango extract , cytotoxicity , G0/G1 arrest , reactive oxygen species
  • 1. Introduction

    The incidences of different types of cancer are rapidly increasing throughout the world, despite the advancements that are being made in various forms of therapy and the use of newer drugs [1]. To date, chemotherapy and radiation therapy have been the most common approaches used in cancer therapy. These approaches target and rapidly destroy growing cells in the body; however, normal healthy cells are also impacted, thus causing undesirable side effects [2]. Finding an effective remedy that is relatively non-toxic is desirable. The literature on folk and regional medicine has relied on the use of naturally derived products, mostly plants such as green tea (containing epigallocatechin-3-gallate) [3] and turmeric (containing quercetin and berberine), that have been found to be beneficial in cancer treatment [4]. Condurango (Marsdenia condurango), a plant inhabiting Ecuador and Peru and commonly known as condor vine [5], is one such medicinal plant whose bark extract (“mother tincture”) has been traditionally used in homeopathy as a treatment agent for stomach cancer [6]. Condurango extract (CE) is also used as an appetite stimulating agent and has relatively few side effects when taken at the recommended doses. In addition, in animal studies, CE has been documented as having anti-inflammatory actions [7]. The active constituents of CE are glycoside based condurangogenins, known as condurango glycosides [8]. Recently, a study found CE to be capable of reducing tumor burden in experimental mice [9]; that work, however, did not shed any light on its mechanism of action. In our earlier study [10], we demonstrated the apoptosis inducing ability of CE in lung cancer cells and determined the dose range for CE to have a potent effect. The active constituents of CE include quercetin, caffeic acid, cinnamic acid, coumarins, rutosides, and saponarin [11]. In a separate study [8], we demonstrated that condurango glycoside A, another active ingredient of CE, showed a relatively enhanced capability to induce apoptosis through the generation of reactive oxygen species (ROS) in the cancer cells.

    Our findings in this study were, in brief, that CE was able to induce prominent cytotoxicity against the human cervical cancer (HeLa) cells and generate ROS. CE led to depolarization of the mitochondrial membrane’s potential. Also, CE was capable of modulating fas receptor (FasR) levels and down regulating tumor necrosis factor alpha (TNF-α) and nuclear factor kappa-light-chain-enhancer of activated B cells (NF-κB) expressions at doses that induced apoptosis in the HeLa cells.

    2. Material and Methods

    The viability of the test cells were checked by using the 3-(4,5-dimethylthiazol-2-yl)-2,5-diphenyltetrazolium bromide (MTT) assay. We used non-cancer cells, liver (WRL- 68), and mouse peripheral blood mononuclear cells (PBMCs) as controls.

    An ethanol extract of Condurango (Gonolobus condurango) was procured from Boiron Laboratory®, France. Before treatment, the alcohol containing part of the drug was allowed to evaporate by drying at 40°C. The desired amount of dried Condurango was then made soluble by sonication in ice cold Dulbecco's Modified Eagle Medium (DMEM) or Roswell Park Memorial Institute medium (RPMI-1640), with care taken not to raise the temperature of the mix. This mix was made fresh before use. The medium without a drug was served as a control.

    HeLa cells, human prostate cancer cells (PC3) and human normal liver cells (WRL-68) were procured from the National Centre for Cell Science (NCCS, India), and were kept in a humidified, ─ 37ºC incubator (ESCO Medical, Singapore) maintained at 5% CO2 and ambient O2 levels. Cells were processed and harvested by using 0.025% trypsin-Ethylenediaminetetraacetic acid (EDTA) (Gibco, U.S.A.) in phosphate buffer saline (PBS) solution. PBMCs were isolated from mice by using the conventional ficoll gradient method [12].

    Cells dispensed in 96-well flat bottom microtiter plates (Tarsons, India) at a density of 1 × 10³ cells per well were treated with various concentrations of CE (range: 15 to 180 μg/mL) and were allowed to incubate for 24 hours. MTT reagent was purchased from Sigma, U.S.A., and was used according to the manufacturer’s recommendation. Briefly, MTT was added at 10 μM to each well, and the plates were then incubated for a minimum of 2 hours at 37ºC in the dark. The reaction was then stopped, and the color was allowed to develop. The optical density (OD) was taken at 595 nm in a microtiter plate reader (Thermo, U.S.A.). Experiments were performed in triplicate, where each group was six in number.

    For the quantitative estimate of the intra-cellular ROS generation in viable cells after drug treatment, cells were fixed in 70% chilled methanol and incubated with RNase-A (Novagen, U.S.A.) at 5 μg/mL. The RNase-A treated cells were then incubated with 10-μM 2',7'-dichlorodihydrofluorescein diacetate (DCFDA) and 5-μM propidium iodide (PI) together for 30 minutes at room temperature in the dark. Then, the fluorescence intensity of the viable cells (PI-positive cells) was measured by using the frequency lavatory-1 higher (FL-1H) filter of a flow cytometer (Becton Dickinson, fluorescence activated cell sorter (FACS) Calibur, BD, U.S.A.). Data were analyzed by using Cyflogic software (CyF, Finland). For the determination of mitochondrial membrane’s depolarization, the cells were stained with rhodamine 123 after harvesting and fixation. Then, the extent of mitochondrial depolarization in the stained cells was measured by using the FACS calibur flow cytometer with the FL-1H filter.

    The CE treated (0, 8, 16, 24 hours) cells were fixed in 70% chilled ethanol. The fixed cells were then treated with 10-mM RNase-A for 10 minutes in the dark at 37ºC. The RNase-A-treated cells were then stained with PI (10 μM, Sigma, U.S.A.) for 20 minutes. The fluorescence intensities were determined by using the flow cytometer with a FL-2A filter. Data were analyzed by using CyF software.

    For the evaluation of the apoptosis process by using flow cytometry, the treated and the control cells were harvested in PBS and then kept in 5-μg/mL RNase-A for 10 minutes in the dark at room temperature. Then, the cells were incubated in the binding buffer for annexin V assay. The binding buffer was composed of 10-mM 4-(2-hydroxyethyl)- 1-piperazineethanesulfonic acid (HEPES, pH 7.4), 150- mM Sodium chloride (NaCl), 5-mM Potassium chloride (KCl), 1-mM Magnesium chloride (MgCl2) and 1.8-mM Calcium chloride (CaCl2). For the apoptosis analysis, the treated and the control sets were then treated with annexin V and PI according to the manufacturer’s protocol (Santa Cruz Biotechnology, U.S.A.). The fluorescence intensities were determined by using the FACS Calibur, BD flow cytometer with the FL-1H filter for annexin V staining and the FL-2A filter for PI staining.

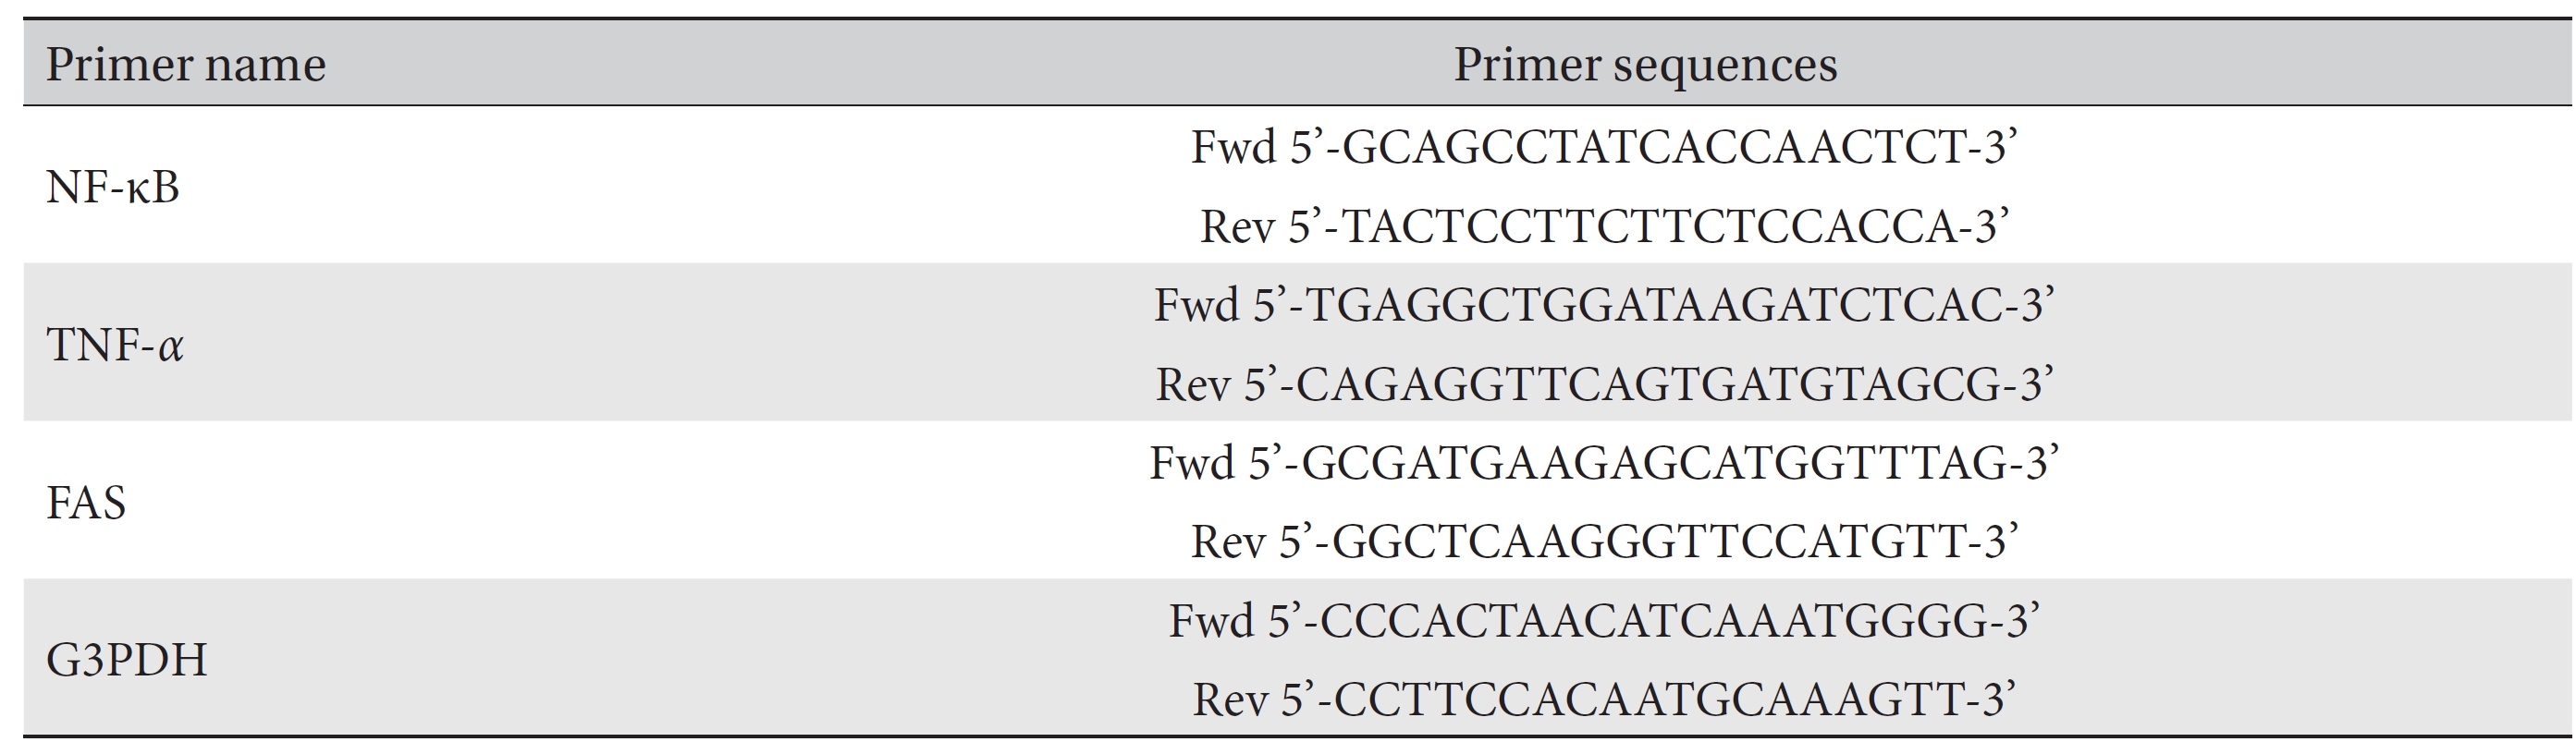
    Total Ribonucleic acid (RNA) was extracted from the drug treated and the controlled sets of HeLa cells by using Trizol reagent according to the manufacturer’s instructions (Hi- Media, India), and the gene expressions were analyzed by using a semi quantitative reverse transcriptase-polymerase chain reaction (RT-PCR) and the Eppendorf Master Cycler (Eppendorf, Germany) [13]. Glyceraldehyde 3-phosphate dehydrogenase (GAPDH) served as housekeeping gene for normalization (Table 1).

    To isolate total cellular protein, we washed the treated and the control cells twice with ice cold PBS and we prepared cell lysate by using lysis buffer (10-mM Tris-hydrogen chloride (HCl, pH 7.4), 1-mM MgCl2, 1-mM EDTA, 0.1-mM phenylmethanesulfonyl fluoride (PMSF), 5-mM β-mercaptoethanol, 0.5% 3-[(3-cholamidopropyl)dimethylammonio]- 1-propanesulfonate (CHAPS), 10% glycerol and a cocktail of protease inhibitors in tablet form from Roche, Switzerland). Cell lysate was cleared by centrifugation at 5,000 g for 20 minutes at 4°C. The required amount of protein lysate was denatured by using sodium dodecyl sulfate-polyacrylamide gel electrophoresis (SDS-PAGE) buffer and subjected to 12% electrophoresis. The separated proteins were transferred onto polyvinylidene fluoride (PVDF) membrane (Millipore, U.S.A.), followed by blocking with 3% bovine serum albumin (BSA) (w/v) in Tris-buffered saline and Tween 20 (TBST) (10-mM Tris, 100-mM NaCl, 0.1% Tween 20) for 1 hour. The PVDF membrane was probed with anti-p21, anti-cyclin D1, anti-cyclin- dependent kinase 1 (CDK1), anti-protein kinase B (Akt), anti-pAkt, anti-B-cell lymphoma 2 (Bcl-2), anti-Bcl2 Antagonist X (Bax), anti-Fas, anti-NF-κB, anti-TNF-α and anti-beta actin (Santa Cruz Biotechnology, U.S.A.) overnight at 4°C and then was incubated for three hours with anti-mouse Immunoglobulin G (IgG) secondary alkaline phosphatase antibody (Sigma, U.S.A.) and developed by using a 5-bromo-4-chloro-3-indolyl-phosphate-nitro blue tetrazolium (BCIP-NBT) kit (Merck, U.S.A.). All antibodies were anti-mouse IgGs. The densitometry was quantified by using ‘image J’ software (National Institutes of Health, U.S.A.).

    For indirect staining, cells were suspended in ice cold PBS with 10% fetal bovine serum (FBS) and 1% sodium azide. Anti-Fas primary antibody was added at 10 μg/mL; then, the cells were incubated at room temperature for 30 minutes. Cells were then incubated with 2-μg/mL fluorescein isothiocyanate (FITC)-tagged anti-mouse secondary antibody for 20 minutes in the dark. Fluorescence was measured by using flow cytometry with FL-IH filters. Data were analyzed with Cyf software. For the cytochrome c assay, cells were lysed in lysis buffer, and the lysates were transferred at 50 μg of protein per previously coated 96-well plate [14]. The indirect enzyme-linked immunosorbent assay (ELISA) method was performed according to manufacturer’s protocol (Santa Cruz Biotechnology, U.S.A.).

    Experiments were performed in triplicate, and statistical analyses were performed by using the one-way analysis of variance (ANOVA) with least significant difference (LSD) post-hoc tests and SPSS.20 software (IBM, U.S.A.). Results were expressed as means ± standard errors (SEs). P-values of less than 0.05 were considered significant.

    3. Results

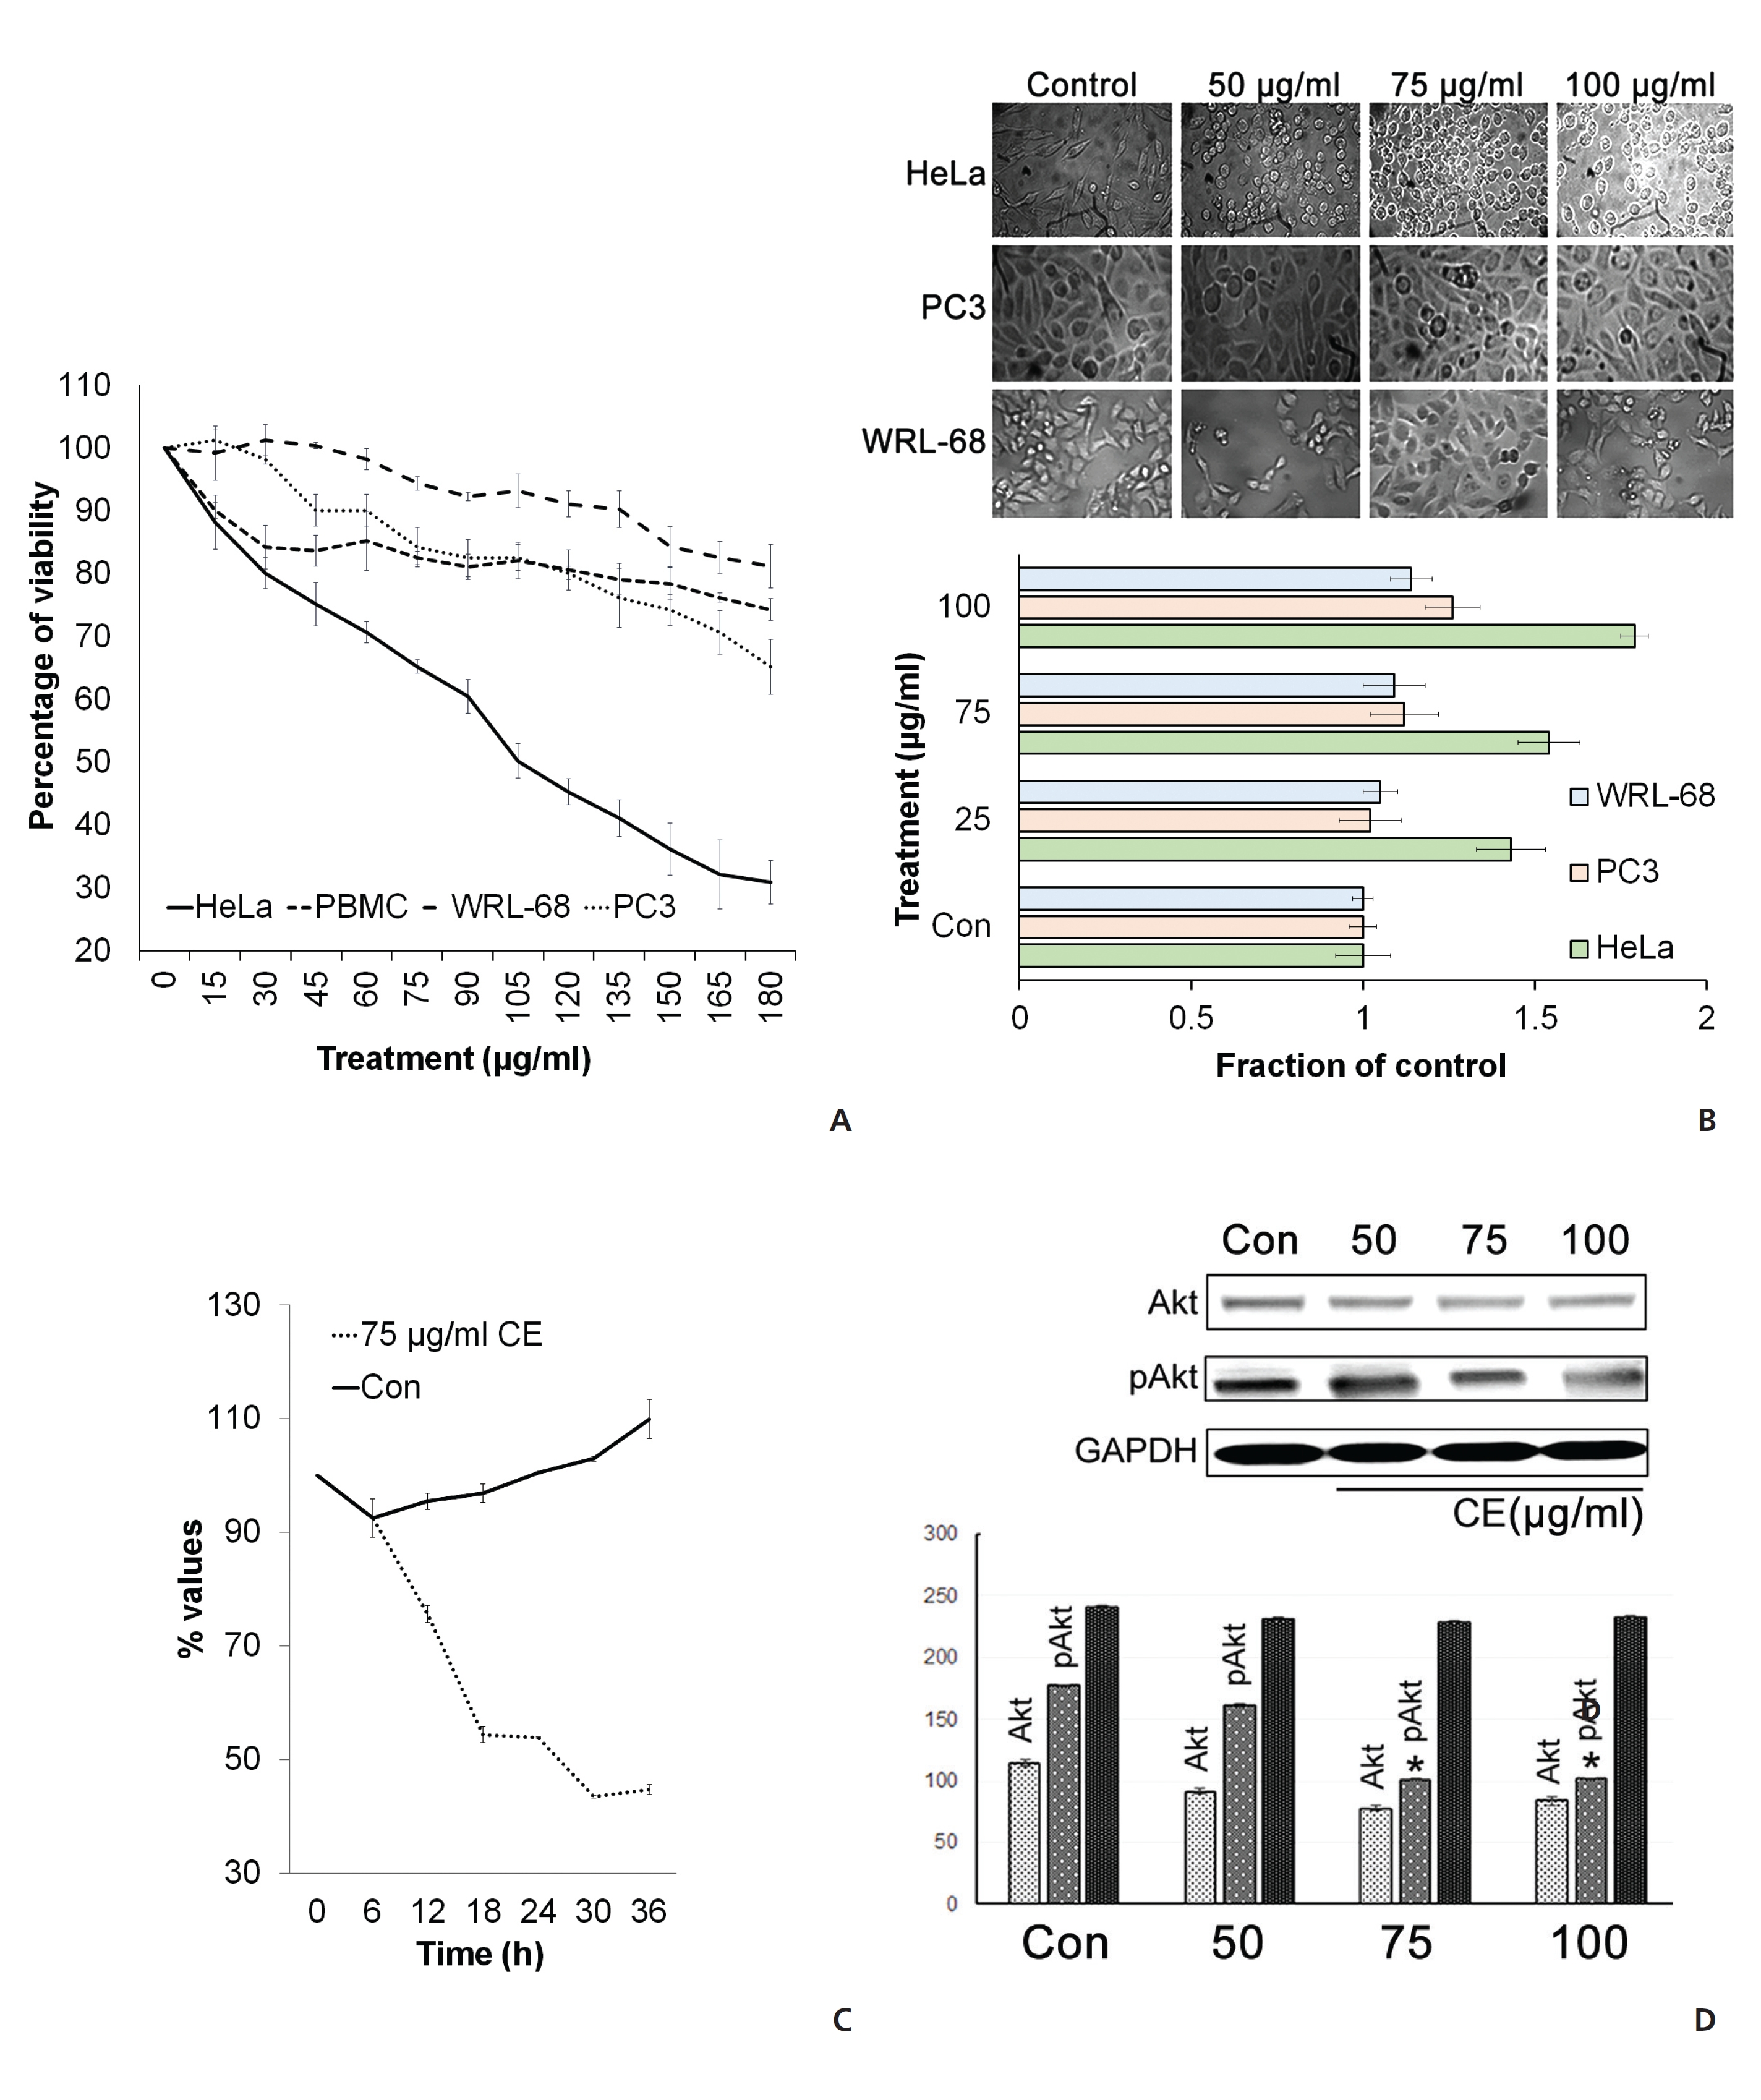
    To check the cytotoxic effect of CE on different cancer cells, we cultured HeLa cells and PC3 in the presence of different concentrations of CE. The MTT assay revealed that the viability of the cells was reduced upon the application of the higher doses of CE (Fig. 1(A)). CE also caused a morphology change in the treated HeLa cells (Fig. 1(B)). The effectiveness of CE was found to be greater against HeLa cells than against PC3 cells (Fig. 1(B)). CE also displayed minimal cytotoxicity against the normal control WRL-68 liver cells (Fig. 1(A),(B)) and normal mouse PBMCs (Fig. 1(A)). At 50 μg/mL, CE appeared to show a slow proliferation of cells rather than a reduction in cell viability (Fig. 1(C)). We next checked the activity of Akt, which is an inducer of cellular proliferation. This was performed on HeLa cells with varying doses of CE. We observed an apparent reduction in pAkt expression with CE treatment (Fig. 1(D)). These findings led us to hypothesize that CE had a potential to reduce cell viability, particularly in HeLa cells, with minimal cytotoxicity against other cell types of a non-cancerous origin (WRL-68 and mouse PBMCs).

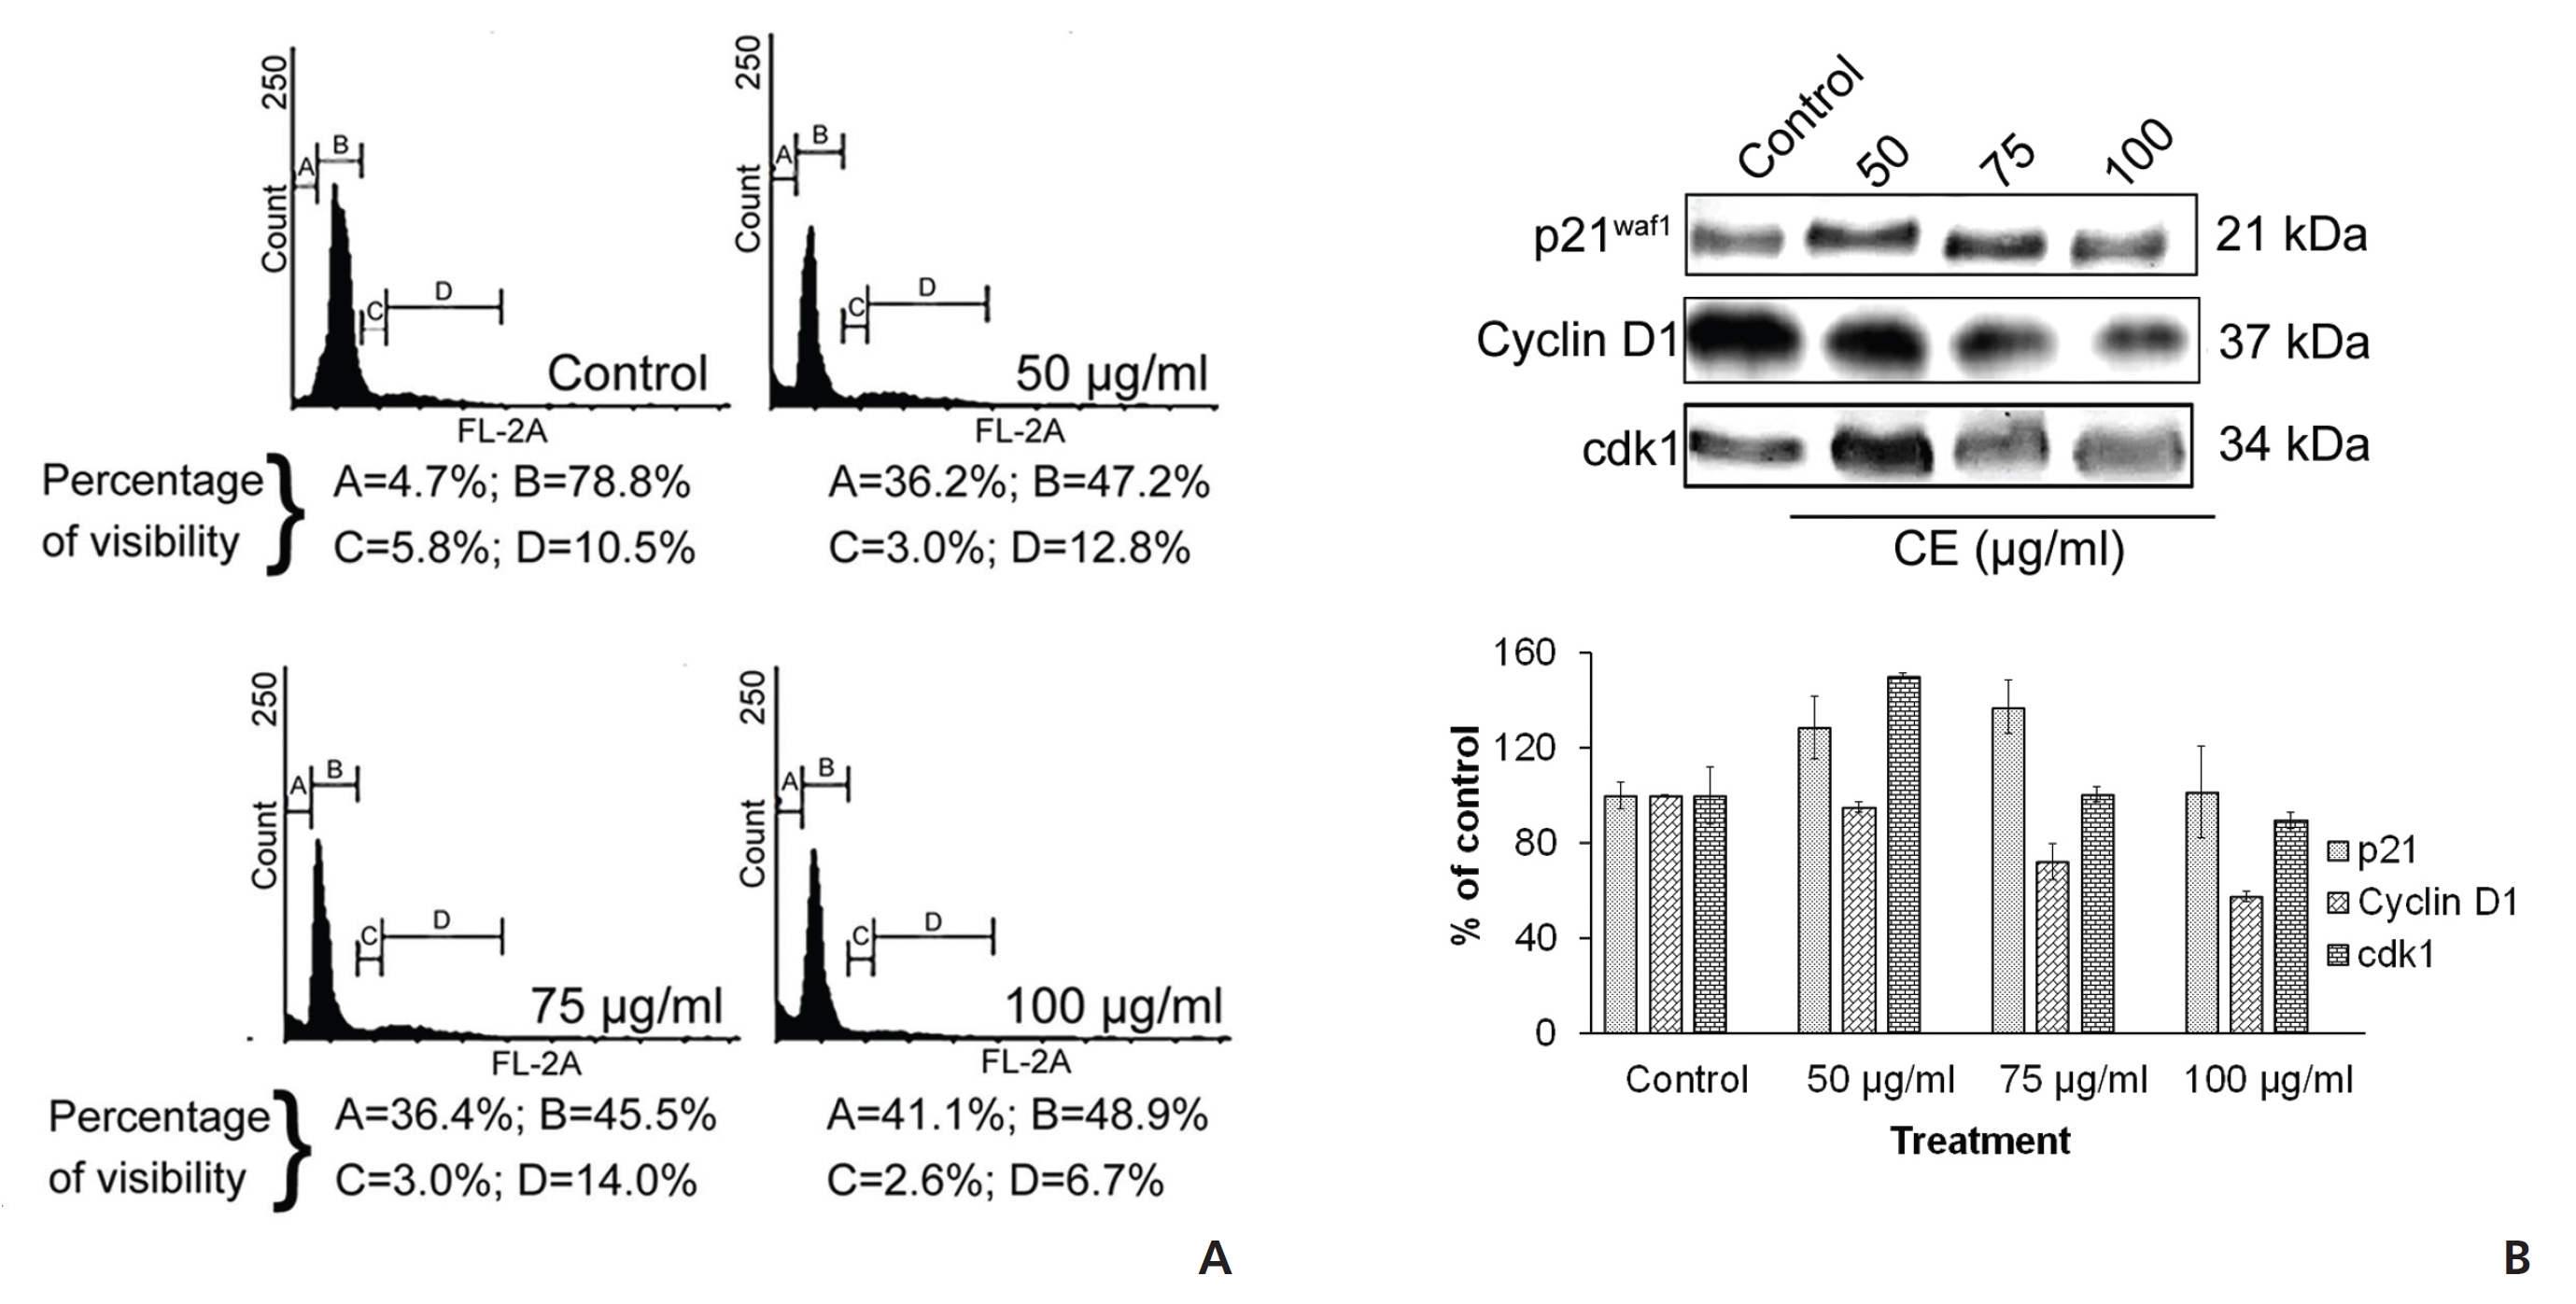
    Taking the cue from earlier studies that cell cycle arrest at G zero/Growth 1(G0/G1) may be an indicative feature of senescence [15] and subsequent cell death, we analyzed cell cycle events. The analysis of the cell cycle by using PI revealed an increase in the G0/G1-phase cells after treatment of HeLa cells with CE. Decreases in the synthesis (S) phase and the Pre-mitotic/Mitosis (G2/M) phase of the cell cycle were also seen with the treatment group (Fig. 2(A)). This indicated a significant reduction in deoxyribonucleic acid (DNA) synthesis in the treated cells. In addition, a sharp increase in the number of sub-G phase cells was observed (Fig. 2(A)), which might be related to CE’s apoptosis inducing and DNA damage inducing properties. To check for any effects on the expressions of a number of proteins related to the cell cycle, we implemented Western blotting and looked at expression changes for cyclin-dependent kinase inhibitor 1 (p21WAF1), cyclin D1 and CDK1 with CE treatment. We found that p21WAF1 expression increased and that cyclin D1 expression decreased. The expression of another cell cycle regulator CDK1 increased in a dose dependent manner upon treatment with CE (Fig. 2(B)).

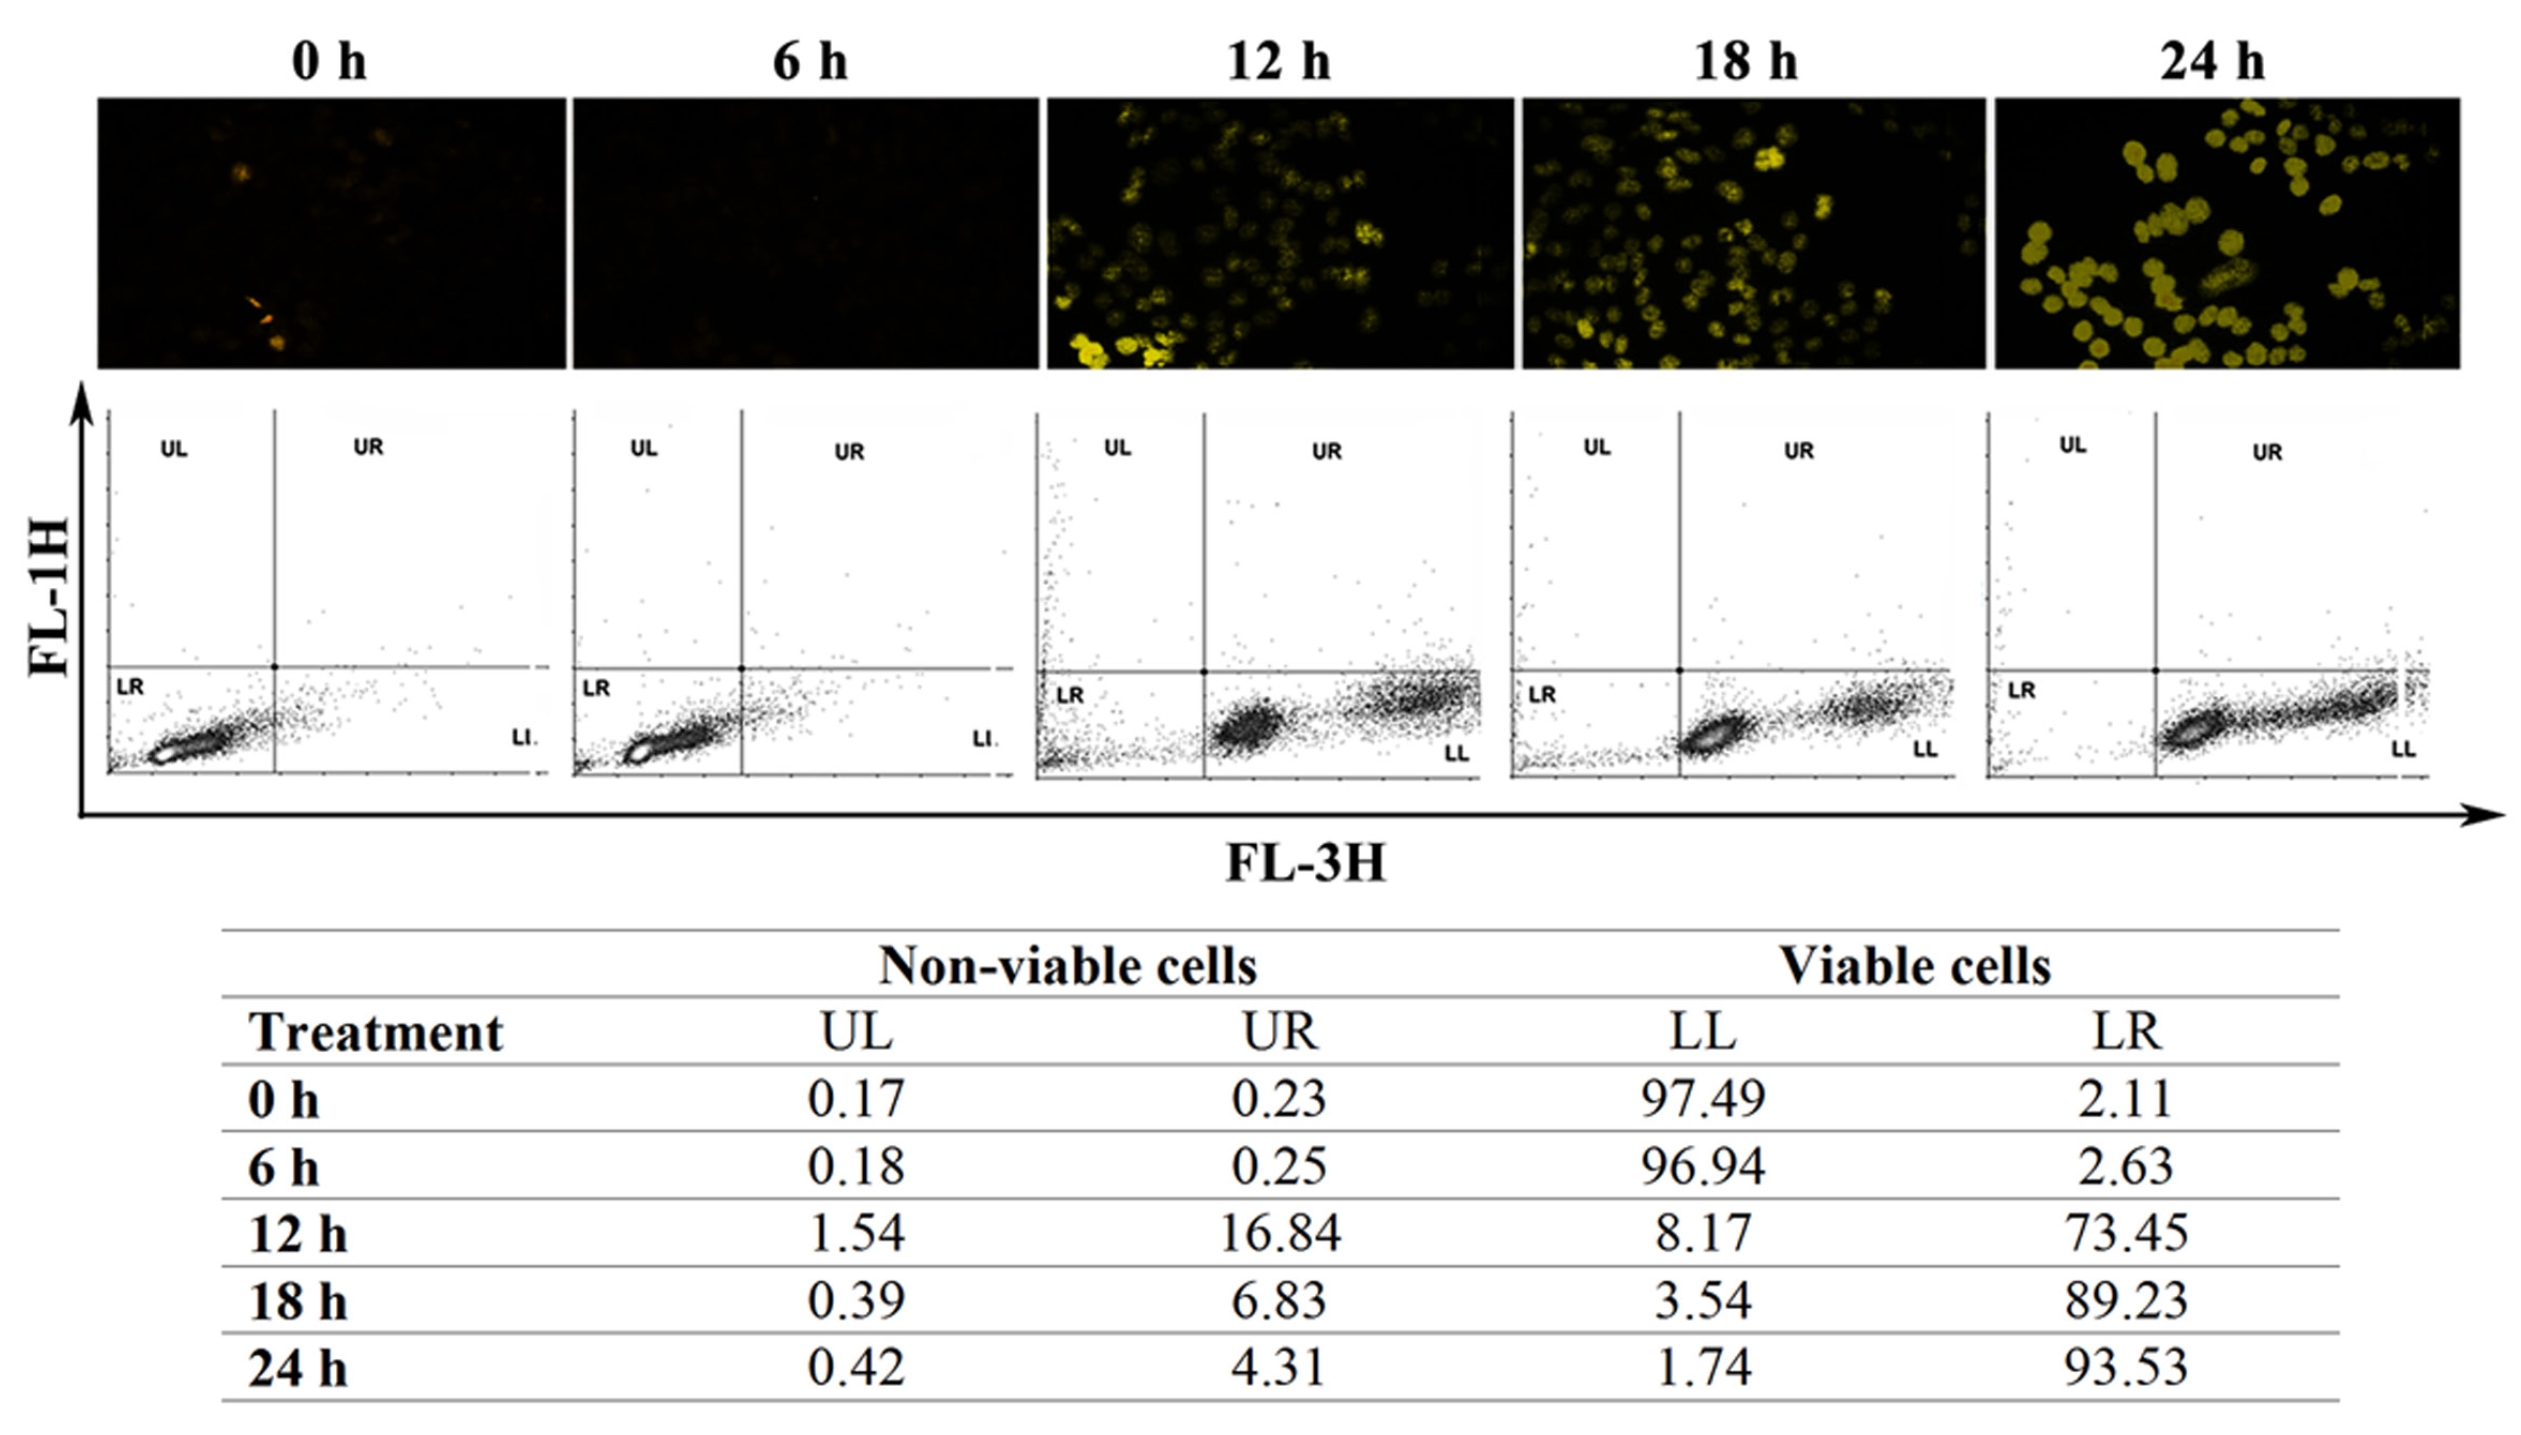
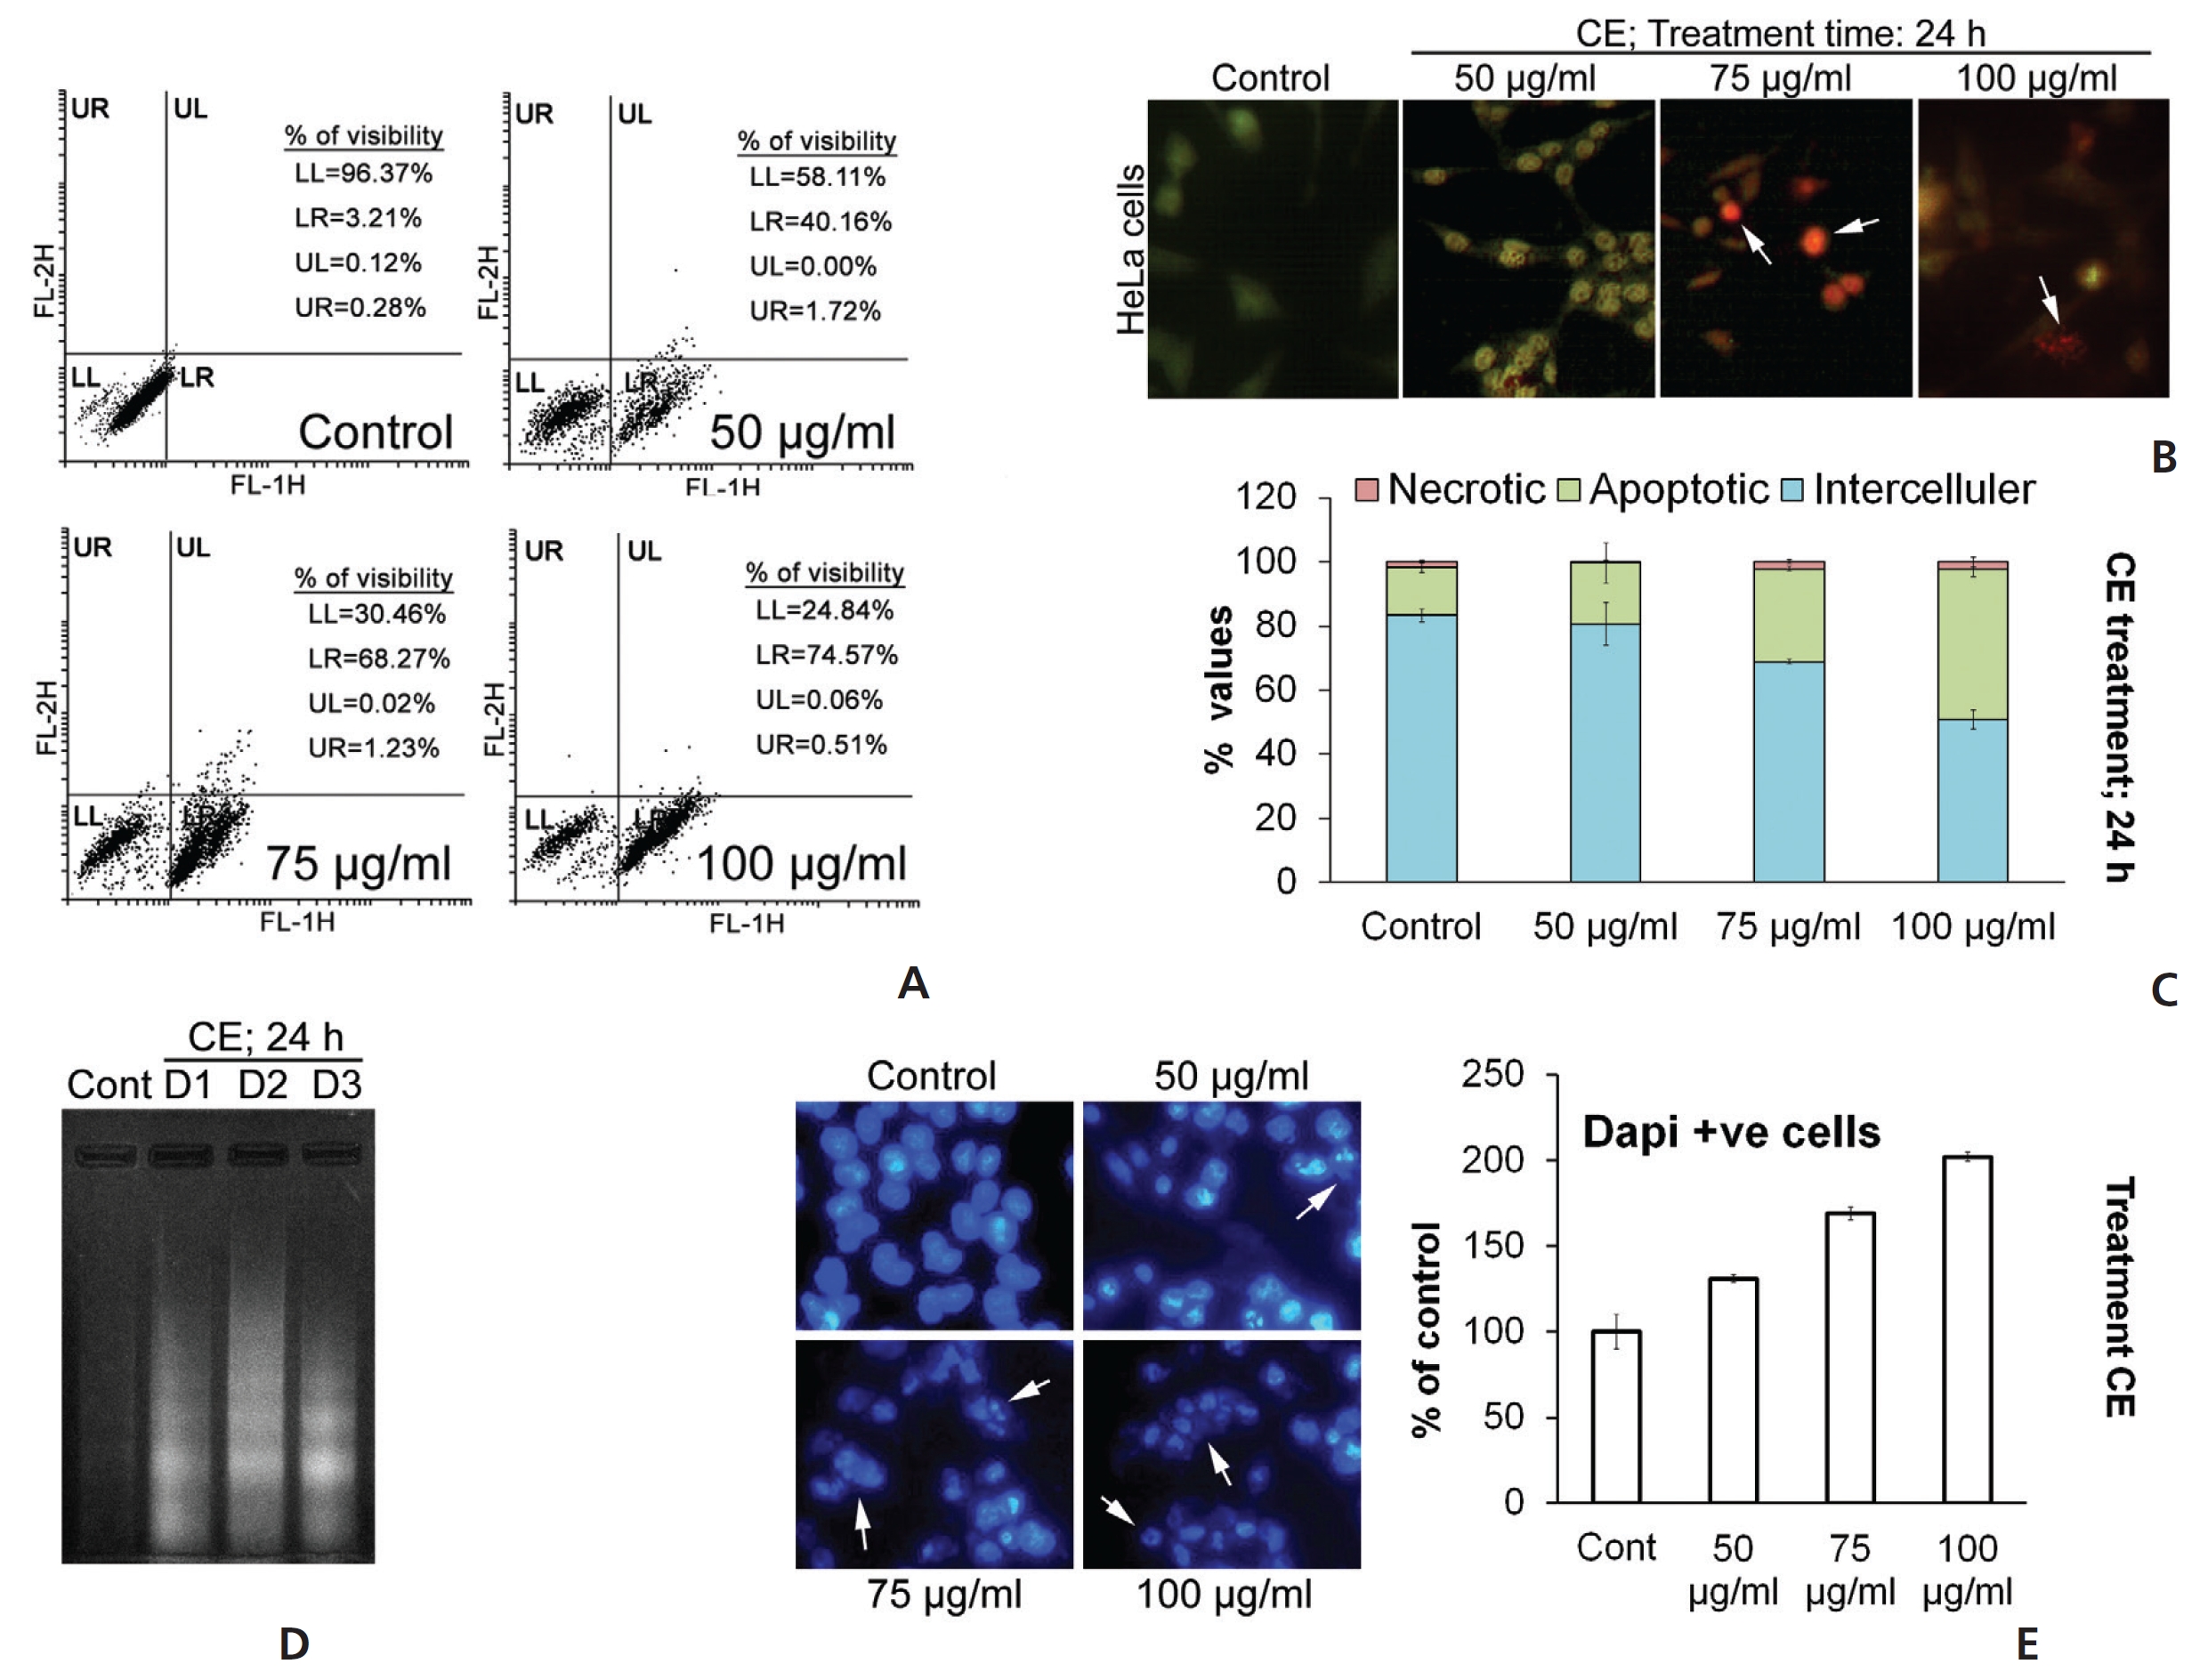
    To supplement our observations from the cell cycle analyses, we performed annexin V staining of the HeLa cells. The CE-treated group became significantly annexin V positive (Fig. 3(A)). In addition, staining with acridine orange/ ethidium bromide (AO/EB) indicated the formation of condensed and fragmented DNA with orange-red colored nuclei following CE treatment (Fig. 3(B)). These events related well to an increase in the sub-G stage group in the cell cycle analysis. A lactate dehydrogenase (LDH) assay was used to confirm whether any necrotic cell death occurred due to treatment with CE; a profound increase was observed in the apoptotic cell population, but not in the necrotic cell population (Fig. 3(C)). Fragmented DNA in the DNA laddering assay on 4',6-diamidino-2-phenylindole (DAPI)-positive cells confirmed these finding (Fig. 3(D),(E)). Based on these observations in HeLa cells, we believe that CE caused cell cycle arrest with induction of DNA damage and apoptosis.

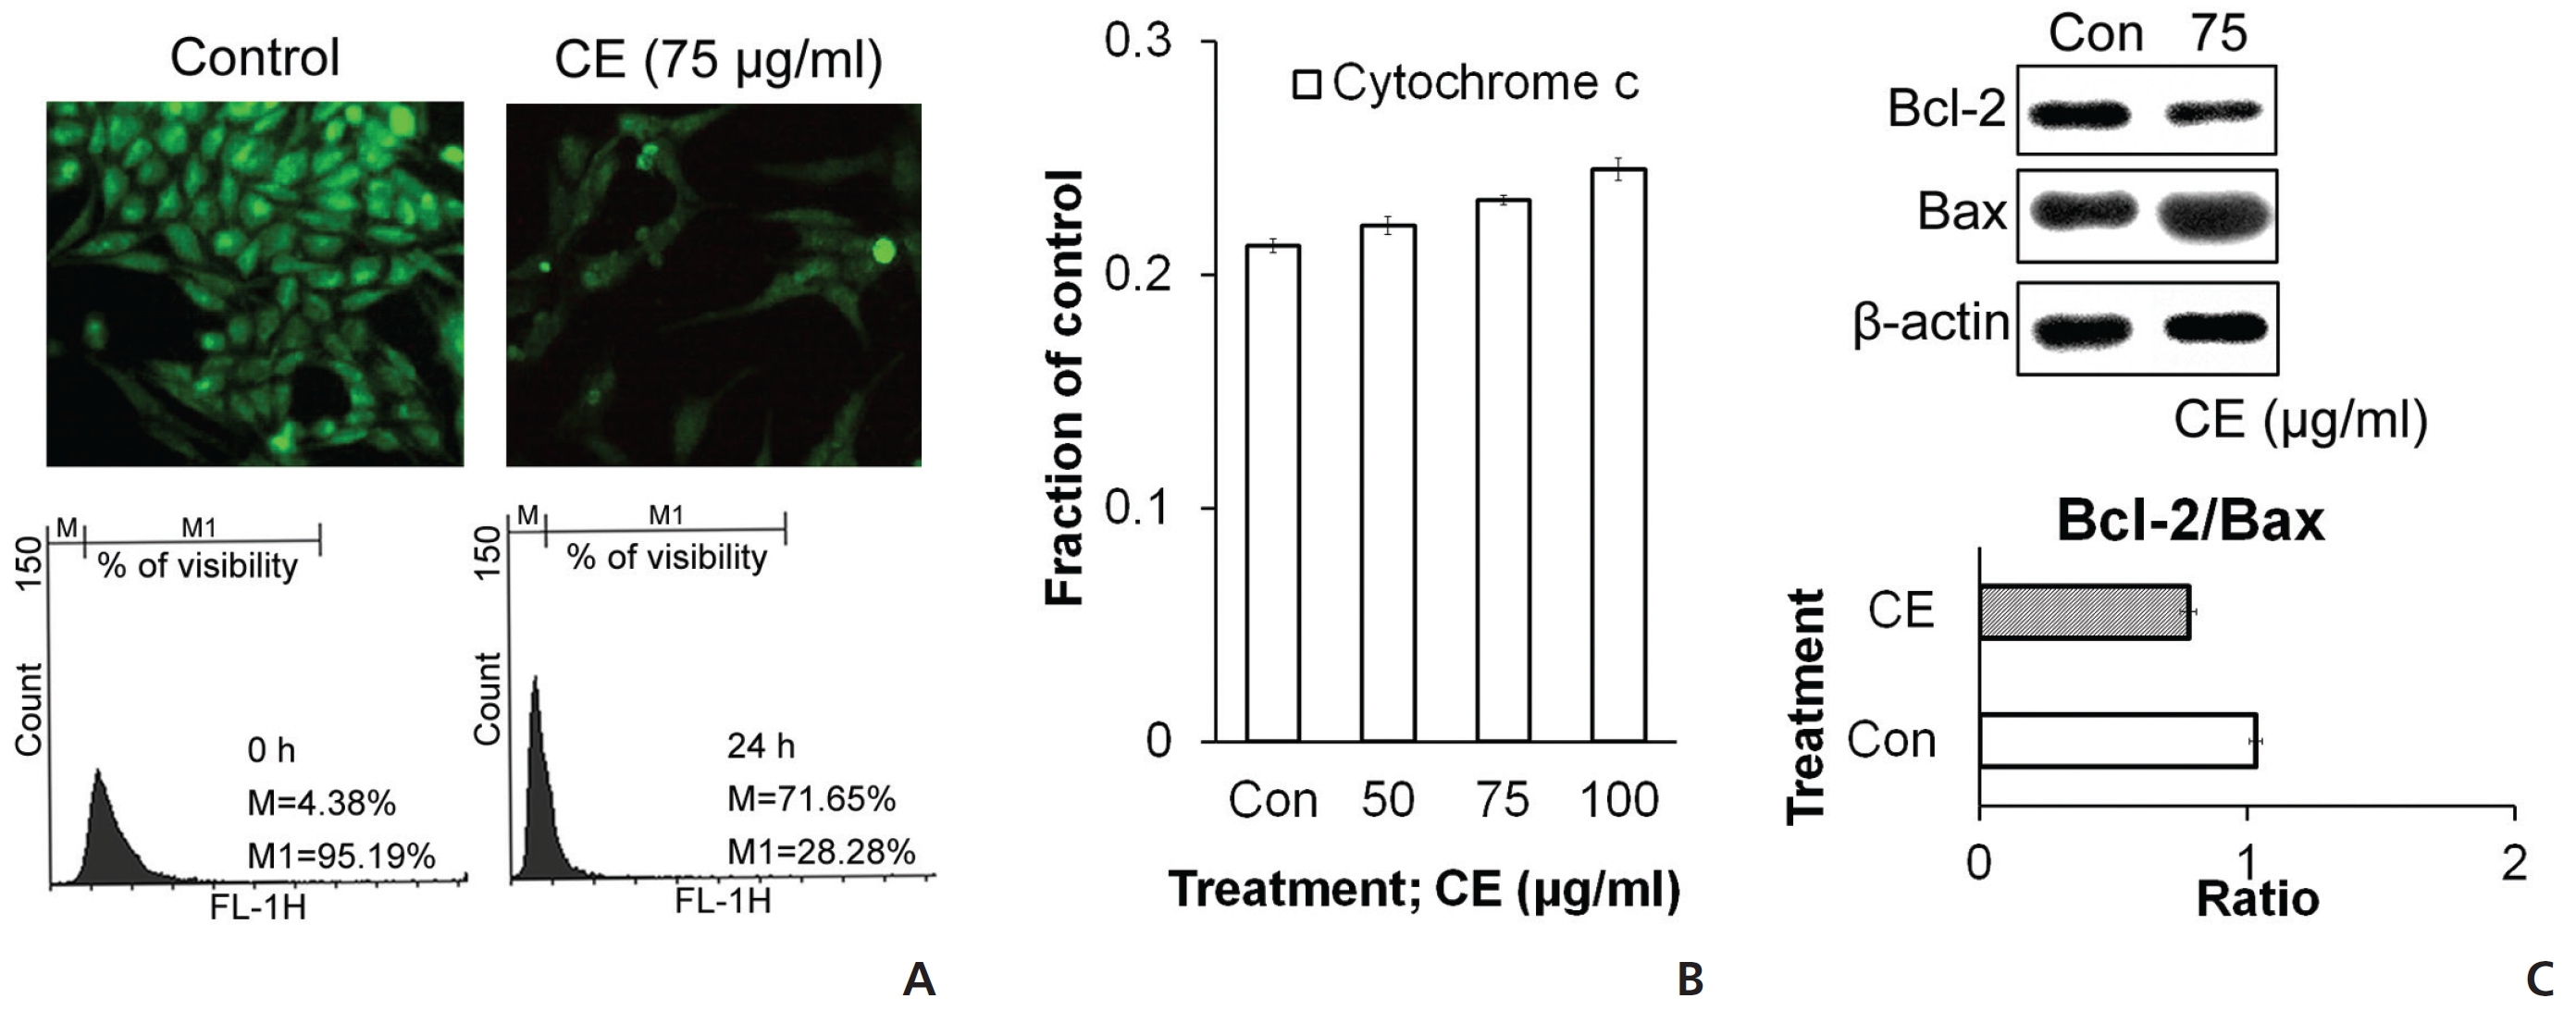
    To check the state of mitochondria during the death signal caused by CE, we stained the cells with rhodamine and then analyzed them by using flow cytometry and microscopy. Rhodamine staining was found to be diminished with CE treatment (Fig. 4(A)), which indicated a reduced membrane potential in the mitochondria. We also checked the levels of different proteins related to cell death and survival with respect to the mitochondrial pathway. Increases in cytochrome c and BAX expressions (Fig. 4(B),(C)), along with a decrease in anti-apoptotic Bcl-2 expression, were observed in CE treated HeLa cells (Fig. 4(C)). These findings led us to speculate that the CE death pathway might involve the mitochondria in the HeLa cells.

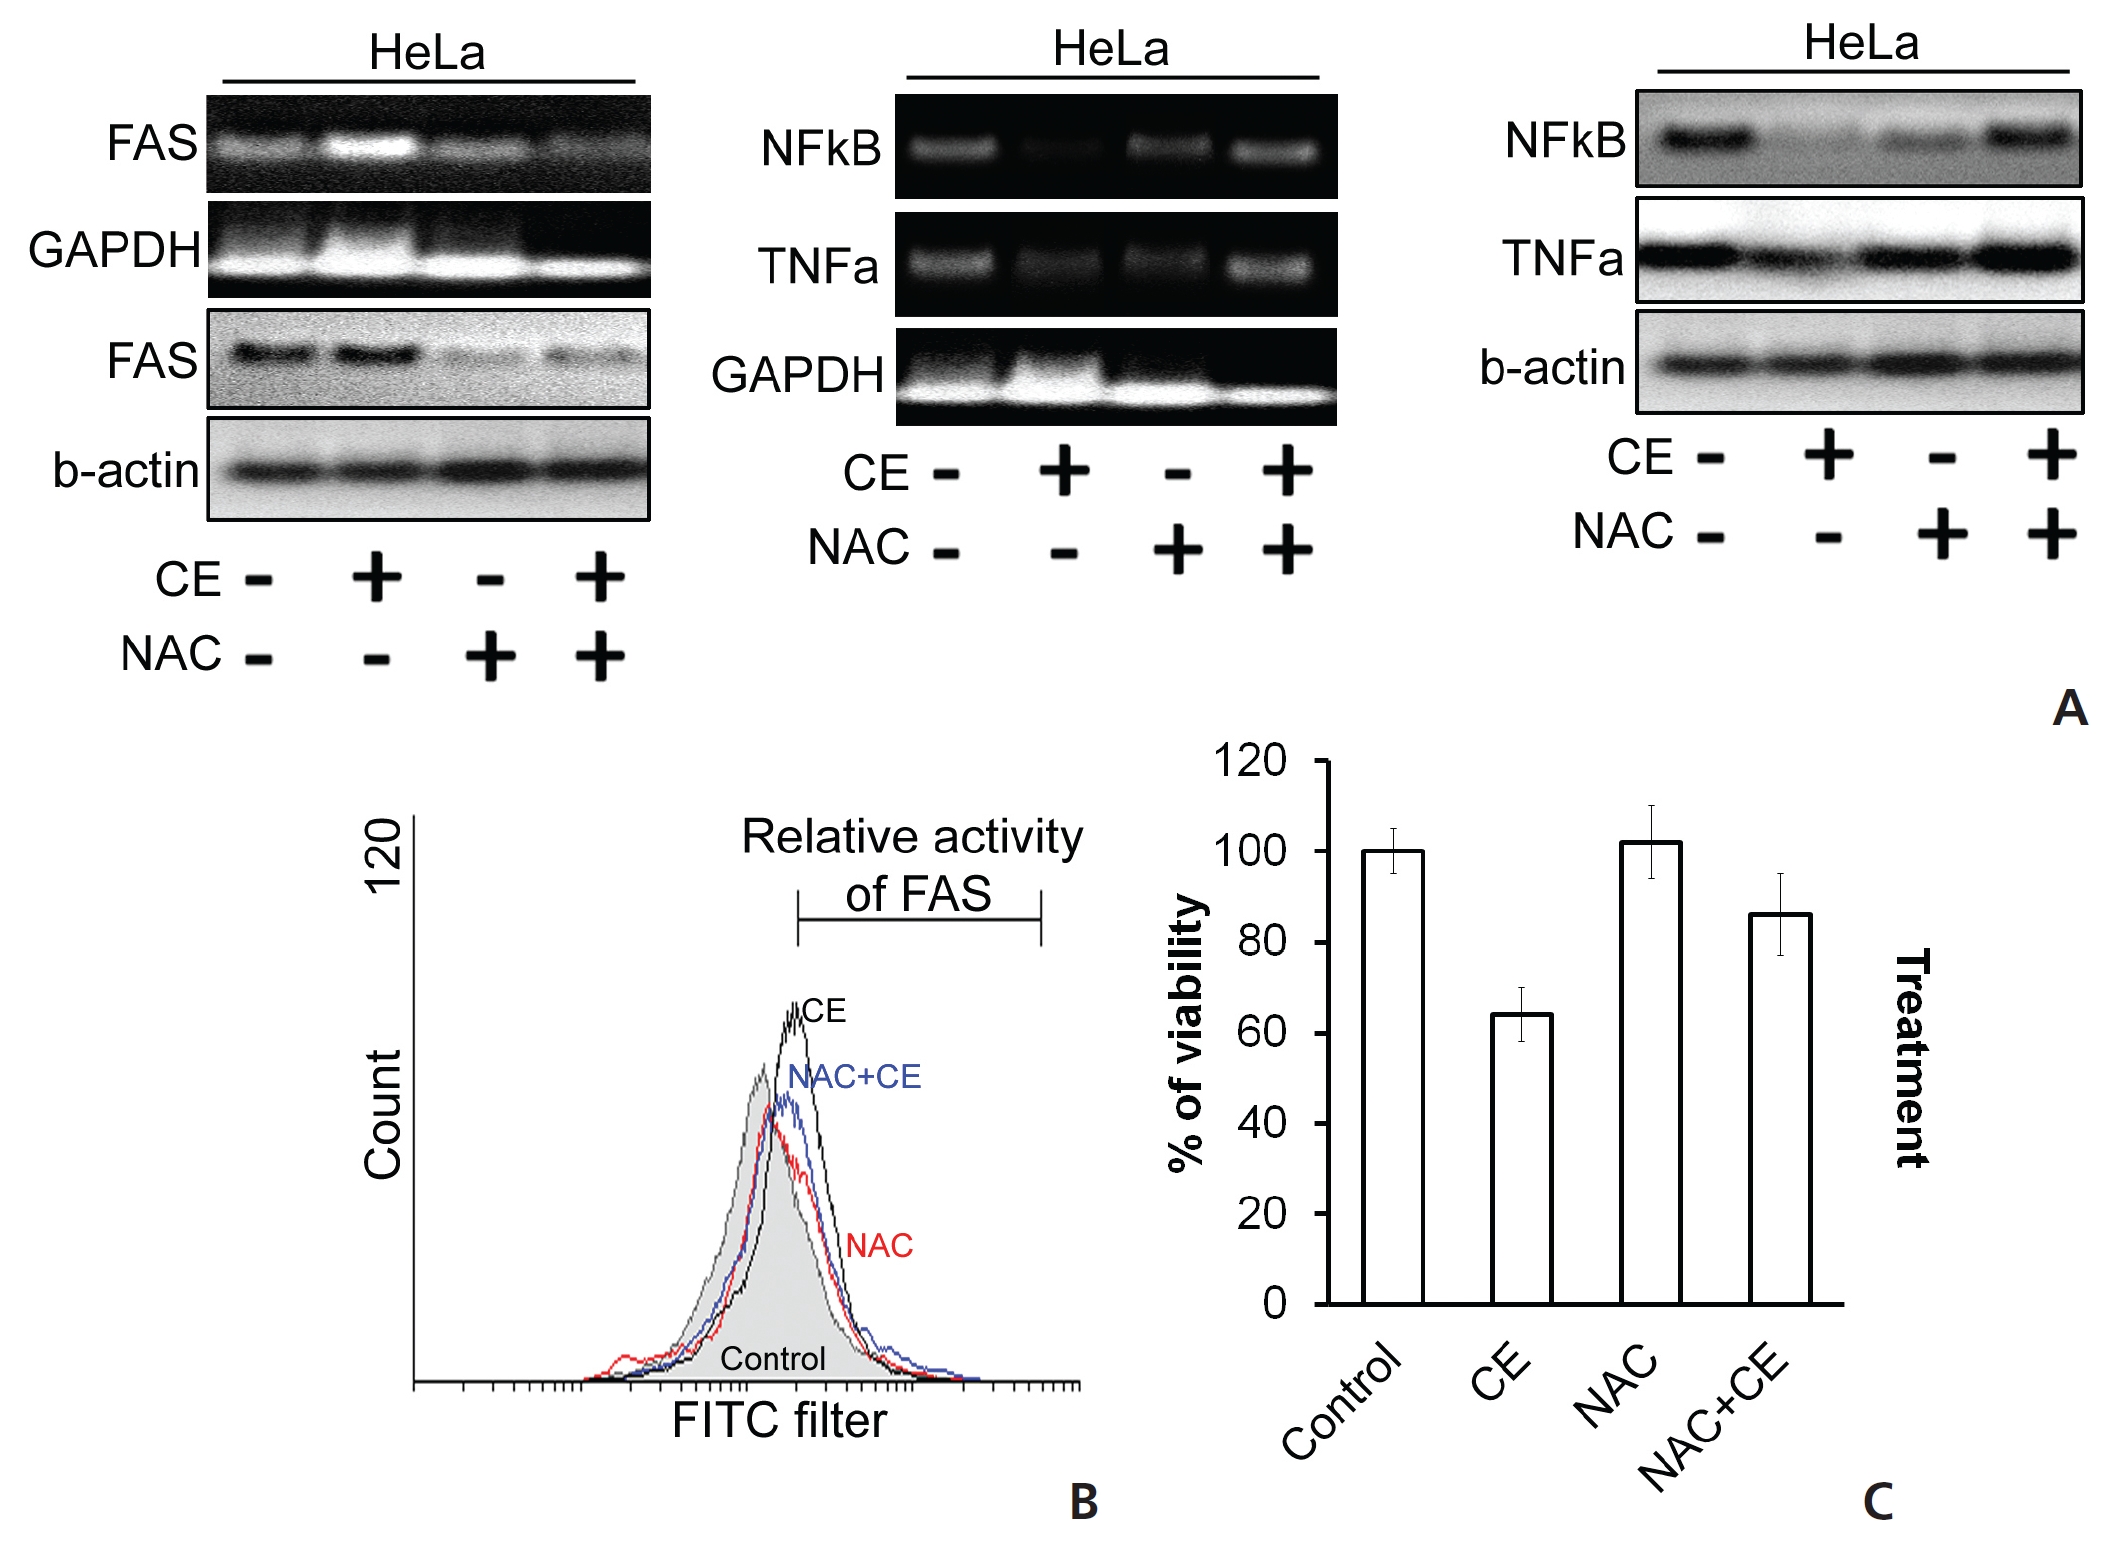
    ROS accumulation can change the internal environment of cells [16]. For identification of ROS, we stained the cells with DCFDA reagent and then estimated ROS accumulation by using flow cytometry. We observed an induction of ROS upon treatment of HeLa cells with CE (Fig. 5) To check the effect of ROS on different cell death proteins and messenger RNA (mRNA) expression, before treatment with CE, we pre-treated the cells first with the ROS scavenger N-acetyl cysteine (NAC). In the control group, CE led to degradations of TNF-α and NF-κB, but in cells pre-treated with NAC, this activity of CE was diminished (Fig. 6(A)). These observations were also seen at the protein level with Western blotting (Fig. 6(A)).

    We also checked the activity of the death receptor Fas, and its level was found to be increased by CE, but its level was decreased or unaffected when HeLa cells were treated with both NAC and CE (Fig. 6(A),(B)). In the context of cell viability, co-treatment with NAC with CE dramatically increased the viability of HeLa cells (Fig. 6(C)). Thus, we have found evidence that the cytotoxic effect of CE on HeLa cells is mediated through ROS generation and accumulation, thus contributing to the apoptosis of the treated cells.

    4. Discussion

    In the present study, different proteins associated with apoptosis were observed to be up regulated while certain anti-apoptotic and proliferation inducing proteins were found to be suppressed after administration of CE in HeLa cells. Further, the process of cell death was found to have been eventually controlled by the generation of ROS in HeLa cells. We conjecture that a dual mechanism appears to be operating for the apoptotic response seen with CE treatment: one is a blocking of the growth induced signals, and the other is the accumulation of ROS and the activation of a Fas pathway alongside a depolarization of the mitochondria membrane’s potential. CE showed a relatively low cytotoxicity towards the non-cancerous cells tested (Fig. 1) We conclude that CE has qualities that would make it a potentially promising cancer drug; thus. it merits a further follow-up with animal tumor models.

    In this study, we provide evidence of a dose dependent susceptibility of the model cervical cancer HeLa cells to CE in a ROS dependent manner. We studied DNA sub-diploidy, intracellular caspase activation and changes in membrane phospholipid asymmetry [17], which point to apoptosis in these cells upon CE treatment. The number of HeLa cells in sub-G stages increased with CE treatment, and DAPI and AO/EB staining revealed a condensation of nuclear chromatin with the formation of pyknotic bodies (Fig. 3). These results with CE point to DNA damage as part of the cell death process. Caspase-3 was found to be cleaved by CE treatment, and we propose that this activates a pathway that leads to the cleavage of DNA and the induction of apoptosis. Annexin V staining detected a phophatidyl serine (PS) asymmetry, and when coupled with PI staining, it was another indication of apoptosis induction [17, 18] in the CE treated cells (Fig. 3).

    Sharp increases in the levels of TNF-α and Fas, along with decreases in the expressions of NF-κB and Bcl-2, were observed in HeLa cells treated with CE (Figs. 4,6) Fas receptor is responsible for inducing programmed cell death by involving mitochondria [19, 20]. The level and the activity of this death receptor often go down when tumorigenesis is in progress. In certain cases, a mutation or down regulation of this death receptor is seen in tumor cells that are resistant to apoptosis. There are also cases in which the Bcl-2 family of anti-apoptotic proteins hinders the activation process of the Fas receptor through Fas ligand (FasL) and instances where hyper activation of this receptor overcomes the activity of Bcl-2 and promotes mitochondria membrane depolarization to initiate apoptotic caspase cascades [21, 22]. TNF-α might also initiate caspase-8 either by activating c-Jun N-terminal kinases (JNK) or by down regulating NF-κB [23], which may activate Bcl-2 and oppose the activation of apoptosis [24].

    This study has provided evidence of accumulation of ROS in HeLa cells exposed to CE (Fig. 5). ROSs are generated during starvation and during pharmacological stress conditions. Repeated exposure to ROS can damage mitochondrial proteins by amplifying oxidative damage, thus resulting in an opening of the membrane’s permeability transition (MPT) pores and a loss of the mitochondrial integrity [25]. We found that the cytotoxicity of CE in HeLa cells was solely related to ROS generation. The use of the ROS scavenger NAC attenuates the apoptotic activity of CE, including its capability to depolarize the mitochondrial membrane’s potential. CE treatment resulted in a down regulation of cyclin D1 expression in HeLa cells (Fig. 2). A higher activity of cyclin D1 recruits more cells into the cell cycle and acts as a marker of proliferation, which may provoke higher levels of malignancy in cancer cells [26].

    5. Conclusion

    From our findings, we may hypothesize that CE regulates ROS accumulation to up regulate the activity of Fas-TNF-α death receptor pathways. As a consequence, induction of death signals depolarizes the mitochondrial membrane’s potential and activates the caspase pathway. Flow cytometry demonstrated that CE arrested the cell cycle in the sub-G stage, along with G0/G1, and decreased the cell populations in the different phases of cell division. As most cancer drugs in clinical use block the cell cycle in the S or the G2/M phases, CE could be combined with certain of these drugs in an attempt to improve the efficacy of anti- mitotic cancer therapies. We propose that CE merits further experimentation, possibly in animal tumor models.

    [Table. 1] Primer sequences used for the study of RT-PCR

    label

    Primer sequences used for the study of RT-PCR

참고문헌
  • 1. Sudhakar A 2009 History of cancer, ancient and modern treatment methods [J Cancer Sci Ther] Vol.1 P.1-4 google cross ref
  • 2. Hayden EC 2009 Cutting off cancer’s supply lines [Nature] Vol.458 P.686-687 google
  • 3. Zhang G, Wang Y, Zhang Y, Wan X, Li J, Liu K 2012 Anti- cancer activities of tea epigallocatechin-3-gallate in breast cancer patients under radiotherapy [Curr Mol Med] Vol.12 P.163-176 google cross ref
  • 4. Troselj KG, Kujundzic RN 2014 Curcumin in combined cancer therapy [Curr Pharm Des] Vol.20 P.6682-6696 google cross ref
  • 5. Yao S, To KK, Wang YZ, Yin C, Tang C, Chai S 2014 Polyoxypregnane steroids from the stems of Marsdenia tenacissima [J Nat Prod] Vol.77 P.2044-2053 google
  • 6. Ye B, Li J, Li Z, Yang J, Niu T, Wang S 2014 Anti-tumor activity and relative mechanism of ethanolic extract of Marsdenia tenacissima (Asclepiadaceae) against human hematologic neoplasm in vitro and in vivo [J Ethnopharmacol] Vol.153 P.258-267 google cross ref
  • 7. Huang Z, Lin H, Wang Y, Cao Z, Lin W, Chen Q 2013 Studies on the anti-angiogenic effect of Marsdenia tenacissima extract in vitro and in vivo [Oncol Lett] Vol.5 P.917-922 google
  • 8. Bishayee K, Paul A, Ghosh S, Sikdar S, Mukherjee A, Biswas R 2013 Condurango-glycoside-A fraction of Gonolobus condurango induces DNA damage associated senescence and apoptosis via ROS-dependent p53 signalling pathway in HeLa cells [Mol Cell Biochem] Vol.382 P.173-183 google cross ref
  • 9. Hayashi K, Wada K, Mitsuhashi H, Bando H, Takase M, Terada S 1980 Antitumor active glycosides from Condurango cortex [Chem Pharm Bull] Vol.28 P.1954-1958 google cross ref
  • 10. Sikdar S, Mukherjee A, Khuda-Bukhsh AR 2014 Ethanolic extract of Marsdenia condurango ameliorates benzo[a] pyrene-induced lung cancer of rats: condurango ameliorates BaP-induced lung cancer in rats [J Pharmacopuncture] Vol.17 P.7-17 google cross ref
  • 11. Chen J, Li X, Sun C, Pan Y, Schlunegger UP 2008 Identification of polyoxypregnane glycosides from the stems of Marsdenia tenacissima by high-performance liquid chromatography/tandem mass spectrometry [Talanta] Vol.77 P.152-159 google cross ref
  • 12. Ulmer AJ, Scholz W, Ernst M, Brandt E, Flad HD 1984 Isolation and subfractionation of human peripheral blood mononuclear cells (PBMC) by density gradient centrifugation on percoll [Immunobiology] Vol.166 P.238-250 google cross ref
  • 13. Paul A, Das S, Das J, Samadder A, Bishayee K, Sadhukhan R 2013 Diarylheptanoid-myricanone isolated from ethanolic extract of Myrica cerifera shows anticancer effects on HeLa and PC3 cell lines: signalling pathway and drug-DNA interaction [J Integr Med] Vol.11 P.405-415 google cross ref
  • 14. Paul A, Bishayee K, Ghosh S, Mukherjee A, Sikdar S, Chakraborty D 2012 Chelidonine isolated from ethanolic extract of Chelidonium majus promotes apoptosis in HeLa cells through p38-p53 and PI3K/AKT signalling pathways [Zhong Xi Yi Jie He Xue Bao] Vol.10 P.1025-1038 google cross ref
  • 15. Mao Z, Ke Z, Gorbunova V, Seluanov A 2012 Replicatively senescent cells are arrested in G1 and G2 phases [Aging] Vol.4 P.431-435 google
  • 16. Fulda S, Gorman AM, Hori O, Samali A 2010 Cellular stress responses: cell survival and cell death [Int J Cell Biol] Vol.2010 P.1-23 google cross ref
  • 17. Hanahan D, Weinberg RA 2000 The hallmarks of cancer [Cell] Vol.100 P.57-70 google cross ref
  • 18. Lee SH, Meng XW, Flatten KS, Loegering DA, Kaufmann SH 2013 Phosphatidylserine exposure during apoptosis reflects bidirectional trafficking between plasma membrane and cytoplasm [Cell Death Differ] Vol.20 P.64-76 google cross ref
  • 19. Rieger AM, Nelson KL, Konowalchuk JD, Barreda DR 2011 Modified annexin V/propidium iodide apoptosis assay for accurate assessment of cell death [J Vis Exp] Vol.50 P.2597 google
  • 20. Lichter P, Walczak H, Weitz S, Behrmann I, Krammer PH 1992 The human APO-1 (APT) antigen maps to 10q23, a region that is syntenic with mouse chromosome 19 [Genomics] Vol.14 P.179-180 google cross ref
  • 21. Klopfer A, Hasenjager A, Belka C, Schulze-Osthoff K, Dorken B, Daniel PT 2004 Adenine deoxynucleotides fludarabine and cladribine induce apoptosis in a CD95/Fas receptor, FADD and caspase-8-independent manner by activation of the mitochondrial cell death pathway [Oncogene] Vol.23 P.9408-9418 google cross ref
  • 22. Roy S, Nicholson DW 2000 Cross-talk in cell death signaling [J Exp Med] Vol.192 P.21-26 google cross ref
  • 23. Papa S, Bubici C, Zazzeroni F, Franzoso G 2009 Mechanisms of liver disease: crosstalk between the NF-κB and JNK pathways [Biol Chem] Vol.390 P.965-976 google
  • 24. Fiandalo MV, Kyprianou N 2012 Caspase control: protagonists of cancer cell apoptosis [Exp Oncol] Vol.34 P.165-175 google
  • 25. Murphy MP 2009 How mitochondria produce reactive oxygen species [Biochem J] Vol.417 P.1-13 google cross ref
  • 26. Pucci B, Kasten M, Giordano A 2000 Cell cycle and apoptosis [Neoplasia] Vol.2 P.291-299 google cross ref
OAK XML 통계
이미지 / 테이블
  • [ Table. 1 ]  Primer sequences used for the study of RT-PCR
    Primer sequences used for the study of RT-PCR
  • [ Fig. 1 ]  (A) For the MTT assay, cells were cultured in a 96-well plate and treated with different doses of CE. After a 24-hours incubation, an MTT assay was performed. (B) The morphology of the cells was studied with an inverted light microscope after CE treatment and 24-hours incubation. The bar diagram is indicative of morphologically distorted cells and represents the fractional values with respect to the controls. (C) For the proliferation assay, HeLa cells were treated with 75 μg/mL of CE for different intervals, and the cells were then assayed by counting them with a hemocytometer. The values were representative of three independent experiments. (D) Expression study of Akt and pAkt by using Western blotting: cells were treated with CE and harvested after a specific incubation. Proteins of the lysed cells were quantified, and Akt and pAkt expressions were analyzed by using Western blotting.
    (A) For the MTT assay, cells were cultured in a 96-well plate and treated with different doses of CE. After a 24-hours incubation, an MTT assay was performed. (B) The morphology of the cells was studied with an inverted light microscope after CE treatment and 24-hours incubation. The bar diagram is indicative of morphologically distorted cells and represents the fractional values with respect to the controls. (C) For the proliferation assay, HeLa cells were treated with 75 μg/mL of CE for different intervals, and the cells were then assayed by counting them with a hemocytometer. The values were representative of three independent experiments. (D) Expression study of Akt and pAkt by using Western blotting: cells were treated with CE and harvested after a specific incubation. Proteins of the lysed cells were quantified, and Akt and pAkt expressions were analyzed by using Western blotting.
  • [ Fig. 2 ]  (A) In the cell cycle analysis, cells were treated with CE and after incubation for 24 hours, they were fixed and stained with PI. The stained cells were analyzed by using a flow cytometer with a FL-2A filter. (B) Expression study of cell cycle related proteins: cells were harvested and lysed to extract the proteins. The expression of p21, cyclin D1 and CDK1 was analyzed by using western blotting.
    (A) In the cell cycle analysis, cells were treated with CE and after incubation for 24 hours, they were fixed and stained with PI. The stained cells were analyzed by using a flow cytometer with a FL-2A filter. (B) Expression study of cell cycle related proteins: cells were harvested and lysed to extract the proteins. The expression of p21, cyclin D1 and CDK1 was analyzed by using western blotting.
  • [ Fig. 3 ]  (A) For the annexin V assay, cells were harvested and suspended in annexin V buffer. After the staining with annexin V, PI cells were analyzed by using a flow cytometer. (B) For AO/EB staining, cells were fixed with 4% PFA, stained with AO and EB, and then photographed using a fluorescence microscope. (C) For the LDH assay, cells and media was analyzed by using a LDH assay kit. (D) DNA was extracted by using the phenol chloroform method and were run on 1% agarose gel. (E) For DAPI staining: cells were washed and fixed with 4% PFA. Using DAPI cells were observed under a fluorescence microscope, and the results arere presented in a bar diagram.
    (A) For the annexin V assay, cells were harvested and suspended in annexin V buffer. After the staining with annexin V, PI cells were analyzed by using a flow cytometer. (B) For AO/EB staining, cells were fixed with 4% PFA, stained with AO and EB, and then photographed using a fluorescence microscope. (C) For the LDH assay, cells and media was analyzed by using a LDH assay kit. (D) DNA was extracted by using the phenol chloroform method and were run on 1% agarose gel. (E) For DAPI staining: cells were washed and fixed with 4% PFA. Using DAPI cells were observed under a fluorescence microscope, and the results arere presented in a bar diagram.
  • [ Fig. 4 ]  (A) For Rrhodamine staining: cells were fixed after treatment and were analyzsed after staining with rhodamine 123 by using a flow cytometer and a microscope. (B) Cytochrome c was analyzed by using the ELISA method. (C) The expressions of Bax and Bcl-2 were analyzed by using Western blotting, and their ratios are presented in a bar diagram.
    (A) For Rrhodamine staining: cells were fixed after treatment and were analyzsed after staining with rhodamine 123 by using a flow cytometer and a microscope. (B) Cytochrome c was analyzed by using the ELISA method. (C) The expressions of Bax and Bcl-2 were analyzed by using Western blotting, and their ratios are presented in a bar diagram.
  • [ Fig. 5 ]  For the ROS evaluation,cells were harvested and fixed in 70% chilled methanol and 4% PFA for flow cytometry and microscopic study, respectively. Further cells were stained with DCFDA and analyzed. The chart presents the percentage of cells that lie in different quadrants.
    For the ROS evaluation,cells were harvested and fixed in 70% chilled methanol and 4% PFA for flow cytometry and microscopic study, respectively. Further cells were stained with DCFDA and analyzed. The chart presents the percentage of cells that lie in different quadrants.
  • [ Fig. 6 ]  (A) For the expressions of mRNA and proteins, cells treated with CE and/or NAC were harvested and washed. Total mRNA and proteins were isolated for the expression studies. (B) Cells were washed, and expression of FAS was analyzed by using an indirect staining protocol. Stained cells were analysed with a FITC filter. (C) Cells were treated with NAC and/or CE, and a MTT assay was done to check the viability of the cells.
    (A) For the expressions of mRNA and proteins, cells treated with CE and/or NAC were harvested and washed. Total mRNA and proteins were isolated for the expression studies. (B) Cells were washed, and expression of FAS was analyzed by using an indirect staining protocol. Stained cells were analysed with a FITC filter. (C) Cells were treated with NAC and/or CE, and a MTT assay was done to check the viability of the cells.
(우)06579 서울시 서초구 반포대로 201(반포동)
Tel. 02-537-6389 | Fax. 02-590-0571 | 문의 : oak2014@korea.kr
Copyright(c) National Library of Korea. All rights reserved.