Impact damages induced by a low-velocity impact load on carbon fiber reinforced polymer (CFRP) composite plates fabricated with various stacking sequences were studied experimentally. The impact responses of the CFRP composite plates were significantly affected by the laminate stacking sequences. Three types of specimens, specifically quasi-isotropic, unidirectional, and cross-ply, were tested by a constant impact carrying the same impact energy level. An impact load of 3.44 kg, corresponding to 23.62 J, was applied to the center of each plate supported at the boundaries. The unidirectional composite plate showed the worst impact resistance and broke completely into two parts; this was followed by the quasi-isotropic lay-up plate that was perforated by the impact. The cross-ply composite plate exhibited the best resistance to the low-velocity impact load; in this case, the impactor bounced back. Impact parameters such as the peak impact force and absorbed energy were evaluated and compared for the impact resistant characterization of the composites made by different stacking sequences.
For several decades, fiber-reinforced laminated composite materials have been widely used for many different products such as aerospace and ground and marine transportation vehicles as well as wind energy structural components, for which weight reduction is considered as the most critical aspect and could be accomplished using light-weight characteristic materials with relatively high specific strength or specific stiffness compared to more conventional structural materials.
It is well-known that a fiber-reinforced composite material is a type of hybrid material system that consists of a polymeric matrix reinforced with a fibrous form of load-carrying materials [1]. The maximum use of a composite material in an aircraft structure can be found in the manufacturing of Boeing 787 airliners, 50% of which have now been replaced by carbon fiber reinforced polymer (CFRP) composites. Despite the substantial merits and successful uses of the composite materials as various structural building blocks, especially in aerospace applications [2], there also has been concern that carbon fiber reinforced composites are susceptible to low-velocity impacts that may cause significant damage, such as matrix cracking, interlayer delamination, fiber-matrix interfacial disbanding and fiber breakage [3-7].
Certain polymeric matrices such as an epoxy matrix might have brittle failure characteristics, making them susceptible to internal damage generation that was caused mainly by an impact and eventually, affects the overall structural integrity as well as the local stiffness of the material [8,9]. Yang and Sun [10] presented the experimental indentation law through static indentation tests on composite laminates. Choi and Lim [11] proposed a linearized contact law for low-velocity impact analysis of composite laminates and compared it with the modified Hertzian contact law. Sun and Chattopadhyay [12], Dobyns [13], Ramkumar and Chen [14] employed the first-order shear deformation theory developed by Whitney and Pagano [15] in conjunction with the Hertzian contact law to study the impact behavior of laminated composite plates. Ganapathy and Rao [16] predicted the damage growth in laminated composite plates and in cylindrical/spherical shell panels that were subjected to low-velocity impact.
This paper presents the results of an investigation on the damage caused by low-velocity impacts on T800 carbon fiber composite plates fabricated with different stacking sequences. We conducted experimental testing to investigate the initiation and evolution of the impact damage in CFRP composite plates with different stacking sequences under the same level of impact energy. Software was developed in LabVIEW to record the impact load and energy absorbed during low-velocity impact events. To perform the impact tests, an instrumented drop test machine was used, and the impact energy was set to 23.62 J.
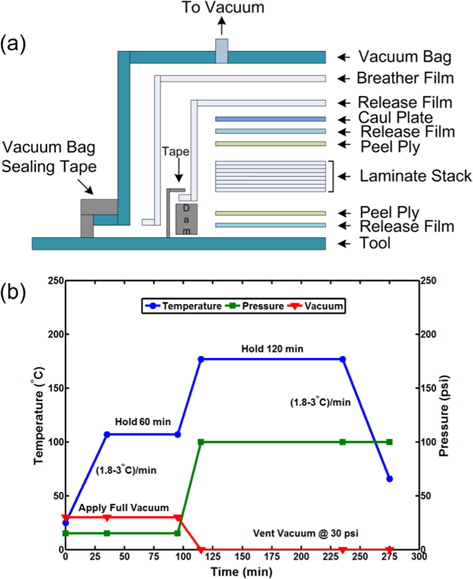
The material used as the substrate for the specimens in this study is an epoxy resin toughened at 350° F and pre-impregnated with unidirectional carbon fibers of type Toray T800/3900. The material consists of T800 carbon fibers impregnated in an epoxy resin in which the resin holds the longitudinal continuous fibers together to form sheets of CFRP composite panels. It is currently being used in the construction of the Boeing 787. The curing cycle of the material is shown in Fig. 1. Large CFRP composite panels of 1000 × 1000 × 1.5 mm were fabricated and cut to produce the laminated plate specimens of 125 × 125 × 1.5 mm with 8 plies. The averaged fiber volume fraction of a specimen was 55.5%. The mechanical properties of a lamina are listed in Table 1. In this study, five types of CFRP composite plates with different stacking sequences were tested. They were made from rolls of pre-impregnated materials and assembled according to the desired stacking sequences listed in Table 2.
[Table 1.] The material properties of the unidirectional layer
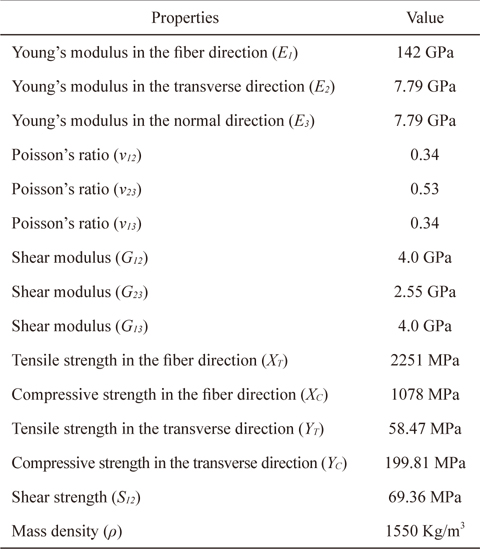
The material properties of the unidirectional layer
[Table 2.] The different stacking sequences of the specimens
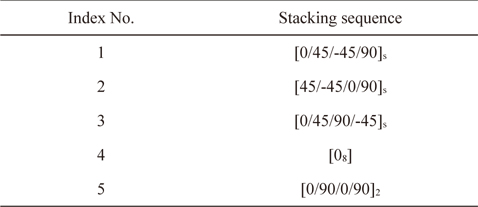
The different stacking sequences of the specimens
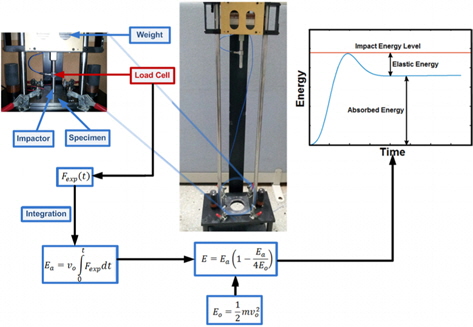
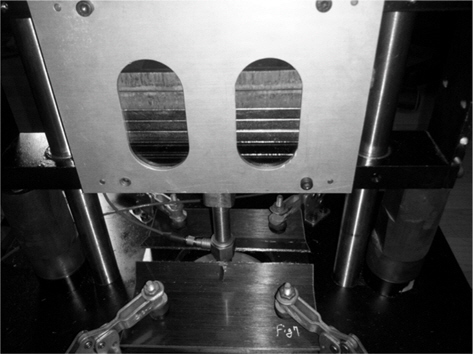
The experimental setup used for the low-velocity impact testing is shown in Fig. 2. A mini-drop tower machine was used to conduct the low-velocity impact tests. Sophisticated instruments were used with the drop machine to record the impact events, and a window-based data acquisition program was developed in LabVIEW 2010 to obtain the impact force and absorbed energy history. The total mass (
3.1. Analysis of impact damage
The impact damage mechanism in a composite laminate is a highly complex process because it is a combination of damage processes, including matrix cracking, surface buckling, delamination, fiber breakage, and fiber splitting. These damage mechanisms usually interact with each other in low-velocity impact tests. A composite plate is made up of several orthotropic layers and each layer tends to deform in a particular way. Transverse normal and shear stresses were applied at the interfaces, and delamination occurred when these inter-laminar stresses became too large under concentrated contact loads. Delamination in a composite laminate is caused by the mismatch between the rebending stiffness of the plies with different fiber orientations, and it propagates along the direction of the fibers [17]. The delamination pattern is dependent upon the stacking sequence of the composite plate. A delamination crack preferentially propagates through a matrix rich area, which is relatively less resistant than that of a fiber pathway [18]. Delamination of the plies is the primary damage mode in a low-velocity impact test, and the delamination energy is directly related to the damage size. The largest delamination damage generally occurs at the back face and becomes progressively smaller toward the impact face.
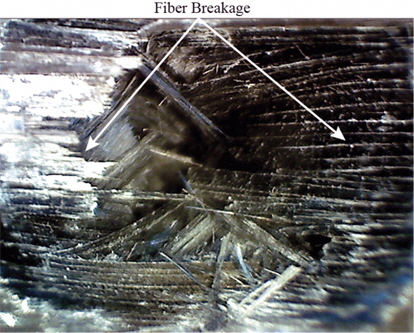
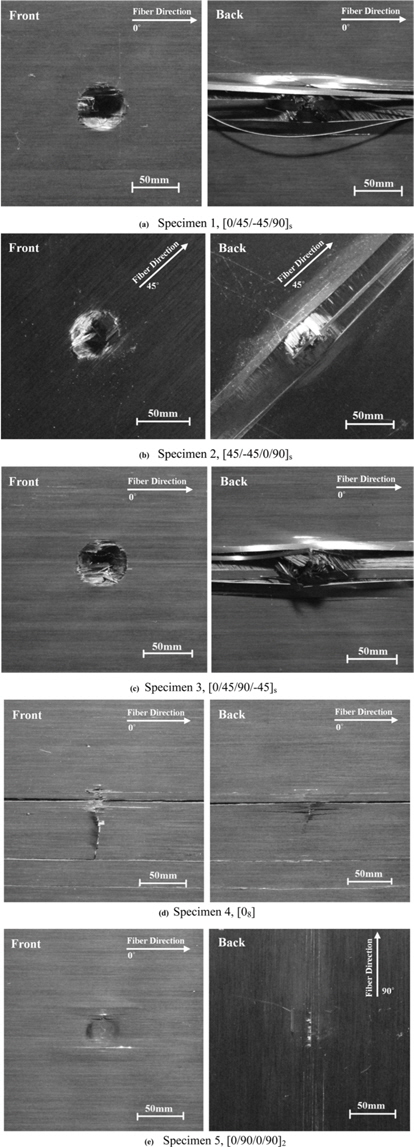
When an impactor was dropped onto Specimen 1, the plate was perforated. Fiber breakage was found at the centrally depressed zone on the impacted face of the plate shown in Fig. 3, although major damage mechanisms were not present in the quasi-isotropic (Specimen 1) composite laminate. Fiber breakage occurs under the impactor due to locally high stresses and indentation effects.
The front and back sides of each specimen after the impact test are shown in Fig. 4. Fig. 4a shows the damage pattern, shape, and size on the impacted and back faces of Specimen 1. On the front side of the specimen, the damage shape was more or less circular. The back face of the plate showed that delamination occurred between the last two layers of the plate. The impacted and back faces of Specimens 2 and 3 are shown in Fig. 4b and c, respectively. Specimens 1-3 are all the quasi-isotropic type and all showed similar damage patterns on the impacted and back faces of the plate. The large mismatch between the bending stiffness in the quasi-isotropic layers caused the large delamination.
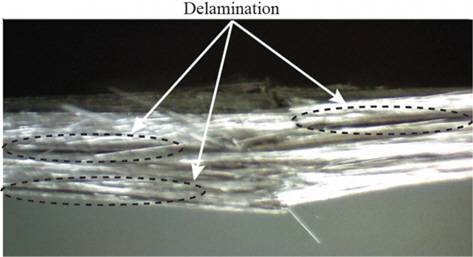
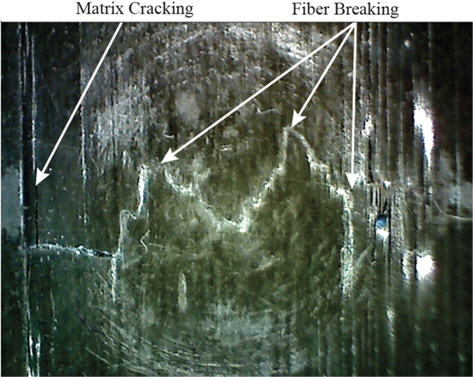
In the case of the unidirectional composite plate (Specimen 4), the plate was completely broken into two parts, resulting in no penetration of the impactor shown in Fig. 5. When the impactor hit the front side of the plate, matrix cracking occurred along the fiber direction and through the entire thickness of the plate. Compared to the quasi-isotropic plates, delamination between the last two layers and in the middle of the specimen depth was also observed shown in Fig. 6. Some matrix cracking was also observed along the fiber and transverse directions on the front and back sides of the plate shown in Fig. 4d. Because there was no bending stiffness mismatch in the unidirectional layers, only a small delamination took place between the layers. In the case of cross-ply Specimen 5, the impactor did not penetrate through the plate, but a small dent on the impacted side was observed. On the impacted side, different damage mechanisms like matrix cracking, crushing, and fibers breakage were observed shown in Fig. 7. On the back side, a small delamination between the last two layers took place due to stiffness mismatch shown in Fig. 4e.
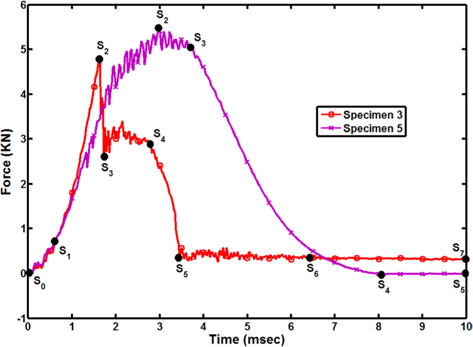
The impact force versus time curves provide a comprehensive depiction of the damage initiation and growth, as well as the changes in the specimen stiffness [19]. During the impact loading stage of the perforated plate case (Specimen 3), shown as point S0 to S1 in Fig. 8, the hemi-spherical head of the impactor started to contact the normal surface of the specimen, and as a result, it showed regular undulations, and then, a sudden load drop occurred at the beginning of the strike for all the specimens due to the local initiation of contact damages. Up to point S1, the sudden decrease is referred to as a Hertzian failure, which indicates that the incipient damage is mainly in the form of micro-matrix cracking and small inter-laminar delamination in the plate. This also indicates the specimen’s abrupt transition from an intact state to a damaged state. Therefore, this stage can be regarded as the initiation of the impact damage. From points S1 to S2, the impact force reached its peak value with no undulations, in the short time of approximately 1.5 ms. The impact damage developed quickly in this stage shown in Fig. 8. The peak load at point S2 rapidly dropped down to point S3, with undulations that were due to the rapid extension of delamination through the thickest direction of the specimen. After the rapid extension of the matrix dominant delamination up to point S3, some local breakages of fiber dominant layers started to increase the decaying force undulations until point S4. At point S4, the force suddenly decreased down to point S5, at which almost all of the remaining fiber dominant layers were broken and a sharp fall in the force curve occurred, due to the loose contact between the specimen and the impactor. Minor fluctuations of the force happened between S5 to S6, due to additional minor matrix cracking and the failure of the remaining local fibers. The last stage of the impact process is from point S6 to S7, and there was no further damage development in this stage.
For the rebounding case (Specimen 5) in Fig. 8, the small undulations from points S0 to S1 might be due to the initial contact between the hemi-spherical head of the impactor with the specimen surface, and this initiates the formation of small matrix cracking and delamination in the plate. The impact force reached its peak level with the undulations, and maximum matrix cracking, fiber breakage and delamination occurred between points S1 and S2. After reaching the peak load at point S2, local breakages of the fiber dominant layers started to produce force undulations until point S3. At point S3, the force started to drop down to point S4 when the impactor was also bouncing back, and there was no further damage development in this stage. The last stage is from point S4 to S5, when the impactor stopped after bouncing back.
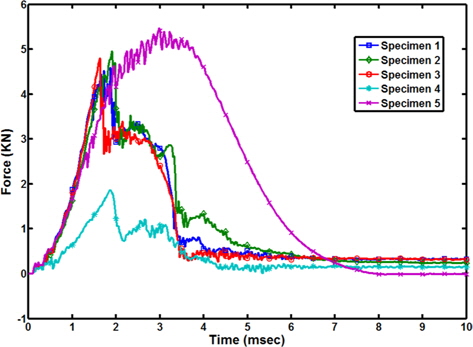
The impact forces versus time histories for all of the specimens are shown in Fig. 9. By comparing the impact force histories, it was noted that the unidirectional composite plate had the lowest impact peak force. The cross-ply composite plate had the highest impact peak force as well as the largest impulse area, among the force and time history curves of all the specimens. This means that the impactor and plate had a long contact time, and a high impact load was applied to Specimen 5. The unidirectional composite plate had the shortest contact time because the panel broke into two parts along the fiber direction immediately after the impact, ending up with no penetration of the impactor into the plate. This time was followed by the quasi-isotropic composite plates, and the cross-ply composite plate had the longest contact time. All of the quasi-isotropic composites showed similar levels of impact peak force, which was much higher than that for the unidirectional, but lower than that of the cross-ply composite.
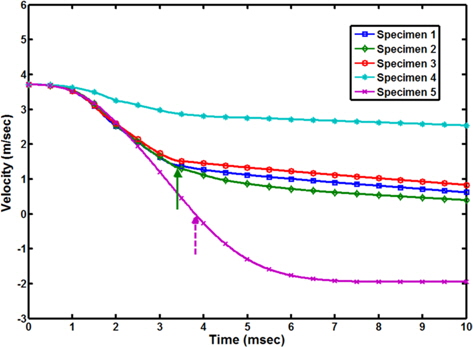
The curves of the impactor velocities versus time for all of the specimen types are shown in Fig. 10. After the transition time at approximately 3.4 ms for the quasi-isotropic specimens, the velocity of the impactor head decreased almost linearly and reached zero when the impactor stopped. For unidirectional Specimen 4, it was observed that a small reduction in the impactor velocity, corresponding to a small deceleration, occurred after the impactor struck Specimen 4, and the impactor continued further with a slightly decreased velocity even after breaking the plate into two parts. For cross-ply Specimen 5, the impactor velocity became zero, and the impactor began to rebound upward immediately after a transition time of approximately 3.8 ms, which is marked by a dashed arrow.
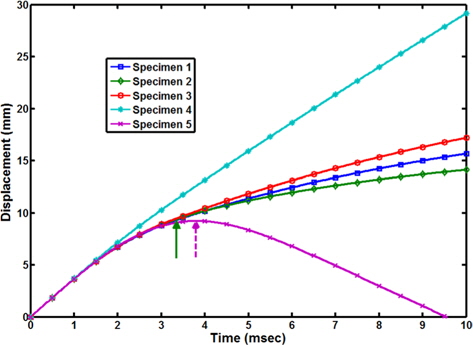
The impactor displacements versus time curves for all the specimens are shown in Fig. 11. In the case of plate perforation, the impactor penetrates further through the thickness of Specimen 3 compared to the other two quasi-isotropic composite plates, Specimens 1 and 2. For the quasi-isotropic specimens, the transition time (marked by a solid arrow in Fig. 11) was observed at approximately 3.4 ms, after which the displacements of the impactor for Specimens 1-3 began to increase in an almost a linear manner until the impactor finally stopped due to the friction between the penetrated circular edge of the plate and the impactor. When unidirectional Specimen 4 clearly broke into two parts, as shown in Fig. 5, it was observed that the impactor kept moving down, which further increased its displacement with no barrier shown in Fig. 11. For Specimen 5, the impactor started to bounce back after reaching its maximum displacement (or the maximum deflection of the plate at the impact point) without penetration at approximately 3.8 ms (marked by a dashed arrow) and returned to its original position at zero displacement when it was completely detached from the surface of the plate.
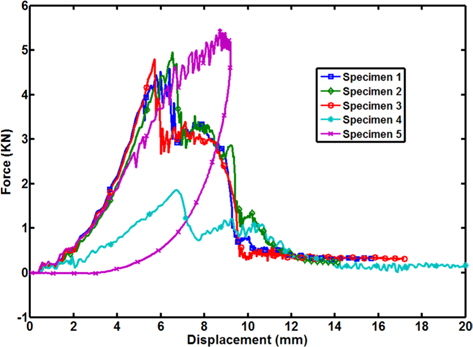
The impact force versus displacement curves for the five specimens with different stacking sequences are shown in Fig. 12. The areas of these curves represent the kinetic energies which were transferred to the composite plates during the impact. In this figure, the rebound and/or penetration characteristics of the impactor are clearly observed. For the cross-ply composite plate, the impactor rebounded, and the force-displacement curve folded into itself toward the decreasing displacement, while for the unidirectional and quasi-isotropic composite plates, the impactor penetrated through the plates, and the displacement increased monotonically but with decreasing force.
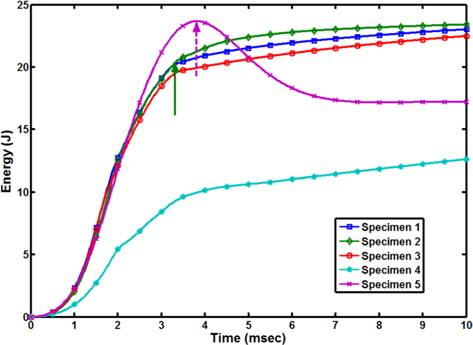
Under the same level of impact energy, the energy absorbed by the composite plates versus the time histories is shown in Fig. 13. The total energy (
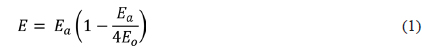
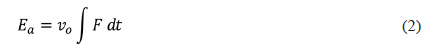
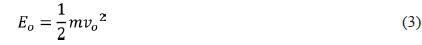
, where
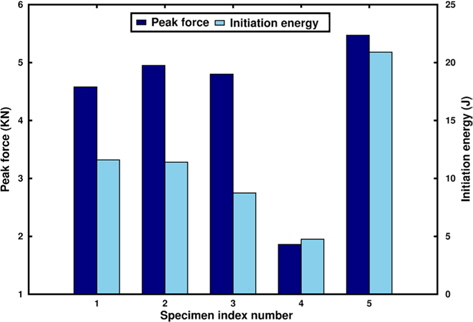
The load-time history can be divided into two distinct regions: the region of fracture initiation and the region of fracture propagation. The initiation energy (
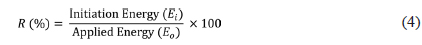
The peak load and initiation energy values for the quasi-isotropic specimens were approximately the same. To determine how much energy was absorbed by the specimen from the applied energy, the absorbed energy ratio, the percentage
The energy ratio, the value of the initiation energy of a composite plate normalized with respect to that of the cross-ply composite plate, was defined by Eq. (5) for the purpose of comparing the different composite laminates. These
[Table 3.] Parametric comparisons of the experimental results
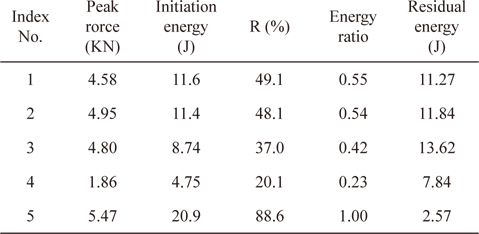
Parametric comparisons of the experimental results

Another finding from the low-velocity impact data was the further increase in the absorbed energy after the peak force or initiation energy had been reached (i.e., after

In classical lamination plate theory [20], the strain energy (
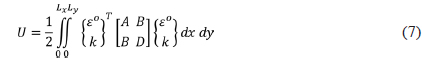
, where
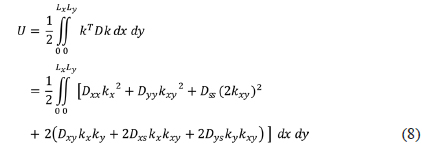

If only the contribution of the bending stiffness matrix in the strain energy is considered and any types of dynamic effects on the stored strain energy are disregarded, and then, the strain energy stored in the laminated composite plate with no warpage, i.e.,
This study presented an experimental investigation on the impact response of CFRP composite plates made by different stack-up configurations although the geometry, boundary condition, and material are identical. The following conclusive remarks are drawn from this study. From the force and energy histories, it was observed that the stacking sequence has a major effect on the impact parameters under low-velocity impact events. The unidirectional composite plate had the worst impact resistance followed by three different quasi-isotropic plates, while the cross-ply plate sustained the largest impact force and absorbed the largest energy; therefore, it is reasonable to conclude that this specific stacking sequence is preferable compared with the other composite plates. Under the same level of impact energy, the impactor penetrated through the quasi-isotropic composite plates, and a unidirectional plate was broken into two parts, while the impactor rebounded in the case of the cross-ply composite plate. The three different quasi-isotropic composite plates had similar damage patterns and impact behaviors. The