Achieving respiratory protection is a challenging task when air is contaminated with deadly persistent chemical warfare agents (CWA) such as sulphur mustard (HD). HD is a toxic CWA which causes blisters on exposure. It causes damage to skin, eyes and respiratory system. It is highly persistent, has a high boiling point and low volatility, and it remains in the environment for long intervals of time [1]. Adsorption systems containing granular activated carbon (GAC) have been employed for the purpose of purifying air contaminated with CWA for respiratory protection [2-6]. Breakthrough characteristics (BC) of the GAC bed depend upon the nature of adsorbate, nature of the adsorbent, surface functional groups, surface area, pore size distribution, bed geometry, granular size, air flow rate, concentration of contaminant, etc. [7,8]. From this viewpoint, Jonas et al. have studied the BC of GAC beds against nerve agents like dimethyl methyl phosphonate (DMMP) and isopropyl methyl phosphonofluoridate [9,10]. Later, Prasad et al. [11-13] studied the BC of a GAC bed, and a bed of Whetlerite carbon granules, against deadly vapours of HD. In both studies the modified Wheeler equation was used to analyze the adsorption parameters.
HD and DMMP were found to be strongly adsorbed on GAC due to low volatility and high affinity towards solid surfaces. The relative humidity (RH) of the contaminant air stream also affects the BC of carbon beds [14]. In spite of that fact, while many researchers have studied the effect of RH on BC of GAC beds against various organic vapours, reports on the effect of RH on the BC of GAC beds or activated charcoal cloth (ACC) beds against CWA are scanty. Kaplan et al. [14] have studied the BC of GAC beds against DMMP. Adsorption capacity value was found to be reduced with an increase in RH. To our knowledge, there have been no reports available on the effect of RH on the BC of HD or its surrogates on either GAC or ACC.
Filtration systems containing GAC beds have a rigid shape and more weight. Consequently, while they offer durable protection without any doubt, they are not suitable for incorporation in foldable masks due to their rigid shape. Foldable masks with shorter service lives are required for escape purposes from the place where the environment is contaminated by CWA. ACC has an advantage over GAC in that it can be engineered to any flaccid shape and hence is suitable for the fabrication of foldable masks for respiratory protection against CWA. Besides this, ACC shows better mass transport properties when compared to GAC due to its peculiar pore structure, in which more of its micro-pores are open directly to its outer surface [15]. Further, GAC produces more dust, thereby raising the possibility of entrance of carbon particles into the respiratory system.
Recently, ACC was found to demonstrate promising adsorption properties towards acidic gases like sulfur dioxide, and the efficiency seemed to be enhanced due to ammonia treatment [16]. ACC was also studied against a non-persistent, highly volatile CWA like hydrogen cyanide. Apparently, it showed very small adsorption and breakthrough time (BTT) values. To enhance the adsorption capacity of ACC against nonpersistent CWA like HCN, CNCl, and phosgene, it has to be impregnated with metal salts [17].
However, no one has studied the BC of ACC against persistent CWA like HD or its surrogates, such as bis(2-chloro ethyl) ether (oxygen analogue, OA). Use of actual CWA like HD (a blistering agent) in adsorption studies poses problems due to its toxicity. Extreme caution is required to handle this chemical in the laboratory. OA is a structurally similar molecule with better stability. Further, the values of the cross sectional area of HD and OA were found to 38.33 × 10⁻²⁰ m2 and 36.70 × 10⁻²⁰ m2, respectively. Hence, it is better and more user friendly to use OA for the evaluation of filtration systems [18].
Surface oxygen functional groups influence the adsorption properties of activated carbons to a great extent. They have more influence on adsorption properties than the values of surface area and porosity towards various adsorbates. To our knowledge none have studied the BC of oxidized ACC against CWA like HD or its surrogate OA, and compared the data with normal ACC. Inspired by the above, we have studied the BC of different types of ACC against OA. Data was analyzed using a modified Wheeler equation. The effect of RH, surface oxygen functional groups, concentration of contaminant, flow rate of contaminant mixture on BTT values were also studied.
Acetonitrile, acetone, methanol, XAD-2 resin, OA, hydrogen peroxide solution (30%), nitric acid, potassium persulfate were purchased from E.Merck India, Pvt. Ltd. Acetonitrile was purchased to extract the adsorbed OA on XAD-2 resin to monitor its concentration in the gas mixture. Acetone and methanol were purchased to wash the XAD-2 resin prior to its use. XAD-2 resin was used to prepare the adsorption tubes in order to facilitate the adsorption of OA for a particular interval of time to monitor the concentration of OA in the gas mixture. Hydrogen peroxide solution (30%), nitric acid, and potassium persulfate were purchased to prepare oxidized ACC. Ultrapure water was used for washing & oxidation of ACC. ACC samples ACC-1, ACC-2, ACC-3 were purchased from M/s.Chemviron Cloth Division, UK. HEG-1 and HEG-2 were ACC samples obtained from M/s Hindustan Electro Graphite Ltd., India. OACC-1 was prepared by treating ACC-1 with 30% H2O2 (1 g ACC-1/10 mL) in a stoppered bottle for 48 h. OACC-2 was prepared by boiling ACC-1 with 1N HNO3 (1 g ACC-1/10 mL) for 24 h in an RB flask fitted with a reflux condenser. OACC-3 was prepared by soaking ACC-1 with saturated solution of (NH4)2S2O8 for 48 h. After oxidation these samples were washed with hot double distilled water and dried overnight at 110˚C.
Surface area, pore size distribution, and pore volume were determined by adsorption of nitrogen at 77 K using a ASAP 2020 surface area analyzer of Micromeritics, USA. Fouriertransform infrared spectroscopy (FT-IR) data was measured using a Perkin Elmer, USA instrument. Samples were ground with dry KBr and the pellets were made. Subsequently, IR data was measured.
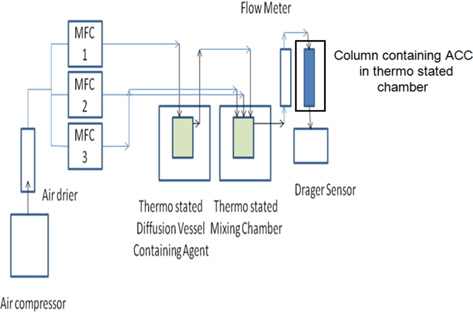
Gas mixtures of OA were generated by using an assembly fabricated by M/s Newchrom Technologies, Pvt. Ltd., India and is shown in Fig. 1. OA vapours were generated by using a slightly modified dynamic diffusion method. Dry air was used for all the experiments. Precautions were taken to avoid condensation of vapours by putting heat tape around the gas lining. Concentration of the gas mixture was measured by the standard reported method [19,20]. A gas mixture stream with a constant flow rate was drawn through the adsorption tubes filled with XAD-2 resin in order to facilitate the adsorption of OA for a particular interval of time. Thereafter, adsorbed OA was extracted with acetonitrile and analyzed by GCFID (BP1 column of 30 ft length, 0.33 mm i.d. at isothermal conditions). Under the same condition, a column containing layers of ACC was challenged with OA contaminated air mixture to determine the BTT values at different number of layers of ACC.
Experiments were repeated several times to check the reproducibility of BTT data. Breakthrough experiments were carried out in a column of 20 mm dia where the cloth samples were cut into pieces of 20 mm dia and incorporated in the column to challenge them with contaminated air. Concentration of the outlet vapour was measured by a German Drager X-am 7000 sensor for 2 ppm. BTT data was analyzed using the modified Wheeler equation. ACC samples of one square meter area and uniform thickness were carefully weighed to determine the surface density (weight per unit area) values.
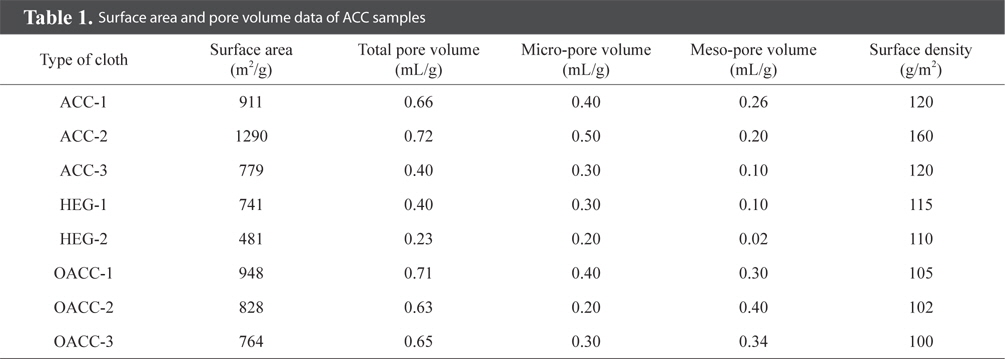
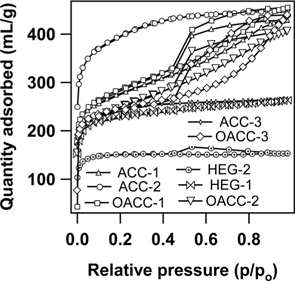
Nitrogen adsorption isotherms of ACC samples measured at 77 K are presented in Fig. 2. ACC-2, ACC-3, HEG-1, and HEG-2 samples demonstrated type I adsorption isotherms, and this observation is a typical characteristic of micro-porous materials. In contrast, ACC-1, OACC-1, OACC-2 and OACC-3 exhibited type IV adsorption isotherms depicting the presence of meso and micro-porosity, and the same can be seen in Fig. 2 and Table 1.
Amongst the samples, ACC-2 showed the highest value of surface area and pore volume. OACC-1, OACC-2 and OACC-3 samples were the oxidized forms of ACC-1. In the case of OACC-1 (30% H2O2 treatment), micro pore volume remained intact and meso-pore volume value increased by only 0.04 mL/g, indicating mild oxidation treatment without affecting the micro pore structure. However, in the case of OACC-2 and OACC-3, micro pore volume values were drastically reduced and meso pore volume values significantly increased, indicating pore widening and the creation of additional meso-pores when compared to that of OACC-1. This could be attributed to the strong oxidative action of HNO3 and K2S2O8 towards ACC-1 which led to a drastic reduction in the values of surface area due to the collapse of micro-pore structure when compared to 30% H2O2. The same is apparent from the increased meso-pore volume and decreased micro-pore volume values (Table 1).
In addition to the value of surface area, surface density also plays a significant role in trapping contaminant gas molecules. The coarser the fiber structure in the cloth, the larger the surface density, and this produces finer chances of contaminant trapping in the ACC. For this purpose, surface density values were determined. ACC-1, ACC-2, ACC-3, OACC-1, OACC-2, OACC-3, HEG-1, and HEG-2 exhibited surface density values in the range of 120 to 160 g/m2 (Table 1).
FT-IR data of untreated samples indicated peaks at 2920 and 2842 cm-1 illustrating the presence of –C-H groups. In addition to this, a peak of 1720 cm-1 was also observed, depicting the presence of C=O groups. Besides these, C-O (1250 cm-1), O-H (3500 cm-1) were also observed. In the case of oxidized samples, a large increase in the intensity of bands at 1720 cm-1 was observed, which can be attributed to the formation of 3400 cm-1 carboxyl groups. In addition to these a band at -1290 cm-1 was also observed, indicating the presence of C-O-C group (1290 cm-1). Data indicated the formation of carboxyl, lactone, ketonic, alcoholic, phenolic and ether groups after oxidation treatment.
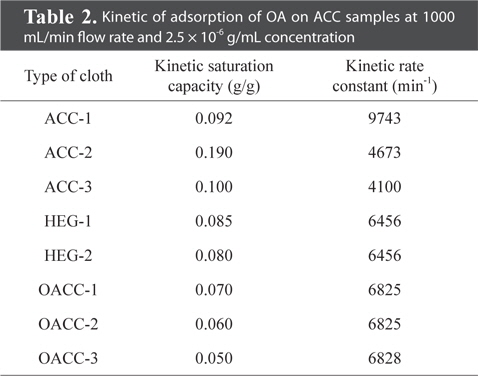
The breakthrough behaviour of ACC-1, ACC-2, ACC-3, HEG-1, HEG-2, OACC-1, OACC-2 and OACC-3 against OA was analyzed by using the modified Wheeler equation, and is presented in the form of kinetic saturation capacity (We) and rate constant (kr) in Table 2. BTT values were obtained and plotted versus different weights of ACC. Apparently, the value of BTT increased with increased weight of ACC. It can be clearly seen that ACC-2 exhibited better BTT values relative to other cloth samples. This observation can be ascribed to the relatively higher surface area, surface density and better packing of charcoal cloth fibers within the ACC.
ACC-2 exhibited a surface area value of 1290 m2/g, which was relatively higher than others as per Tables 1 and 2. Higher surface area value imparted larger adsorption capacity to the ACC which resulted in higher BTT values against OA.
However, the kinetic rate constant value of ACC-2 (4673 min-1) was found to be less than that of ACC-1 (9743 min-1). In spite of the fact that the value of surface area of ACC-2 was higher than that of ACC-1 (911 m2/g), it exhibited a lesser kinetic rate constant value. This observation can be attributed to two reasons. One is the coarser fiber structure and larger surface density of ACC-2 compared with ACC-1. The other is that ACC-1 contains both micro and meso-porous structures, where ACC-2 predominantly contains the micro-pore structure. The smaller pores can slow the diffusion of OA molecules. This could also be a reason for the relatively lower kinetic rate constant value (Table 2).
In the case of ACC-3, the surface area value was found to be 779 m2/g, which was apparently less than ACC-1, and the value of surface density of the cloth was also relatively higher than that of ACC-1.
Surface oxygen functional groups significantly influence the adsorption capacity of ACC samples and the same is apparent from Table 2. OACC-1 possessed higher value of surface area than ACC-1. In spite of this, OACC-1 exhibited relatively lower kinetic saturation capacity than ACC-1. This observation can be ascribed to surface oxygen functional groups.
The value of the surface area was measured based on adsorption experiments with nitrogen molecules. The OA molecule is bigger when compared to a nitrogen molecule. The diffusion and adsorption of OA molecules of relatively bigger size seemed to be partially hindered due to its interaction with surface oxygen functional groups. The polar nature of OA molecules and the oxidized surface assisted the stronger interaction between both, which could have lead to a hydrogen bonding-like interaction between the surface and OA, thus hindering the access of fresh OA molecules into the pores.
In addition to this, the internal surface of the pores also seemed to have been oxidized, leading to the production of surface oxygen functional groups. This can be detrimental to the diffusion and adsorption of molecules like OA, which in turn leads to a reduction of kinetic saturation capacity. This observation clearly indicated that the kinetic saturation capacity or adsorption capacity of the cloth not only depends upon the value of surface area but also depends on the nature of the adsorbate molecule and the nature of surface.
OACC-1 was prepared by oxidation with H2O2 as per the reported method [21]. Data indicated that K2S2O8 assisted the formation of the maximum amount of surface oxygen functional groups, while hydrogen peroxide facilitated the formation of the minimum amount of surface oxygen functional groups. It also indicated that oxidation with H2O2 created few new pores, which led to an increase of surface area relative to the original cloth sample. Oxidation with nitric acid and persulfate led to the collapse of the micro-pore structure which led to a drastic reduction in surface area value, which in turn led to a reduction of adsorption capacity towards OA. These observations are consistent with observed values of kinetic saturation capacity and are represented in Table 2.
The effect of RH on BTT values is of considerable interest to filter users as well as manufacturers. Although many reports are available on the effect of humidity on the breakthrough behaviour of carbons towards many organic vapours, literature on CWA and GAC or ACC is scanty. In particular, none have reported on the effect of RH on the breakthrough behaviour of ACC samples against blister agents like HD or its simulants.
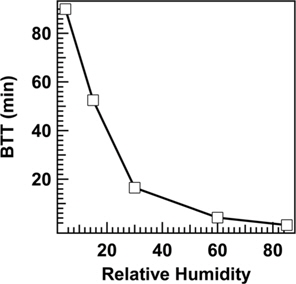
The effect of RH (5-85) on OA BTT values when 5 layers of ACC-1 were challenged with 3.35 × 10⁻⁷ g/mL concentration of OA at 1000 mL/min flow rate is illustrated in Fig. 3. At RH 5, BTT was found to be 90 min, which decreased to 16.5 min when RH was increased to 30, and then it declined to a minimum BTT value of 1.1 min when RH was increased to 85. These studies clearly indicated that BTT value was found to be drastically reduced when the RH of the contaminant air mixture increased to higher values, indicating the worsening of adsorption capacity due to increased RH. This observation can be explained by the increased ability of water molecules to compete for adsorption sites. However, the presence of relatively smaller quantities of water vapour was actually observed to increase adsorption of OA in comparison to water. When RH increased the water molecules predominantly raced ahead towards adsorption sites, thereby reducing the adsorption capacity of OA, which in turn reduced the BTT.
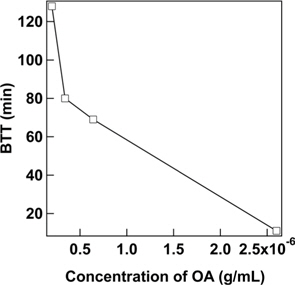
Concentration of the contaminant also seemed to influence the breakthrough behaviour of ACC towards OA. It was observed that when the concentration of contaminant increased from 2 × 10⁻⁷ g/mL to 2.6 × 10⁻⁶ g/mL, BTT value decreased from 128 to 11 min (Fig. 4). This result is consistent with reported data [17].
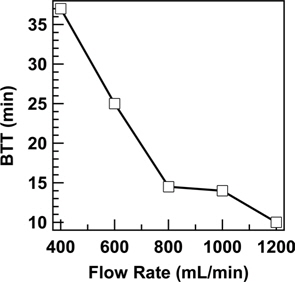
The breakthrough behaviour of ACC also depends on the flow rate of the gas mixture, and this was observed when we conducted the experiments at different flow rates, like 400, 600, 800, 1000, 1200 mL/min. BTT value was found to decrease when the flow rate of the air mixture was increased, and the same can be seen in Fig. 5. As the flow rate of the gas mixture increased the rate of diffusion of OA molecules through the ACC increased, thereby reducing the BTT value and breakthrough behaviour.
From the above studies and observations it can be understood that ACC-2, with better surface area and surface density values, was found to exhibit promising BTT values, thus securing its application in respiratory masks against CWA.
The breakthrough behavior of OA in packed beds of ACC depended on the ACC properties, such as surface area, surface density, etc. In addition to these, concentration, flow rate, RH etc., also were found to influence the BTT values of ACC beds when used against OA. ACC sample ACC-2 showed a relatively large kinetic saturation capacity against OA when compared to others. This observation has been attributed to its high surface area (1290 m2/g) and high surface density (160 g/m2) values.
Oxidation treatment with nitric acid and potassium persulfate led to decreased kinetic saturation capacity values, from 0.092 g/g (ACC-1, unoxidized) to 0.05 g/g (OACC-3, oxidized) and the same has been ascribed to decreased surface area values and increased surface oxygen functional groups.
With increasing RH from 5 to 85, the BTT value of ACC bed decreased from 90 to 1.1 min. BTT value was also found to be decreased from 37 to 10 min when the flow rate of the gas mixture containing OA increased from 400 to 1200 mL/min.