The change of the chemical structure of graphene oxide (GO) was investigated by periodical sampling of GO during exfoliation by using a sonicator. A significant amount of GO was exfoliated during up to 10 hr of sonication. Raman and Fourier transform infrared spectroscopy revealed a continuous increase of the G/D or C=C/C=O peak ratio of GO, as the sonication time increases. The photoluminescence (PL) intensity of each GO sample also decreased as a function of the sonication time. PL excitation spectra with three major peaks indicate that the sizes of sp2 carbon clusters were enlarged by longer sonication. In addition, new excitation at around 300 nm proves the existence of newly developed small clusters of sp2 carbons as the sonication time increased.
Superior properties of graphene have been revealed such as giant carrier mobility [1,2], outstanding mechanical [3], thermal [4], chemical [5], and optical properties [6]. However, to commercialize graphene, it’s necessary to address how to achieve its mass production. One of the promising methods for the mass production of graphene is a chemical method, which includes chemical oxidation, sonication to detach graphene oxide (GO) from graphite, and then reduction of the isolated GO. But, the reduced GOs have slightly different properties from the graphene. Most of the research on GO are developed through the modifications of two well-known GO preparation methods, Staudenmaier method and the Hummers and Offeman method, by using KClO3 & HNO3 and KMnO4 & H2SO4 as oxidants, respectively [7-9].
The overall process for preparing GO can be summarized as follows: first, oxidizing the graphite; second, sonication of the oxidized graphite to exfoliate GO for a certain time; and finally, separation of the GO from the sonicated mixture. The process seems so simple that one can expect a uniform GO mixture by preparing it using this method. However, we can suppose that GO mixture is complicated, and it is consisted of various GO sheets with various oxygen groups on it [10]. The complexity of GO mixture can also be influenced by the defect sites of the source graphite, since oxidation can occur easily at such sites. The authors have been trying to simplify the oxygen groups in GO to reduce this complexity, for the benefit of highly sensitive electronics, by focusing on the sonication process to exfoliate GOs. Many studies have been surveyed, and we found that most of the experiments on GO exfoliation used the sonication method for various fixed time periods from 15 min to overnight [11-15].
The oxidation mechanism of graphite allows the oxidation reaction of graphite to occur everywhere on the surface of graphite, including the graphite edges. As the oxidation reaction proceeds, an elastic strain produced by hydroxyl and epoxy sites against the graphene layers, cracks some part of the surface, so that it can be oxidized by the oxidant again [16]. Consequently, the oxidation reaction can propagate through the crack sites until the reaction is stopped. Considering this observation, the GO mixtures should be consisting of fully oxidized to slightly oxidized graphene. Thus, if sonication is applied periodically to exfoliate and gather GO sequentially, we can expect to harvest GO with different distributions of oxygen functional groups. Based on this concept, in this paper, various GOs were exfoliated periodically during sonication, and their chemical structures were characterized.
GO was prepared from synthetic graphite (Aldrich, < 20 μm) by modification of Hummers’s method. The following is the detailed preparation method. First, 4 g of the graphite was dispersed into a mixture of 150 ml of H2SO4 (Dae Jung, 96%), which was then dissolved with 2 g of NaNO3 (Aldrich, 99%) in an ice bath and stirred by using a magnetic stirrer. Second, 12 g of KMnO4 (Aldrich, 99%) was added carefully to the mixture over a period of 15 min, with regular checks on the temperature of the reaction vessel to avoid a vigorous oxidative reaction. Then, the reaction temperature was adjusted to room temperature and was maintained for 1 hr. The reaction was stopped by slowly adding 300 ml of distilled water, and then H2O2 (Dae Jung, 30 wt %) was added until bubbles in the mixtures disappeared, which indicated the disappearance of un-reacted KMnO4. The oxidized graphite was centrifuged and cleaned repeatedly for over 18 times using distilled water, until the centrifuged solution didn’t show precipitations with BaCl2 solution. For exfoliation of the GO, the residues after cleaning were dispersed into 100 ml of distilled water in a beaker, and then it was sonicated for 5 min (GOa) by using a sonicator with 40 kHz & 200W. Next, the mixture was centrifuged and the supernatant containing the exfoliated GO was transferred to a vial. The solid residues from the first sonication were re-dispersed into 100 ml of distilled water in a beaker, and then it was sonicated for 15 min (GOb). Then, the mixture was centrifuged, and the supernatant containing the exfoliated GO was transferred to a vial. These steps were continued with various sonication times as follows: 30 min (GO1), 1 hr (GO2), 3 hrs (GO3), 3 hrs (GO4), 3 hrs (GO5), 5 hrs (GO6), and 5 hrs (GO7). The characterization of GOa (5 min) and GOb (15 min) were disregarded, owing to the possibility of contamination. Exfoliated GOs with different sonication periods were deposited on Si wafers and characterized using Raman (Horiba, LabRam HR) and Fourier transform infrared spectroscopy (FT-IR; Bruker, IFS66v/S). Photoluminescence (PL; Sinco, Fluromate FS-2) and excitation spectra were recorded to estimate the structure of sp2 carbons on GO.
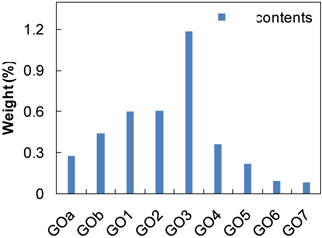
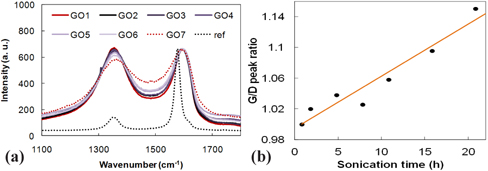
The colors of the collected GOs slightly differed, and they changed from yellowish dark black to dark black, depending on the sonication time. The dependence of the content of GO on sonication time, as shown in Fig. 1, was measured by gravimetric analysis, which indicated that a significant amount of GO was exfoliated for up to 10 hrs of sonication. Approximately 5 hr of sonication gave the highest GO content, which explains why those early researches on GO exfoliation typically adapted 6 hr of sonication. Normalized Raman spectra of each of the GO samples were measured by using 514 nm from an Ar ion laser, which have been used widely to characterize GO structure [17,18]. The results are shown in Fig. 2, and they were compared to the source graphite (dotted line) in a range of 1,000 - 2,000 cm-1. Raman spectra of the source graphite as a reference shows that two different bands originated from the in-phase vibration at 1575 cm-1 (namely the G band), and defects existed in the graphite edges at around 1,330 cm-1 (namely the D band which generally shows low intensity). Compared to the graphite, all of the GO samples showed a broadened and blue-shifted G band at around 1,590 cm-1, and a weak D band at around 1,355 cm-1. The broadened & blue-shifted G band and the weak D band are typical GO’s peaks reported in many studies [17]. Interestingly, the longer sonicated samples show a slightly red-shifted G band, compared to the shorter sonicated samples. As the sonication time increased, the band width of the G and D bands also increased. The broadening of the G band can be explained by two main reasons: first, an increase in unveiled sp2 carbon with the graphene structure, as the surface GO exfoliated; and second, the D’-like band produced by the highly disordered graphene structure reported in a graphite structure with large defects at around 1,620 cm-1 (or other bands) [18]. Fig. 2(b) shows that the G/D peak ratio increased as the sonication time was increased, which supports the explanation that longer sonicated GO has some sp2 carbons with a graphene structure unveiled.
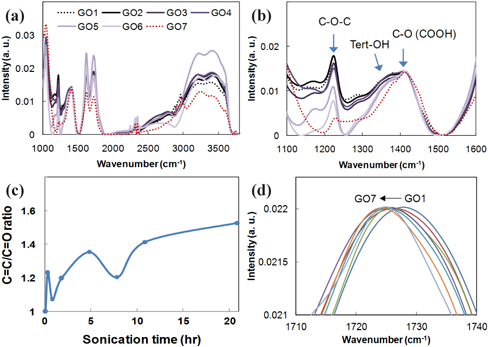
The FT-IR spectra in Fig. 3, of various GOs depending on sonication time, indicates several major peaks that are assigned to epoxies (
If functional groups of GO are randomly distributed in the GO structure, a change of peak intensity for C=O, C=C, and tertiary alcohol can indicate a quantitative structural change of the GO. Normalized FT-IR spectra to C-O (COOH) between 1,100 and 1,600 cm-1 gave two distinguishable changes, as shown in Fig. 3(b). The
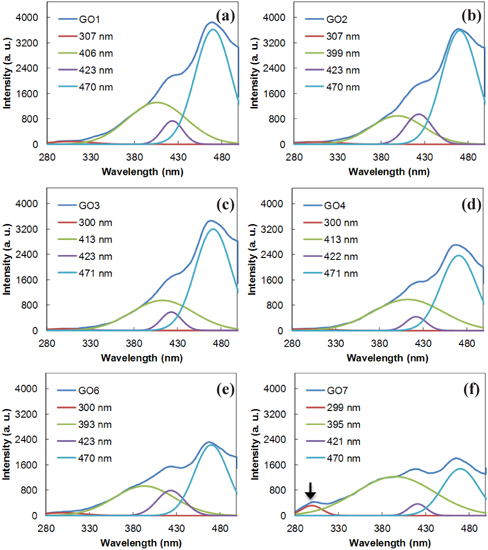
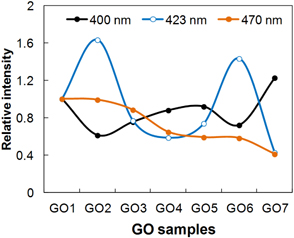
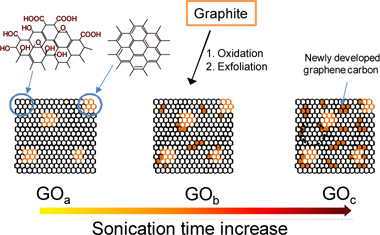
GO has several excitation or absorption peaks attributed to the ϖ-ϖ* transitions of C=C, n-ϖ* transitions of C=O, and various ϖ-ϖ* transitions of conjugated carbon clusters localized in the sp3 carbons [21]. Recent studies on the PL of chemically derived GO revealed that the sp2 carbon domains can act as luminescence centers, if the sp2 carbons are localized in the sp3 carbon matrix in GO [22,23]. In addition, studies on the reduction of GO by using a hydrazine stated that the PL excitation (PLE) and the PL intensity is decreased as the reduction reaction time of GO increases [22,23]. The PL spectra excited at 463 nm in Fig. 4 shows a trend of intensity reduction. This indicates that longer sonication gives a higher ratio of sp2/sp3 carbons, which is consistent with Raman and FT-IR results. The PLE spectra in Fig. 4 shows that there are three main excitations. Considering that the PL from GO originates from the sp2 carbons clusters localized in the sp3 carbon matrix in GO, as mentioned above, this result indicates that mainly three different localized sp2 carbons exist where radiative recombination of e-h pairs occurs. Supposing that the major peaks originate from a similar structural unit of a fused aromatic ring (FAR), although there are many different FAR structures, the highest occupied molecular orbital (HOMO) and lowest occupied molecular orbital (LUMO) energy gap of FARs in the literature indicate that the localized sp2 carbon clusters on GO are related to FARs. These are with the perylene units such as benzo(g,h,i)perylene, coronene, tribenzo[cd,ghi,lm]perylene, and others, which have a similar HOMO-LUMO gap between 3.1 eV, corresponding to 400 nm, and 2.6 eV, corresponding to 470 nm. The small differences in energy gaps apparently resulted from the environment of the localized sp2 carbons on GO. In the PLE spectra, interestingly, the peak at around 423 nm fluctuated, dependent on the sonication time, while the peak at around 470 nm of the main excitation peak in GO gradually decreased. In addition, the GO sample that was sonicated for a longer period showed a stronger excitation peak at around 400 nm, as shown in Fig. 5. Considering that the energy of ϖ-ϖ* transitions in the conjugated sp2 carbon clusters becomes smaller as the conjugation length increases [21], the decrease of the main peak at around 460 nm indicates the development of larger sized sp2 carbon clusters. The PLE results also showed that localized sp2 carbon clusters, smaller than the original localized clusters on the initially exfoliated GO1, have been newly developed. The initially localized sp2 carbon clusters, meanwhile, are connected with other sp2 carbon clusters, leading to a decrease in their number as the sonication proceeded and to a reduction of the PL intensity. The increase of the shoulder peak at around 300 nm, especially from GO7 in Fig. 4(f), appears to be direct evidence of a newly developing sp2 carbon in GO. Based on these observations, the growth of sp2 carbons by sonication appears to take two different paths, as shown in Fig. (6): the development of new, small sp2 carbons and the enlargement of all clusters including the new clusters.
In summary, the sequential time-dependent exfoliation of GO demonstrated that a significant amount of GO could be exfoliated during up to 10 hr of sonication. Each GO sample obtained from a different period of sonication time showed a different spectrum in Raman, FT-IR, UV-Vis, and PL. Raman spectra changed with a pattern dependent on sonication time as follows: asymmetrical broadening of the G and D peaks of the GO samples, and an increase of the G/D peak ratio of the GOs as the sonication time was increased. These results shed light on the structural change of the GO- especially, the decrease of oxygen derivatives, which can be proven by the increase of sp2 carbon along with sonication time. The FT-IR spectra also showed an increase of the C=C/C=O ratio, dependent on the sonication time. A similar trend was observed in the PL spectra, the intensity of which was directly related to the number of sp2 carbon clusters of reasonable size. The main excitation at around 460 nm in all the GO samples was decreased with an increase of sonication time, which indicated that the sizes of the sp2 carbon clusters were enlarged by the sonication. In addition, the increasing excitation at around 370 nm and a new excitation at around 300 nm prove the existence of newly developed small clusters of sp2 carbons, as the sonication time increased. There are many factors involved with the preparation of GO, such as reaction time, temperature, concentration of reactant, and graphite source. Based on this study, conclusively, sonication time is one of the most important factors in obtaining a well-defined GO sample, not only because of the reduction in GO size, as reported in the literature, but it is also because of the change in the chemical structure of GO.