In this paper, we compare the quality of images reconstructed by a conventional delayed-sum (DS) algorithm and radiation pattern-based DS algorithm. In order to evaluate the quality of images, we apply the target-to-clutter ratio (TCR), which is commonly used in synthetic aperture radar (SAR) image assessment. The radiation pattern-based DS algorithm enhances the TCR of the image by focusing the target signals and preventing contamination of the radar scene. We first consider synthetic data obtained through GprMax2D/3D, a finite-difference time-domain (FDTD) forward solver. Experimental data of a 2-GHz bandwidth stepped-frequency signal are collected using a vector network analyzer (VNA) in an anechoic chamber setup. The radiation pattern-based DS algorithm shows a 6.7-dB higher TCR compared to the conventional DS algorithm.
Through-the-wall radar imaging (TWRI) is an emerging area of research and development dealing with ‘seeing’ the target behind the wall. There have been many studies on TWRI. Some have focused on TWRI system architecture [1], while others have investigated signal processing issues related to TWRI [2–4]. To make the system more complete, however, suitable reconstruction of the radar scene is indispensable. Various reconstruction algorithms have been developed to process TWR measurement data. Several of these are based on beamforming or beam-space multiple signal classification (MUSIC) [5], while others cast the TWRI problem as an inverse scattering problem [6,7]. Among the reconstruction algorithms, a delayed-sum (DS) algorithm is widely used because of its algorithmic simplicity and robustness [8]. The conventional DS algorithm uses only the range information of measured data, although the TWR antenna has its own radiation pattern.
In this paper, the synthetic and experimental results of TWRI are presented using a radiation pattern-based DS algorithm. We assume that wall clutter is adequately removed using the subspace projection method. Images are evaluated using the target-to-clutter ratio (TCR), which is widely used in synthetic aperture radar (SAR). This paper shows that a radiation pattern-based DS algorithm shows higher TCR compared to the conventional DS algorithm.
This paper is organized as follows: in Section II, we present the basic theory of TWRI. Then, Sections III and IV deal with the simulation and experiment results. Finally, a conclusion is presented in Section V.
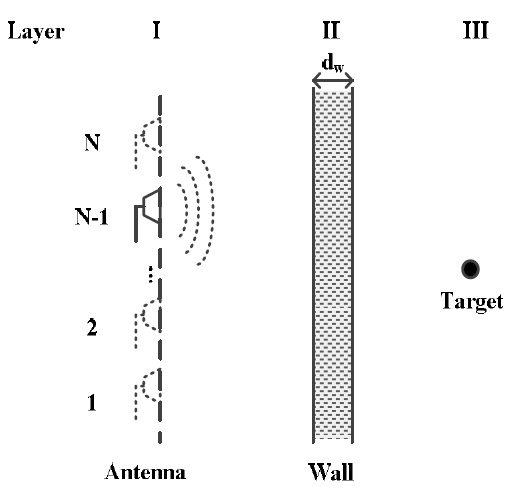
We apply SAR signal modeling for TWRI, as depicted in Fig. 1. The second layer is a wall with thickness represented by dw and permittivity by ԑw. The first and third layers are free space. We assume a monostatic radar case, and
where
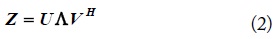
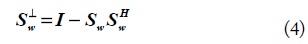
In TWRI, strong reflections from the wall often cause the target signal to become obscured. There are various methods of mitigating such wall clutter [2–4]. In this paper, we adopt the subspace projection method. This is based on the fact that the most significant terms of signal spectrum are dominated by the wall clutter. A received signal matrix,

with

where
3. The Conventional DS Algorithm
A DS algorithm is a simple and robust image reconstruction algorithm for TWRI. The

where τ
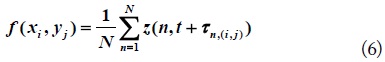
4. The Radiation Pattern-Based DS Algorithm
The conventional DS algorithm considers only a range of targets. This makes the radar scene contaminated. In order to obtain a clean radar scene and cross-range resolution that is independent of slant-range, the aperture segment length has to be directly proportional to the slant-range [9]. This is equivalent to keeping the integration angle at a fixed value. By using a radiation pattern window, a similar effect can be achieved simply. The DS algorithm can be rewritten as follows:

where
5. The Target-to-Clutter Ratio
TCR is commonly used to evaluate the quality of a SAR image. TCR is calculated as [8]:

where
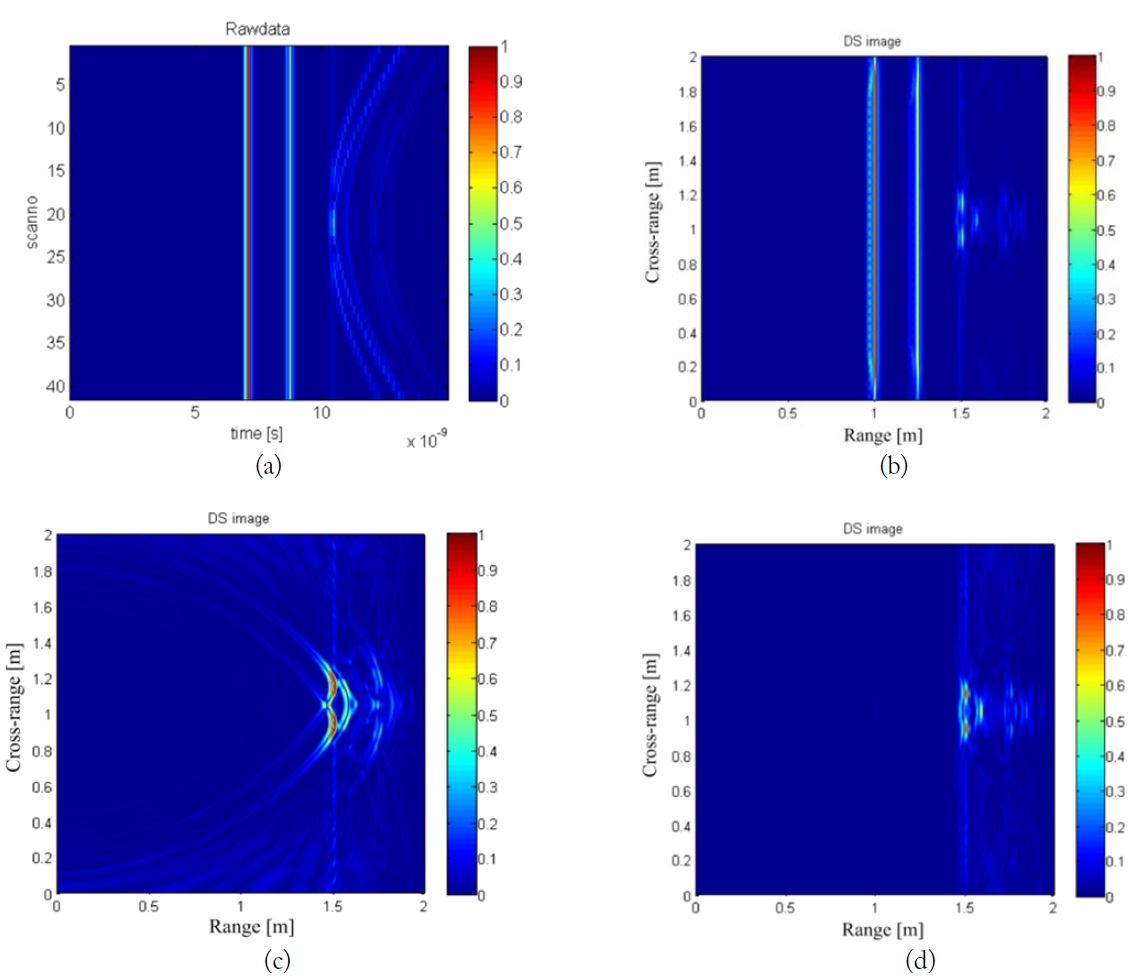
In order to verify the theory, we first consider the simulated data obtained through a finite-difference time-domain (FDTD) forward solver [10]. Elementary current sources located at a standoff distance of
[Table 1.] TCR measurement results (for Fig. 3)
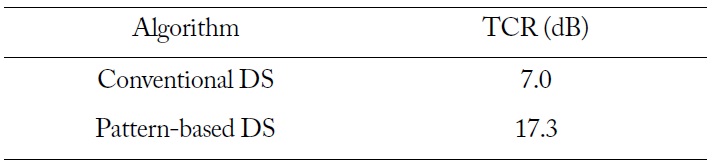
TCR measurement results (for Fig. 3)
Basically, the elementary current source has an isotropic radiation pattern so the pattern-based DS algorithm is not practical. However, using a directional radiation pattern window, we can reconstruct a more focused target image. In addition, assuming a directional pattern can make the wall clutter area cleaner. This makes the TCR superior to the conventional DS algorithm.
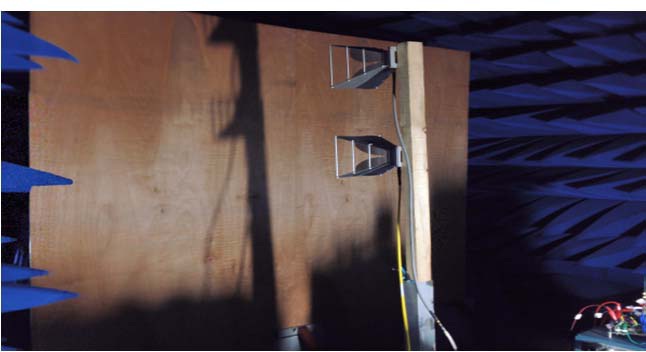
To validate the theory, an experiment is carried out. The experimental setup is implemented with dual-ridged horn antennas (DRH-020-180) [11] having radiation pattern of Fig. 4 and a vector network analyzer (VNA; Agilent E5071B). A linear array of 2.0 m and 0.1 m spacing between antenna locations is synthesized. The VNA generates a 2-GHz bandwidth stepped-frequency signal covering 4–6 GHz with a 40 MHz frequency step. Using an inverse Fourier transform (IFT),
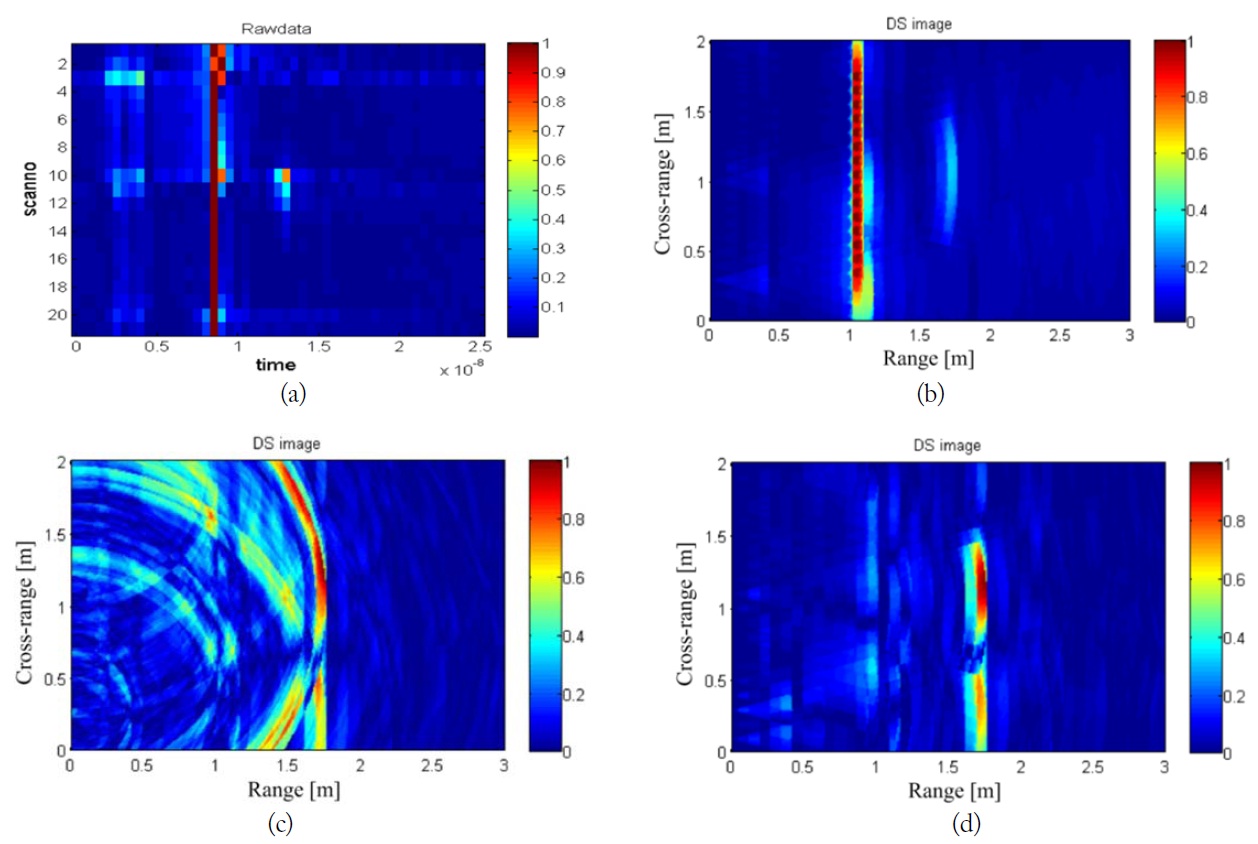
Fig. 6 and Table 2 show the DS images and TCR results, respectively. To describe the radiation pattern more simply, we assumed that the radiation pattern has a cos10θ variation. This assumption fits well in a certain angle in which most of the energy exists. The TCR of the image reconstructed by the radiation pattern-based DS algorithm is improved 6.7 dB compared to the conventional DS algorithm. Some remaining clutter near the target in Fig. 6(c) is presumed to be the non-ideal measurement effect. To mitigate that kind of error, more precise experiments are needed.
[Table 2.] TCR measurement results (for Fig. 6)
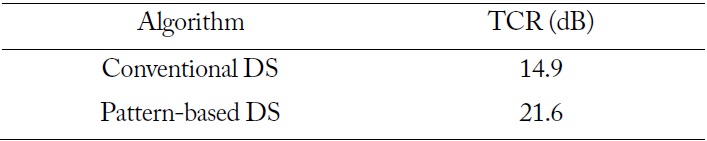
TCR measurement results (for Fig. 6)
In this paper, the performance of the conventional and radiation pattern-based DS algorithms was presented. Synthetic and experimental data were used to evaluate the TCR. As a result, the TCR of the radiation pattern-based DS algorithm showed a remarkable improvement over the conventional DS algorithm.
There are two main reasons for this improvement. First, the radiation pattern-based DS algorithm prevents contamination of the radar scene with the same distance from the antenna to the target. Second, it concentrates the target signal more closely. In the simulation result, the target is imaged at a slightly longer distance from the antenna because we did not consider the wave delay in the dielectric medium. Future work could be directed toward the study of the effect of wall parameters in TWRI, wall clutter mitigation, TWRI in inhomogeneous wall cases, and so on.