검색 전체 메뉴
PDF
맨 위로
OA 학술지
Measurement Data Comparison of Fast SAR Measurement System by Probe Arrays with Robot Scanning SAR Measurement System
  • 비영리 CC BY-NC
  • 비영리 CC BY-NC
ABSTRACT
Measurement Data Comparison of Fast SAR Measurement System by Probe Arrays with Robot Scanning SAR Measurement System
KEYWORD
2D Array , E-Field Probe , Fast SAR , Human Safety , Radio Frequency
  • I. INTRODUCTION

    Evaluation of exposure of radio frequency to human body by using modern wireless devices is conducted by measuring Specific Absorption Rate (SAR).

    The way to find the spatial distribution of E-field in the volume of the simulant human body is performed by robot scanning. This system takes a very long time to evaluate the SAR value of a mobile device because of robot motion to each point to access the SAR value. To promote a fast evaluation of the SAR value, 2D array of E-field probes having 3 axes isotropic characteristics was suggested [1-3].

    To be a reliable fast SAR measurement system, SAR values by the fast system should give out the similar values irrespective of the measurement position of the mobile devices. Also it should yield the plausible SAR values of the robot scanning SAR measurement system.

    If the two above conditions are satisfied, a good fast SAR system should have a reasonable linearity characteristics or wide dynamic range. To confirm those performances, SAR values by RF driving position were checked and SAR values by the fast system and by robot scanning system were compared, and SAR value variations to the driving RF input power were examined.

    II. CONCEPT OF SAR

    SAR at a point in the lossy homogeneous medium exposed by high frequency electromagnetic field is defined in Eq. (1).
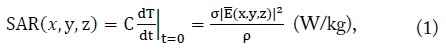
    image

    where C is specific heat capacity of the medium (J/kg · ℃), σ is electrical conductivity of the stimulant medium (S/m), is electric field intensity in RMS (V/m), and ρ is mass density of the medium where SAR is to be measured (kg/m3). Mass density in the medium ρ(x, y, z) is generally set to be 1,000 kg/m3 of the pure water regardless of the position or the material of the phantom for the estimation of SAR values.

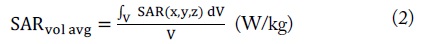
    Usually the SAR of the Wireless Device (WD) is estimated by volume average of Eq. (2).

    image

    V in Eq. (2) is the integration volume for averaging the point SAR values in the stimulant tissue, which is usually 1 cm3 or 10 cm3 for 1 g or 10 g estimation in many national or international standards [4-7].

    Typically the electric field to calculate SAR value is obtained by E-field probe [6]. The E-field probes consist of a set of three mutually orthogonal center-fed short dipole antennas. The E-field vector magnitude is the Root Sum Square (RSS) of the three orthogonal components by the sensors, as shown in Eq. (3).

    image

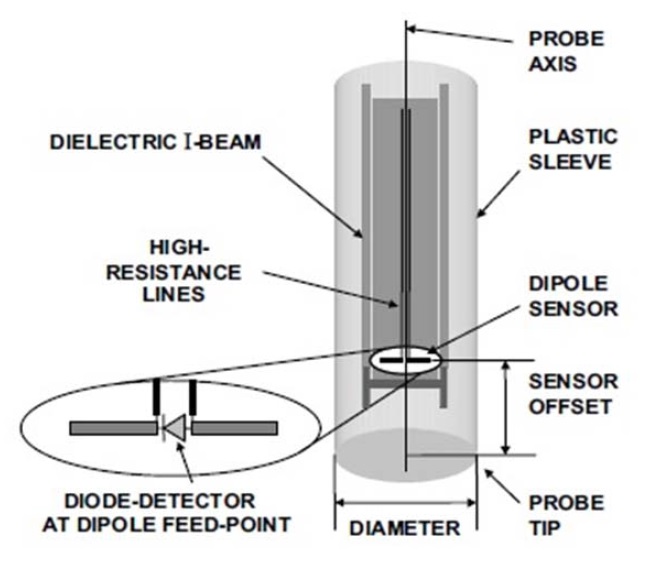
    Fig. 1 shows that each sensor of the probe consists of an electrically short dipole antenna, a diode detector at the dipole feed-point, a dielectric mechanical support, and a highly resistive, RF-transparent, differential transmission line (feedline) to extract the signal detected by the diode while maintaining the RF-transparency of the line. And a dielectric cover (typically a cylindrical low-loss plastic sleeve) encloses the probe for chemical and mechanical protection. Fig. 2 shows E-field probe relevant features [8].

    The basic principles of 3D SAR estimation from 2D data are based on the exponential decay of the propagating field in the heavily loss medium. The SAR at an arbitrary point can be simply expressed by Eq. (4) if the characteristics of the incident wave behave like an attenuating planar wave [9].
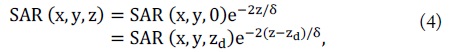
    image

    where δ is penetration depth of the medium at an angular frequency ω, and zd is detecting diode position in Fig. 3. Wave penetration depth in the medium is given by,

    image

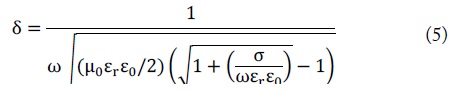
    Because it is not convenient to exchange repeatedly the internal phantom material of this fast SAR measurement system by the different measurement frequency, it is favorable that the human-simulating media have properties of very wide bandwidth satisfying the artificially required dielectric permittivities and electric conductivities.

    Considering the exponential decay of the radiating field in the medium, the peak volume average SAR to be estimated in a volume
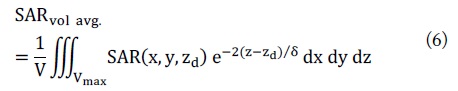
 V is expressed by Eq. (6).

    image

    where zd is again the position of the field detecting sensors in the medium. If V is a cube of Lc in Fig. 3, the SAR will be calculated by Eq. (7).

    image

    Amax in Eq. (7) is the planar or curved square surface of Lc in the medium which contains the maximum point SAR position.

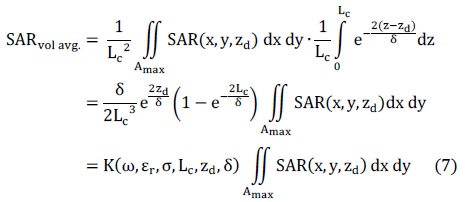
    All of the planar data SAR(x, y, zd) are acquired by the neighboring multiple probes of 15-mm apart with 4.8 mm diameter in this research for the sampling, and the data are interpolated by bicubic interpolation algorithm which guarantees continuity of the first gradient and cross-derivative. Probe neighboring distance (15 mm) was deliberately decided between the perturbation error by probe volume in the phantom medium and data interpolation error between the neighboring probes. It has been found that a 20 mm × 20 mm measurement grid is usually sufficient to achieve the required interpolation accuracy for locating SAR peaks within 5 mm when two staggered one-dimensional cubic splines are used to estimate the maximum SAR location [6,10]. Probe neighboring distance should be greater than the diameter of the probes for proper arrays. If the distance between the neighboring probes becomes larger, the interpolated datum for each point SAR would have more inaccuracy.

    It is very difficult to measure the coupling level between the two neighboring probes. The length of dipole antennas in the probe is so short and the environmental liquid between the probes are very lossy, we assume the mutual coupling between the neighboring probes are negligible. After interpolation process, re-sampled data by a 1-mm step are calculated to give a 2D planar point SAR for the volumetric calculation by Eq. (7).

    III. PERFORMANCE CHECK OF FAST SAR MEASUREMENT SYSTEM

       1. Structure of Fast SAR Measurement System

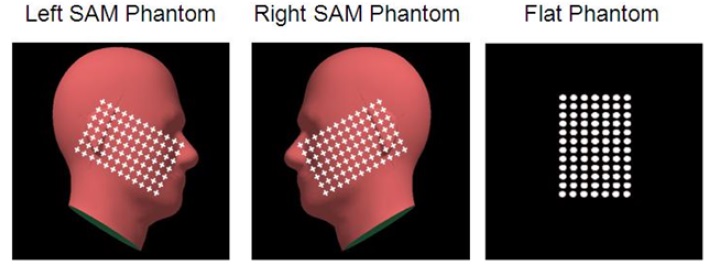
    Fast SAR measurement system sets probes in array by constant interval in SAM phantom or in body phantom to calculate volume SAR of peak 1 g and 10 g without robot scanning. Figs. 4 and 5 show the probe array dispositions in the generally used phantom shapes. The probes referred to Section II are submerged in a solution which is a simulant human liquid with the wide bandwidth (0.4–6 GHz) characteristic [11]. And the probes are connected with the electronic circuits and a computer which calculates SAR values by the predetermined software. The Devices Under Tests (DUTs) contact with the plastic phantom surface when they are measured following to the international standards [5-7].

       2. Homeostasis of SAR Values to the Measurement Positions

    Because of the sparse data in the phantom space by the arrayed probes in fast SAR system, it is important to check SAR value variation following to the DUT positions.

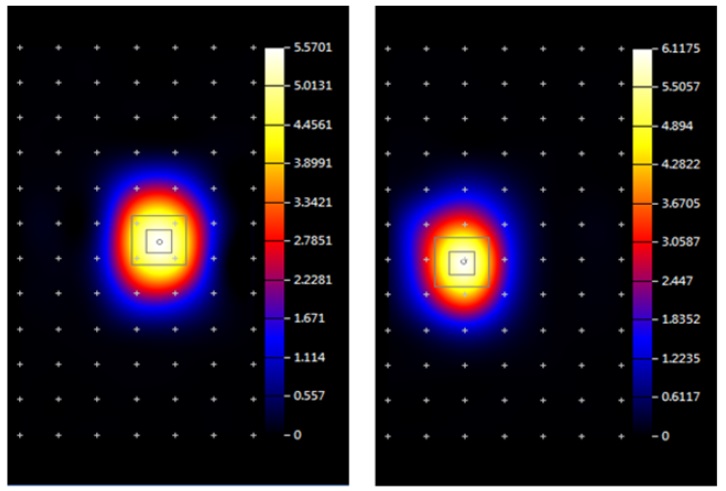
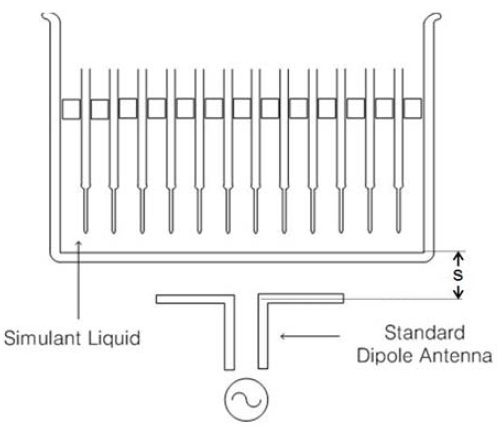
    Test result of SAR values depending on measurement points with 250 mW (24 dBm) RF signal fed by a standard dipole antenna shown in Fig. 6 is summarized in Table 1. All of the test arrangements, geometrical distances and a radiator or phantom structures follow the international standards for system validation [6,7]. Although 1.9 GHz is chosen as the test frequency in this paper, the usability of the fast SAR measurement can be extended to lower 300 MHz and to upper 3 GHz which will include most of the modern mobile devices, with wider band probes and wider band simulant liquid. The field intensity contour pattern and SAR values are satisfactorily maintained regardless of the radiating dipole antenna positions in Fig. 7 to the arbitrary same input powers.

    [Table 1.] Data of the fast specific absorption rate (SAR) measurement system at 1,900 MHz

    label

    Data of the fast specific absorption rate (SAR) measurement system at 1,900 MHz

    SAR values are measured to be in the range of 9.89–9.94 W/kg and 5.12–5.16 W/kg in terms of peak 1 g and 10 g average, respectively. The dominant factor of these measurement variation is due to the position change of the radiating dipole antenna.

       3. Measurement Data Comparison of SAR Values between Robot Scanning SAR and Fast SAR Systems

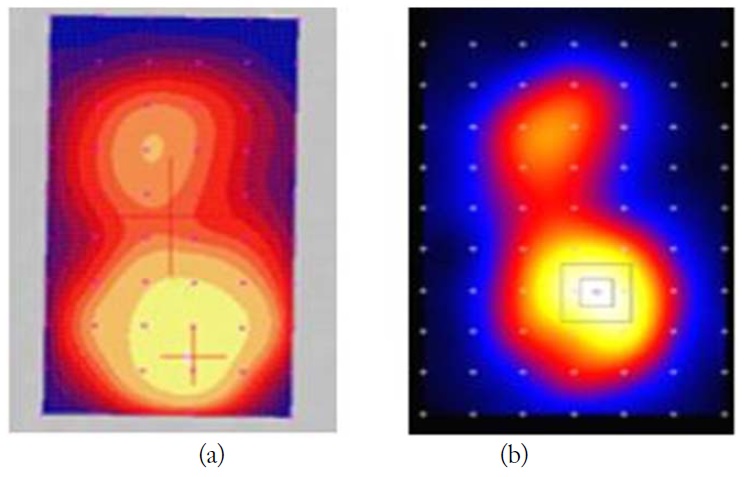
    Fig. 8 shows SAR distribution contour comparison between the robot scanning system and fast SAR system of a WCDMA mobile phone. Both distributions coincide pretty well not only in major peak area but also in less intense area. Measured data by robot scanning system is 0.666 (1 gram) and 0.356 (10 gram) W/kg each, while they are 0.6085 (1 gram) and 0.3811 (10 gram) W/kg each by fast SAR system.

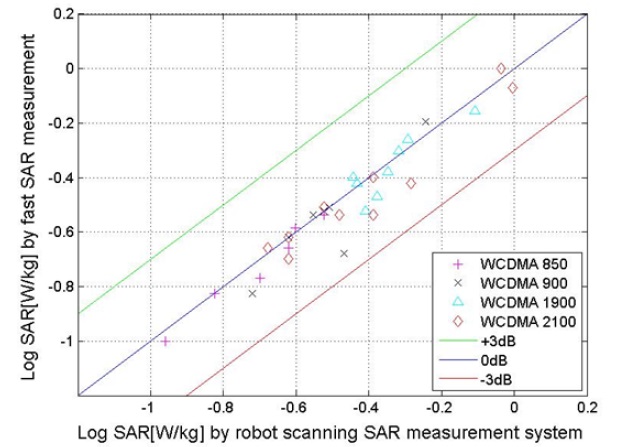
    Fig. 9 shows SAR values comparison by the robot scanning system and by the fast SAR system of WCDMA mobile phones. Each SAR value is under blue line and above gray line which means that the difference of robot scanning SAR value and fast SAR value are within +3 and -3 dB.

       4. Linearity Characteristics of fast SAR Measurement System

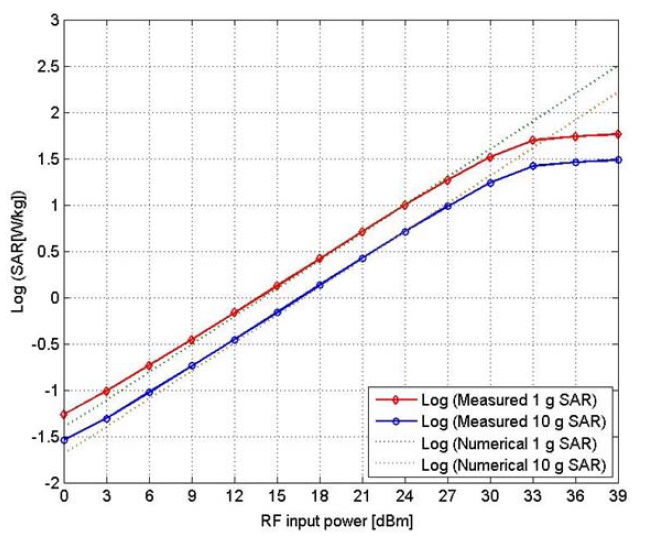
    RF power from 0 dBm (1 mW) to 39 dBm (8 W) by 3 dB step was driven to a dipole antenna for linearity response test of the fast SAR measurement system at 1,900 MHz. Fig. 10 shows lines of measured data of 1 g and 10 g SAR by fast SAR system, and it shows that 1 g and 10 g SAR lines are parallel and straight in 9–27 dBm input range. Nonlinear characteristics are observed out of this linear range. The reasons of nonlinear region by the low or high input power conditions are due to the detection limit of the sensor or of the system.

    Improved linear characteristics at high input power region can be obtained by using thinner diameter probes than 4.8 mm such as 3.0 mm diameter.

    IV. CONCLUSION

    Some important performances of fast SAR measurement system with stationary multiple E-field sensor arrays (7 × 12) were checked at 1,900 MHz. This system produced similar SAR values irrespective of horizontal measurement position of mobile device. Measured SAR values well coincide with the robot scanning SAR value within ±3 dB. And it has a good linearity characteristics if input power is under 1 W. If better linearity is required at higher SAR (>10 W/kg) realm, a thinner diameter probe with lower sensitivity can be used.

    Judging from the results of this study, fast SAR measurement system can be substitutive for the robot scanning system to measure SAR values of WCDMA mobile devices. It needs more tests at other frequencies for reliability evaluation of this fast SAR measurement system with different probe diameters. This fast SAR system is efficiently used for SAR measurements of LTE phones which have about a hundred test modes for a single mobile device. The main purpose of using this fast SAR system for LTE phones is to find out the parameter conditions which give the maximum SAR of the phones.

참고문헌
  • 1. Gimm Y. M., Kwon D. H. 2010 “Fast SAR measurement system structure using E-field sensors array” [in Proceedings of 2010 Asia-Pacif ic Radio Science Conference (APRASC)] google
  • 2. Gimm Y. M., Ju Y., Kahng S., Lee Y., Lee S. 2013 “Quick SAR measurement system by 2D array E-field sensors” [in Proceedings of Asia-Pacif ic Microwave Conference (APMC)] P.383-385 google
  • 3. Gimm Y. M., Lee S. B. 2014 “Analysis of the SAR value by probe array” [in Proceedings of 2014 KIEES Summer General Conference] P.90 google
  • 4. 2009 “ICNIRP statement on the ‘guidelines for limiting exposure to time-varying electric, magnetic, and electromagnetic fields (up to 300 GHz)’” [Health Physics] Vol.97 P.257-258 google cross ref
  • 5. Cleveland R. F., Sylvar D. M., Ulcek J. L. 1997 “Evaluating compliance with FCC guidelines for human exposure to radiofrequency electromagnetic fields” OET Bulletin 65 (Edition 97-01), Standards Development Branch, Allocations and Standards Division, Office of Engineering and Technology google
  • 6. IEEE Recommended Practice for Determining the Peak Spatial-Averaged Specific Absorption Rate (SAR) in the Human Head from Wireless Communication Devices: Measurement Techniques google
  • 7. Human exposure to radio frequency fields from handheld and body-mounted wireless communication devices - Human models, instrumentation, and procedures ? Part 2: Procedure to determine the specific absorption rate (SAR) for mobile wireless communication devices used in close proximity to the human body (frequency range of 30 MHz to 6 GHz) google
  • 8. Faraone A., McCoy D. O., Chou C. K., Balzano Q. 2000 “Characterization of miniaturized E-field probes for SAR measurements” [in Proceedings of IEEE International Symposium on Electromagnetic Compatibility] P.749-754 google
  • 9. Kanda M. Y., Douglas M. G., Mendivil E. D., Ballen M., Gessner A. V., Chou C. K. 2004 “Faster determination of mass-averaged SAR from 2-D area scans” [IEEE Transactions on Microwave Theory and Techniques] Vol.52 P.2013-2020 google cross ref
  • 10. Schmid T., Egger O., Kuster N. 1996 “Automated E-field scanning system for dosimetric assessments” [IEEE Transactions on Microwave Theory and Techniques] Vol.44 P.105-113 google cross ref
  • 11. Loader B., Gregory A., Bownds D., Johnson Y. 2010 “Non-toxic phantoms for SAR measurements (30 MHz to 6 GHz)” [in Proceedings of the 32nd Annual Meeting of the Bioelectromagnetics Society (BEMS)] P.94 google
OAK XML 통계
이미지 / 테이블
  • [ ] 
  • [ ] 
  • [ ] 
  • [ Fig. 1. ]  Typical E-field probe construction of a ‘Δ-beam’ (or ‘triangularbeam’) dielectric structure supports the three miniature and mutually orthogonal sensor dipoles.
    Typical E-field probe construction of a ‘Δ-beam’ (or ‘triangularbeam’) dielectric structure supports the three miniature and mutually orthogonal sensor dipoles.
  • [ Fig. 2. ]  E-field probe features. Sensor offset is measured from the geometric center of the sensors to the tip of the probe enclosure.
    E-field probe features. Sensor offset is measured from the geometric center of the sensors to the tip of the probe enclosure.
  • [ ] 
  • [ ] 
  • [ Fig. 3. ]  Conceptual structure of a phantom shell plane (z = 0), and probe sensor plane (z = zd). Lc is the length of the cube for 1 g or 10 g volume average, where peak volume SAR is to be estimated.
    Conceptual structure of a phantom shell plane (z = 0), and probe sensor plane (z = zd). Lc is the length of the cube for 1 g or 10 g volume average, where peak volume SAR is to be estimated.
  • [ ] 
  • [ ] 
  • [ Fig. 4. ]  Probe array disposition in the right SAM phantom.
    Probe array disposition in the right SAM phantom.
  • [ Fig. 5. ]  Positions of E-field sensors in tissue-simulating medium in the left SAM, right SAM, and flat phantoms.
    Positions of E-field sensors in tissue-simulating medium in the left SAM, right SAM, and flat phantoms.
  • [ Fig. 6. ]  Performance check of fast SAR measurement system.
    Performance check of fast SAR measurement system.
  • [ Table 1. ]  Data of the fast specific absorption rate (SAR) measurement system at 1,900 MHz
    Data of the fast specific absorption rate (SAR) measurement system at 1,900 MHz
  • [ Fig. 7. ]  SAR field intensity contour patterns of a fast SAR measurement system in the flat phantom at 1,900 MHz with the different dipole antenna positions. Left and right figures are the patterns when the center positions of the radiating dipoles are at different positions each other under the flat phantom. Numbers of the color bars are point SAR values in W/kg.
    SAR field intensity contour patterns of a fast SAR measurement system in the flat phantom at 1,900 MHz with the different dipole antenna positions. Left and right figures are the patterns when the center positions of the radiating dipoles are at different positions each other under the flat phantom. Numbers of the color bars are point SAR values in W/kg.
  • [ Fig. 8. ]  SAR distribution contours of a WCDMA mobile phone. (a) SAR contour by robot SAR, (b) SAR contour by fast SAR system.
    SAR distribution contours of a WCDMA mobile phone. (a) SAR contour by robot SAR, (b) SAR contour by fast SAR system.
  • [ Fig. 9. ]  Comparison between logarithmic fast SAR values and robot scanning SAR values of WCDMA phones with the left SAM phantom.
    Comparison between logarithmic fast SAR values and robot scanning SAR values of WCDMA phones with the left SAM phantom.
  • [ Fig. 10. ]  Logarithmic fast SAR values to the increasing RF input power from 0 dBm to 39 dBm at 1,900 MHz to check the linearity of the fast SAR system.
    Logarithmic fast SAR values to the increasing RF input power from 0 dBm to 39 dBm at 1,900 MHz to check the linearity of the fast SAR system.
(우)06579 서울시 서초구 반포대로 201(반포동)
Tel. 02-537-6389 | Fax. 02-590-0571 | 문의 : oak2014@korea.kr
Copyright(c) National Library of Korea. All rights reserved.