It is well known that rice-fields can provide excellent foraging places for birds including seasonal migrants, wintering, and breeding and hence the high biodiversity of rice-fields may be expected. However, how environmental change including climate-changes on life-history and population dynamics in birds on rice-fields has not been fully understood. In order to investigate how climate-change affects population migratory patterns and migration timing, I modeled a population dynamics of birds in rice-fields over a whole year.
I applied the Lotka-Volterra equation to model the population dynamics of birds that have been foraging/visiting rice-fields in Korea. The simple model involves the number of interspecific individuals and temperature, and the model parameters are periodic in time as the biological activities related to the migration, wintering and reproduction are seasonal. As results, firstly there was a positive relationship between the variation of seasonal population sizes and temperature change. Secondly, the reduced lengths of season were negatively related to the population size. Overall, the effects of the difference of lengths of season on seasonal population dynamics were higher than the effects of seasonal temperature change.
Climate change can alter population dynamics of birds in rice-fields and hence the variation may affect the fitness, such as reproduction, survival and migration. The unstable balances of population dynamics in birds using paddy rice field as affected by climate change can reduce the population growth and species diversity in rice fields. The results suggest that the agricultural production is partly affected by the unstable balance of population in birds using rice-fields.
논습지는 사람에게 식량을 제공할 뿐만 아니라, 조류에게도 최적의 취식장소이다(Stafford
조류의 생활사는 기후변화와 같은 환경변화에 의해 직, 간접적인 영향을 받는다(Lack 1968). 번식수행이나 서식지 이동과 같은 조류의 생활사는 서식지의 기후나 환경조건으로 최대의 적합도(예, 번식성공 또는 이동성공)를 이끌어내기 위한 최적의 생활사 선택에 의해 결정된다(Lack 1968; Roff 2002). 따라서 기후변화와 같은 예측불가능한 환경변화는 경험과 유전정보에 의한 최적선택의 결과인 적합도를 감소시키는 결과를 초래하였다(Møller
계절의 평균기온이나 계절의 길이 변화 또는 온도구배(temperature gradient)와 같이 다양한 기후변화의 형태는 조류의 생활사 뿐만 아니라 논습지에서 생장하는 작물에게도 영향을 줄 수 있다(Horie
본 연구에서는 기후변화가 논습지를 이용하는 조류개체군 동태에 영향을 주는지 여부를 분석하기 위해 수학적 모델을 이용하여 예측 및 분석하였다. 첫번째로, Lotka-Volterra 방정식을 응용하여 기온과 관련된 조류 개체군의 도래 경향을 수학적 모델로 나타내었다. 두번째로, 이 모델을 이용하여 기후변화가 논습지를 이용하는 조류 개체군의 크기와 분포에 어떠한 영향을 주는지를 예측하였다. 특히, 본 연구에서는 계절에 따른 기온과 계절 길이의 변화와 관련된 10가지 기후시나리오를 이용하여 각각의 시나리오에 따른 조류 개체군 동태의 변화를 분석하였다. 세번째로, 예측된 논습지를 이용하는 조류 개체군 동태 자료를 통해, 논생태계에서 조류의 보전 전략을 수립하는데에 기후변화의 영향을 어떻게 고려해야하는지를 고찰하였다. 또한 논습지에서의 조류의 종 다양성과 개체군 증가와 관련된 기후변화의 영향에 대해 고찰하였다.
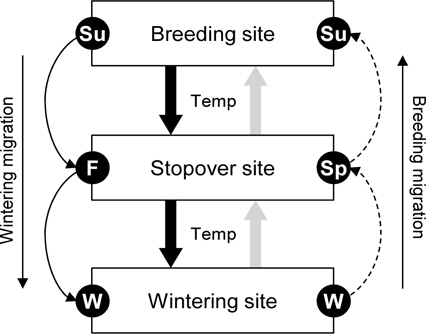
본 연구에서는 계절에 따라 달라지는 논습지 이용 조류 개체군의 동태를 Lotka-Volterra 방정식을 응용하여 분석하였으며, 특히 기후변화(기온 변화, 계절의 길이의 변화)에 따른 논습지에서의 조류 개체군 동태의 변화를 예측하였다. Lotka-Volterra 방정식은 포식자-피식자간의 관계를 초기조건과 되먹임 현상(feedback, 먹고 먹히는 관계가 반복됨)을 이용하여 설명하는 생태수리적 모델이다(Murray 2003). 생태계에서 포식자와 피식자는 일반적으로 주기적인 파동을 연속적으로 보여주며, 특히 포식자와 피식자의 증가하고 감소하는 시기가 상호 교대로 반복된다(Huffaker 1958; Begon
한반도에 도래하는 조류, 특히 논습지를 이용하는 조류는 계절별로 겨울철의 월동 조류, 봄과 가을철의 이동 조류 그리고 여름철의 번식조류로 구분할 수 있다(Kim
일반적으로 계절별로 교대하는 조류 개체군은 계절의 초반에는 적은 개체수가 도래하지만, 이후 빠르게 증가하여 계절의 중간시점 (예를 들어, 여름 - 최고기온)에 개체수가 최대로 된 뒤, 다시 계절의 후반으로 갈수록 개체수가 빠르게 감소한다. 조류의 이동시기는 기온와 바람과 같은 환경적인 변화에 민감하게 반응하기 때문에(Richardson 1978), 평년보다 기온이 높았는지 또는 낮았는지, 그리고 계절의 기간이 길었는지 또는 짧았는지의 차이는 조류 개체수의 증감 속도에 영향을 줄 수 있다(Lemoine and Böhning-Gaese 2003; Jonzén
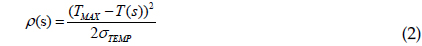
이러한 가정하에서, 시간

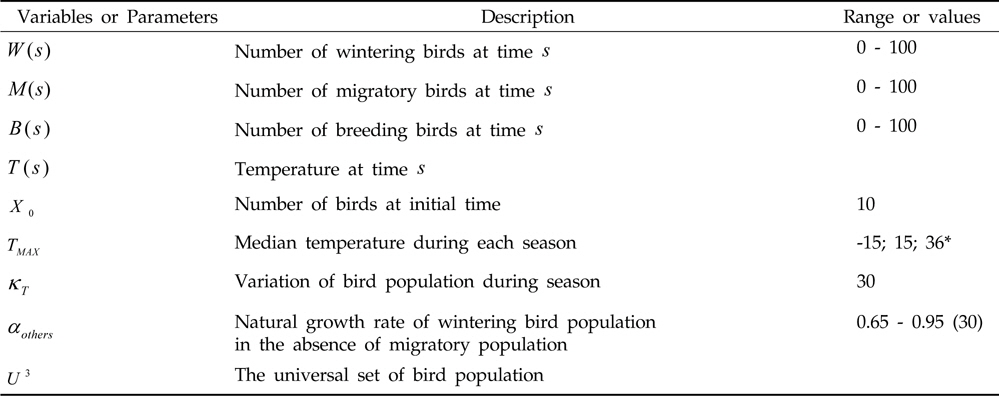
Summary of variable and parameter definitions and the range of values used in simulations. Number in parentheses means the number of categories. Note that the asterisk indicates mean temperatures of wintering, migratory and breeding populations, respectively

여기서,

본 연구에서는 기온변화가 논습지를 이용하는 조류 개체군의 크기변화에 어떠한 영향을 주는지에 대하 알아보는 것이 목적이기 때문에, 지역적 환경변이와 환경특이성은 고려하지 않았다. 따라서, 1961년부터 2010년까지 한반도 전체의 기온자료(Korea Meteorological Administration DB, http://www.kma.go.kr)를 이용하여 모델에 사용할 계절별 최대기온과 기온변이를 선택하였다: 겨울철 월동 조류는
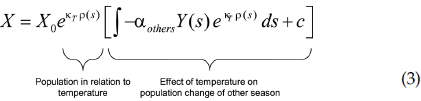
미분방정식 (1)을 1계선형 미분방정식의 일반해를 이용하여 풀면 다음과 같다.

여기서


본 모델에서는 계절별 논습지를 이용하는 조류 개체군의 크기는 항상 0보다 크거나 같기 때문에, 전지구적 조류 개체군을
전지구적으로 화석연료와 같은 온실가스(이산화탄소, 메탄, 아산화질소 등)의 증가는 기온과 강수량 증감의 경향을 변화시켜 이상현상을 증가시켰다. 현재 유엔 산하 정부간기후변화협의체(IPCC)와 세계기후연구프로그램(WCRP)에서 전 지구 기후변화 시나리오를 개발하고 있으며, 개발된 시나리오를 통해 전지구적인 생물다양성에 대한 연구가 수행되고 있다(Mearns
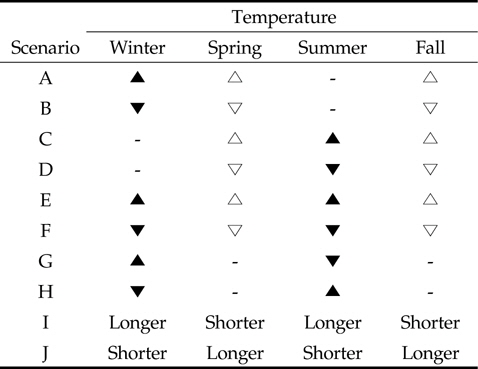
Scenarios of seasonal temperature changes (climate-changes) in relation to dynamics of bird population on rice field. Symbols represent the variation in temperature over the specific season: black triangle, higher than control season; white triangle, a little higher; black inverted triangle, lower than control season; white inverted triangle; ′Longer′, extending period; ′Shorter′, reducing period
첫번째로 단일 계절의 변화는 겨울철 기온이 평균기온보다 높을 경우(시나리오 A)와 평균기온보다 낮을 경우(시나리오 B) 그리고 여름철 기온이 평균기온보다 높을 경우(시나리오 C)와 평균기온보다 낮을 경우(시나리오 D)이다. 여기서 봄과 가을의 단일 기온 변화는 시나리오 E와 F의 상황과 유사하므로 독립된 시나리오로 포함시키지 않았다. 두번째로 두 계절의 변화는 겨울철과 여름철 기온이 모두 평균기온보다 높을 경우(시나리오 E)와 평균기온보다 낮을 경우(시나리오 F)이다. 또한 겨울철 기온은 평균기온보다 높고 여름철 기온은 평균보다 낮을 경우(시나리오 G)와 겨울철 기온이 평균보다 낮고 여름철 기온이 평균보다 높을 경우(시나리오 H)로 구분된다. 참고로 비록 다른 환경의 영향이 존재하지만, 시나리오 G는 여름저온 겨울고온 현상의 엘니뇨의 상황을 설명할 수 있다. 다른 환경의 영향이 존재하지만, 끝으로 계절의 극단적 변화는 계절에 따른 평균 기온에는 변화가 없는 대신에, 겨울과 여름이 길어지고(5개월 이상) 봄과 가을이 짧아지는 경우(시나리오 I)와 겨울과 여름이 짧아지고(1개월 미만) 봄과 가을이 길어지는 경우(시나리오 J)이다. 본 연구에서는 계절별 월을 봄(3월-5월), 여름(6월-8월), 가을(9월-11월) 그리고 겨울(12월-2월)로 고려하였다.
수학적 모델을 통한 시뮬레이션에서는 일반적으로 관찰 및 실험적 자료에 기초한 모수와 계수의 값을 이용하는데, 본 연구에서는 가상실험접근법(virtual experiment)을 응용하였다. 가상실험접근법은 모델을 기술하는데 사용한 모든 모수와 계수값의 전범위를 모델에 포함시키고, 몬테카를로 방법을 이용하여 임의로 값을 추출하여 결과를 예측하는 방법이다(Lee 2012a;2013). 본 모델에서는 10가지 시나리오에 따른 기온변화와 계절에 따른 조류 개체군 변동모델에서의 계수를 결정하는데 이 방법을 이용하였다. 기상청 자료(1961년부터 2010년)에 기초한 겨울, 봄 그리고 여름의 평균기온(각각 -15℃, 15℃, 36℃)가 주어졌을 때를 대조군으로 정의하였다. 본 연구에 사용한 일별기온

여기서,
본 모델에서는 조류의 이동과 논습지를 이용하는 조류의 증감은 다른 환경의 영향도 존재하지만, 조류의 이동시기의 결정과 취식행동에 영향을 주는 기온 변화가 큰 영향을 준다고 가정하였다(Richardson 1978). 또한 논습지에서의 먹이량은 항상 풍족하며 취식에 따른 종내 경쟁의 영향은 고려하지 않았다.
기후변화 시나리오에 따라 논습지를 이용하는 계절별 조류 개체군의 크기는 0에서 1의 범위로 변환하였다. 변환된 값이 0이면 논습지를 이용한 개체수가 없다는 것을 의미하며, 1이면 논습지를 이용하는 개체수가 포화상태임을 의미한다. 뿐만아니라, 대조군의 환경상태에서는 변환된 값이 0이면 계절의 초기와 끝을 그리고 1이면 계절의 절정시기(예, 여름철 - 기온이 가장 높을 때, 겨울철 - 기온이 가장 낮을 때)를 간접적으로 의미할 수 있다. 예를 들어, 여름 번식조류는 초여름에 번식지에 도착하고 가을이 되기전에 월동지로 다시 이동을 한다. 따라서 계절의 초기와 끝에는 개체수가 0에 가까울 것이고 중간시기(=절정시기)에는 1에 가까울 것이다. 대조군과 각각의 기후변화 시나리오에서의 계절별로 기온과 논습지를 이용하는 조류 개체군과의 관계를 분석하였다. 본 모델의 시뮬레이션과 결과의 분석은 Matlab 2012b(Matheworks 2012)를 이용하였다.