The marine industry’s unrelenting passion to enhance the performance of commercial and military vessels has led to incorporating an increasing amount of Fiber Reinforced Plastic (FRP) composite materials into the structures. Fiber Reinforced Plastic (FRP) composite materials possess the superior performance in strength-to-weight and stiffness-to-weight ratios, corrosion resistance and excellent thermal and sound insulation. In addition, marine industries take advantage of using FRP materials in construction of naval ships, recreational yachts and offshore structures due to their superior hydrodynamic shapes, flatness for signature requirements, and fatigue strength (Mouritz, et al., 2001; Cao and Grenestedt, 2004). Yang et al. (2005) has carried out hull form development of FRP boats with a moldless production method. Recently, Jeong and Nho (2011) have investigated the structural assessment of FRP stiffened plated marine structures under a lateral pressure load to identify an appropriate combination of material and section configuration. Among many types of FRP composites, GFRP composites are the most common for marine structures mainly due to their performance advantages based on cost.
Typical techniques of fabricating GFRP structure include wet hand lay-up, vacuum infusion, filament winding and resin transfer molding (Sharma and Wetzel, 2010). Wet Hand Lay-up (HL), which is a low-investment process, competes favorably with Vacuum Infusion (VI) or resin transfer molding processes, which require high tooling expenses. However, VI technology, which uses vacuum pressure to force resin into a composite laminate, gets more attention due to its capability of large GFRP ship structures with excellent mechanical properties (Kim et al., 2004).
Fabrication cost is a primary concern for larger ship structures while maintaining the demanding design specifications. It is also well known that mechanical properties and performances of the composite structures are highly influenced by composite manufacturing processes (Kim et al., 2010; Ramulu et al., 2004). Recently, the authors introduced the hybrid GFRP composites, which formed by applying the HL technique to construct the exterior layup against the mold, followed by a VI process on the interior once the HL processed layers are cured (Kim et al., 2010). This form of hybrid composites is advantageous for both composite structural performance and ease of manufacturing. The HL processed GFRP, located in the outer hull exterior skins, possesses a good resistance to wave impact or local shock loads while the VI processed GFRP, located in the interior skin, provides high strength and stiffness due to its high fiber fraction volume (Belingardi et al., 2008; Kim et al., 2010). The hybrid GFRP composites produced higher ultimate strength and stiffness values compared to HL processed composites (Kim et al., 2010). Application of the hybrid GFRP composites is also beneficial in terms of a large vessel’s manufacturability. The outer exterior skins of a GFRP vessel requires detailed work particularly in the corners and gaps between the molds. The HL process is suitable as an initial layup because it prevents any defects such as resin leakage at the mold gap or large void formation at the mold/vacuum bag interface. Conducting the HL process ahead of the VI process has a potential for significant cost savings due to reduced tool setup time and rework.
Another concern associated with large composite marine vessel production is quality control. Unlike a structure fabricated from metal plating, a composite hull achieves its form entirely at the time of fabrication. Often, large GFRP composite vessels exhibit a larger dispersion in their material properties due to many parameters associated with material selection and fabrication. Some of these parameters may be enumerated as: lay-up sequence, fiber orientation, individual lamina thickness, inter-laminar material, fiber volume fraction, void or porosity content, level of laminate consolidation, degree of cure. The effectiveness of quality control during fabrication of a GFRP vessel depends on the strictness of the control and the number and types of parameters required to be controlled. Complete quality control may not be practical for composite fabrication for economic reasons. The lack of complete control is reflected as random variation in the vessel component characteristics, like geometrical and material properties (Lal et al., 2007).
This paper aims to investigate the mechanical properties and failure mechanisms of the GFRP composite materials includeing the HL processed layer, the VI processed layer, and the hybrid GFRP composites. The hybrid GFRP composite samples consist of the HL processed layer sets with one, two, and three VI processed layer sets. All the GFRP samples are acquired from three different production batches. In order to understand the performance of the composites for each batch, mechanical property tests are conducted, including: tensile, compressive, in-plane shear and ignition loss sample analysis. One-way analysis of variance (ANOVA) with using the mechanical property data is conducted to verify batch homogeneity of GFRP composite samples acquired from various batches. In addition, the effect of the VI sets on the mechanical properties and failure characteristics of hybrid composite samples is discussed.
>
Material systems and their fabrication
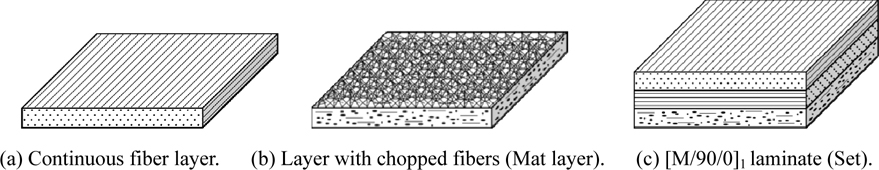
All the material systems consist of [M/90/0] lamina which is considered a “set”. It is shipped and loosely stitched in this fashion which makes the material easier to handle and less time consuming to layup by the fiber manufacturers. A [M/90/0] lamina set is a combination of: one layer chopped strand mat, one layer 90 degree unidirectional fibers and one layer 0 degree unidirectional fibers. Fig. 1 shows schematics of a set of the [M/90/0] lamina. All GFRP composite materials were provided by the Christensen Shipyards, LLC., (Vancouver, WA, USA) and were fabricated from three different marine vessel production batches over a two year span. The conventional HL process was used to consolidate the HL samples. Glass fibers were placed manually inside of a mold then matrix material was spread evenly over the fiber layers. Entrapped air was then removed with squeegees and rollers. For the VI process, glass fibers were placed into, or on top of, a mold and covered with a thick plastic bag material. Vacuum was then applied in order to spread the resin throughout the fiber evenly and help evacuate air bubbles to reduce voids and material discontinuities. Hardening of the fiber/matrix system for all samples was accomplished at ambient temperature.
Table 1 gives a detailed description of the HL and VI processed GFRP composite materials investigated over the course of this experiment. The table is composed of 8 columns which help to define each of the composite laminates in an easy to understand format. The second column introduces the sample name. The orientation column fully describes the laminate layup sequence which, for the majority, consists of a chopped strand mat, 90 degree, 0 degree fibers with variance mainly in the number of ply sets used. While E-glass materials from Vectorply E-LTM 3610 was utilized for the VI processed laminates, E-glass materials from Owens Corning CDM 2408 was utilized for HL processed laminates. Two matrix materials were utilized during fabrication, due to cure cycle time needed for the fabrication procedure: Derakane Momentum 411-200 Epoxy Vinyl Ester for the VI processed laminates and Reichhold Hydrex 100 Epoxy Vinyl Ester for the HL processed laminates. The seventh column shows the total thickness of the composite samples after fabrication. Ignition loss tests were performed in accordance with ASTM D2584 (2002) and the fiber weight fraction of each sample is presented on the last column. In this study, GFRP composites were taken from three different batches, namely batches 1, 2 and 3. As shown in Table 1, thickness values for the same sample are different among batches, even though consistent material and fabrication parameters were used.
[Table 1] HL and VI Material systems.
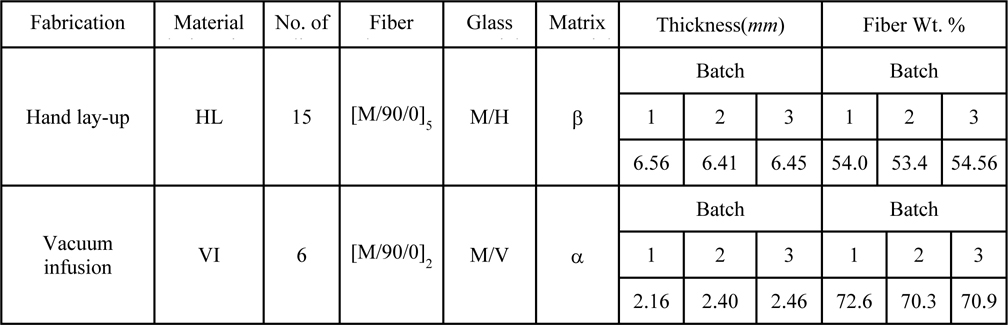
HL and VI Material systems.
>
Hybrid GFRP material design and fabrication
The newly introduced hybrid (HYB) composites were chosen for the vessel structures where a combined HL and VI technique was used. In order to gain better impact or shock resistance of the outer vessel structure, two [M/90/0] sets along with two chopped mat layers were fabricated using HL technique. Then, the VI process was used to add additional [M/90/0] sets into the existing HL processed portion.
Table 2 gives a detailed description of the three HYB composite samples investigated over the course of this experiment. HYB-1 composite sample with one set of VI processed layers was fabricated in all three batches. HYB-2 with two VI layer sets were produced in all three batches, while HYB-3 with three VI layer sets was fabricated only in batch 3. Average thickness of the HYB samples increased with adding the number of the VI sets.
[Table 2] HYB composite material systems.
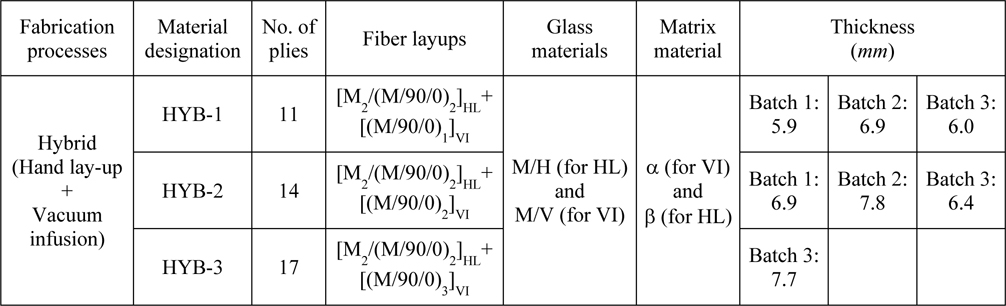
HYB composite material systems.
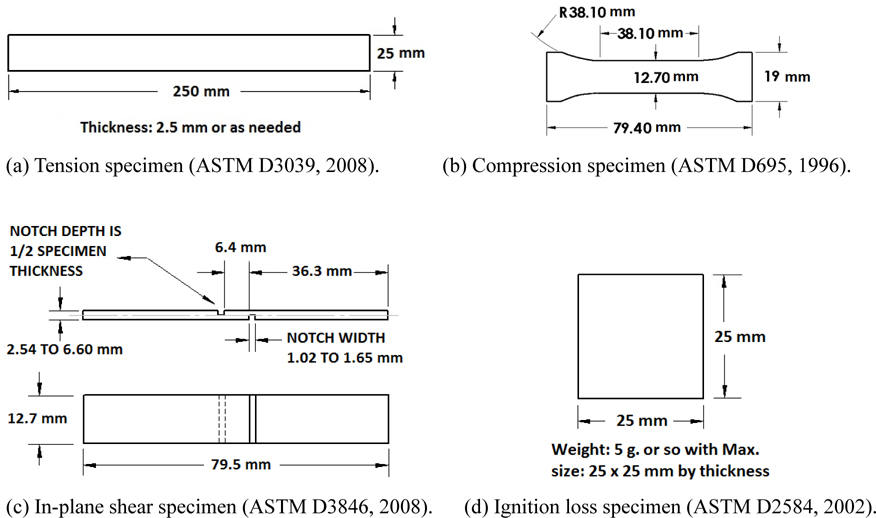
Five GFRP composite material types (HL, VI, HYB-1, HYB-2, and HYB-3) introduced in Tables 1 and 2 were tested to assess tensile, compressive, and in-plane shear properties. Five specimens for each GFRP composite sheet had been prepared from one batch and tested for each type of test. Schematics of the test specimens used for these tests are shown in Fig. 2. A universal mechanical tester (Model 4482, Instron, USA) was used for all tests.
Tensile properties such as tensile modulus, tensile strength, and strain at failure of composite laminates were determined in accordance with ASTM D3039 (2008). An extensometer (Instron 2630-100 series clip on type) was used for the displacement measurement with a constant cross head speed of 2
Properties in compression were determined by static compression tests in accordance with ASTM D695 (1996). Loading of the specimen was applied as a constant displacement control of 1.3
In-plane shear strength was determined by applying a compressive load to a notched specimen of uniform width in accordance with ASTM D3846 (2008). Test specimens were loaded at a crosshead speed of 1.3
In addition to the mechanical property testing, the ignition loss of cured reinforced resin tests (ASTM D2584, 2002) were conducted to investigate fiber weight percent (wt%) of each sample.
In order to comply with the ASTM standards, 5 specimens were tested for each sample in each batch. Total of 380 specimens were tested for five different types of GFRP composite materials manufactured by three batches.
>
Mechanical properties of the hand lay-up and the vacuum infusion processed samples
Table 3 shows the ASTM D2584 (2002) ignition loss test results of the HL and VI samples from three batches. Average fiber weight percent (wt%) values of the HL specimens range 53.4 to 54.6, while those of the VI samples range 70.3 to 72.6. The VI process reduced the void contents and the amount of resin needed to fully saturate the fiber by applying vacuum during the process. As vacuum increases the fiber is also compacted neatly, which aids in load distribution and offers a thinner cross section with a higher amount of strength per unit volume.
[Table 3] The fiber weight percent(wt%) of the HL and VI samples.

The fiber weight percent(wt%) of the HL and VI samples.
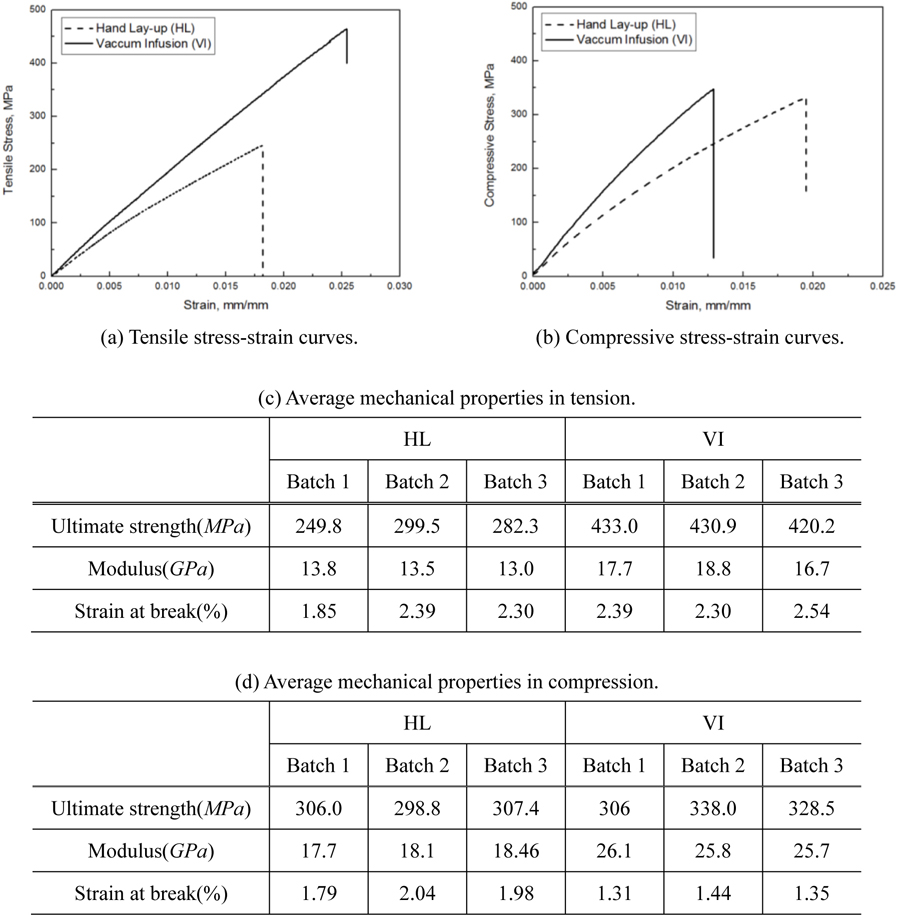
Quasi-static tests in tension and compression were performed on both HL and VI samples and typical stress-strain curves for each sample are shown in Fig. 3. Ultimate strengths, moduli and percent strain at break values were averaged across the 5 specimens from each sample type and are found in Fig. 3. The onset of non-linearity can be determined from Fig. 3. The strain at non-linearity, which can be defined as 1% difference with linear curves, for the VI sample is 0.0050 which is very close to that (0.0048) for the HL sample. This confirms that the properties of the matrix materials for the HL and VI samples are very close to each other. The VI sample shows larger Ultimate Tensile Strength (UTS) and stiffness than the HL sample and this is mainly due to the fiber weight fraction. The VI sample possesses approximately 17% more fibers than the HL sample by weight. In addition, air voids were observed in the HL coupons, which remained from the fabrication process. These voids lead to early failure of the voided regions, and eventually to overall failure of the composite at lower levels than to be expected (Thomason, 1995; Costa et al., 2001).
The VI sample has better Ultimate Compressive Strength (UCS) and compressive modulus while the HL shows larger percent strain at break. However, discrepancy between HL and VI samples in UCS is only 16
The HL sample from batch 2 shows larger UTS than that from batch 1 due to the increased percent strain at break of the sample from batch 2. The HL samples from two different batches show good agreement in compressive properties. The VI samples from batches 1 and 2 show similar tensile properties, while the VI sample of batch 2 has larger UCS due to the fiber weight percent discrepancy as shown in Table 1.
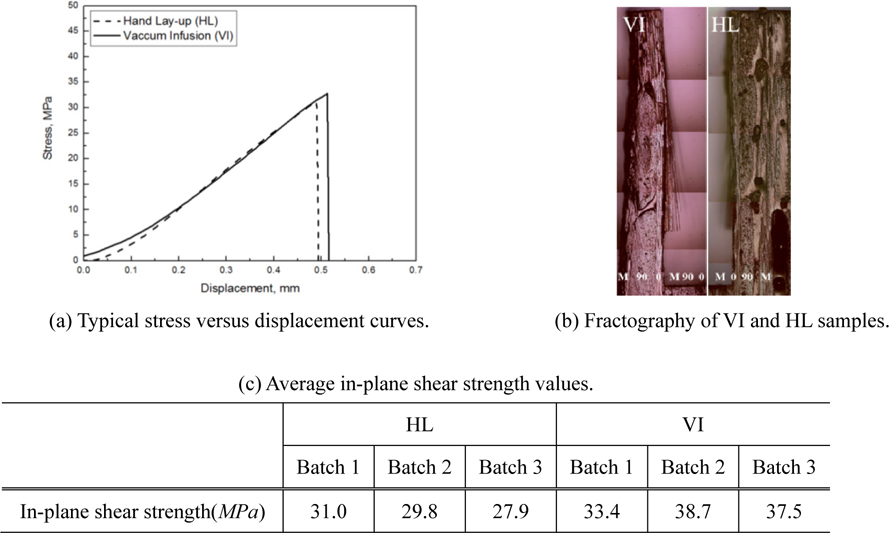
Fig. 4 shows the results of the in-plane shear tests. As shown in Fig. 4(a), typical in-plane shear stress versus displacement curves for the HL and VI specimens are almost identical. The reason for this similarity is that the in-plane properties are mostly dependent on the fiber-matrix bond properties. Since the fiber-matrix bond strength is not greatly affected by manufacturing technique there is little difference in strength between HL and VI specimens. As Table 1 shows, the matrix materials for HL and VI processes are very close in material properties. As shown in Fig. 4(b), the fractography of the failed specimens is also near identical. This shows that both specimens failed by the similar failure mode, that is shearing of the matrix material between fibers. This failure occurred along the longitudinal axis of the specimen within the 0 degree ply. The resulting strengths were 30.5
>
Batch homogeneity test for the hand lay-up and the vacuum infusion processed samples
Using ANOVA methods, statistical comparisons of the mean properties at each group are performed for the HL and VI samples. The null hypothesis is that all the groups have the same mean, and the alternate hypothesis is that at least one of the means is different from the others. In this paper, the group refers to the marine vessel production batch of the HL sample or the VI sample. 5 specimens from three different batches for each material type, namely HL and VI, were tested (N = 15 in this case for each type). The one-way ANOVA tables were computed, and Table 4 provides the Sum of Squares (SS), the degrees of freedom (df), the Mean Squares (MS), the ratio of MS among-groups to MS within-groups (Fs) and the P-value (p). With the given (2, 12) degrees of freedom, the critical value of Fs is 3.89. When the obtained Fs is larger than 3.89, it can be concluded that the values from the batches are likely to be different by chance at the p = 0.05 level of significance. As shown in Table 4 (a), Fs of ultimate tensile strength for the HL samples is 22.894 which is larger than the critical value of Fs. It means three batches of the HL sample do not have the same mean of ultimate tensile strength. Due to the nature of the HL process, mixture of vacancies and matrix-rich spots were observed in the HL specimens (Kim et al., 2010). The initial failure occurred through matrix cracking, resulting in premature failures and large variation of the failure strength values among the batches. When it comes to the VI sample, Fs of ultimate tensile strength has a lower value (Fs = 0.555) than the critical value of Fs. It means that the ultimate strength values seem to be consistent among the batches. The VI specimens had far fewer vacancies and the dominant failure here is fiber extraction. Batch homogeneity of the VI sample seems to be better than that of the HL sample. In all cases, except the ultimate tensile strength of the HL sample, the among-group variance was lower than the within-group variance; the latter value indicated the repeatability of the properties of specimens fabricated by the same manufacturing batch. It means that the mechanical properties of the HL or VI processed GFRP sheets don’t seem to be varied by the vessel manufacturing batches.
[Table 4] one-way ANOVA tables for the mechanical properties of the HL and VI samples.
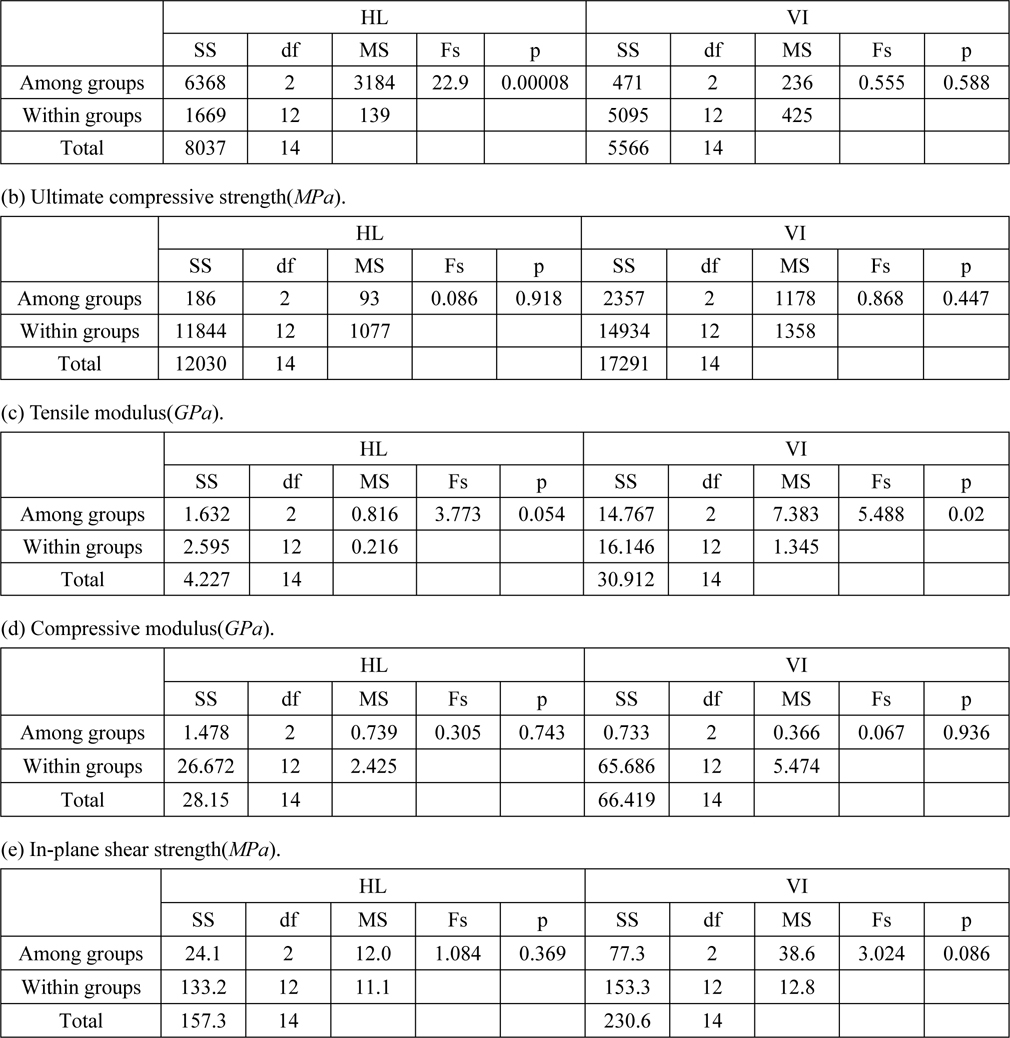
one-way ANOVA tables for the mechanical properties of the HL and VI samples.
>
Effect of the vi sets on the mechanical properties for the hybrid samples
Table 5 shows the ASTM D2584 ignition loss test results of the HYB samples from three different batches. Average fiber weight percent(wt%) values of the HYB-1 specimens range 53.0 to 56.2, while those of the HYB-2 samples range 54.3 to 58.3. Fiber wt% increases with the addition of the VI sets.
[Table 5] The fiber weight percent(wt%) of the HYB samples
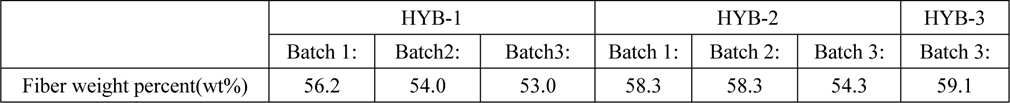
The fiber weight percent(wt%) of the HYB samples
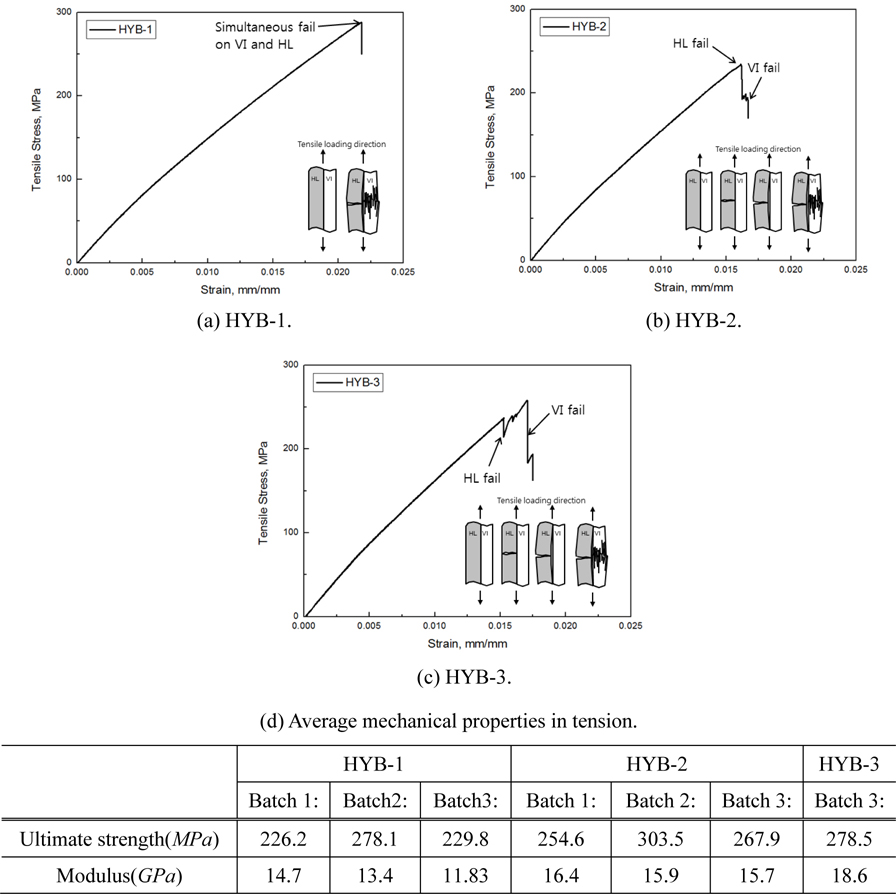
Fig. 5 shows the results of tension and compression tests for hybrid composite samples (HYB-1, HYB-2, and HYB-3). Simultaneous failure on both HL and VI processed portions was observed on HYB-1, as shown in Fig. 5(a). It was unrecognizable which portion had failed first. In Fig. 5(b), the typical tensile curve of HYB-2 hits its first peak due to HL side failure. This abrupt failure of HL side causes a drop in the amount of load being carried by the composite while strain remains the same. The curve steadily rises again because the VI portion of the sample is still intact and continues to carry load. Finally the VI portion of the sample reaches the second peak followed by the ultimate failure of the material. The second peak is smaller than the first peak; therefore, the first peak by HL side failure determines the UTS of HYB-2. This is why tensile properties of HYB-2 from Batch 3 are higher than those from Batch 1. As shown in Fig. 3(c), average UTS of HL sample from Batch 3 is approximately 13% higher than that from Batch 1 while Batch 3 has lower tensile properties on VI samples. When compared between HYB-1 and HYB-2, the addition of VI sets on HYB-2 was not beneficial on tensile strength. Similar to HYB-2, the typical tensile curve of HYB-3 has multiple peaks due to separate failures of both HL and VI sides. However, the second peak due to VI side failure is higher than the first peak with HL side failure. It means the stress where the VI side failed determines the UTS of HYB-3. This is mainly due to the large volume of the VI section on the HYB-3 sample.
Tension elastic moduli are listed in Fig. 5 on average of five coupon tests. The tensile modulus increases with increasing number of VI sets on the HYB samples. It means the tensile modulus is proportional to the fiber weight fraction of the HYB samples.
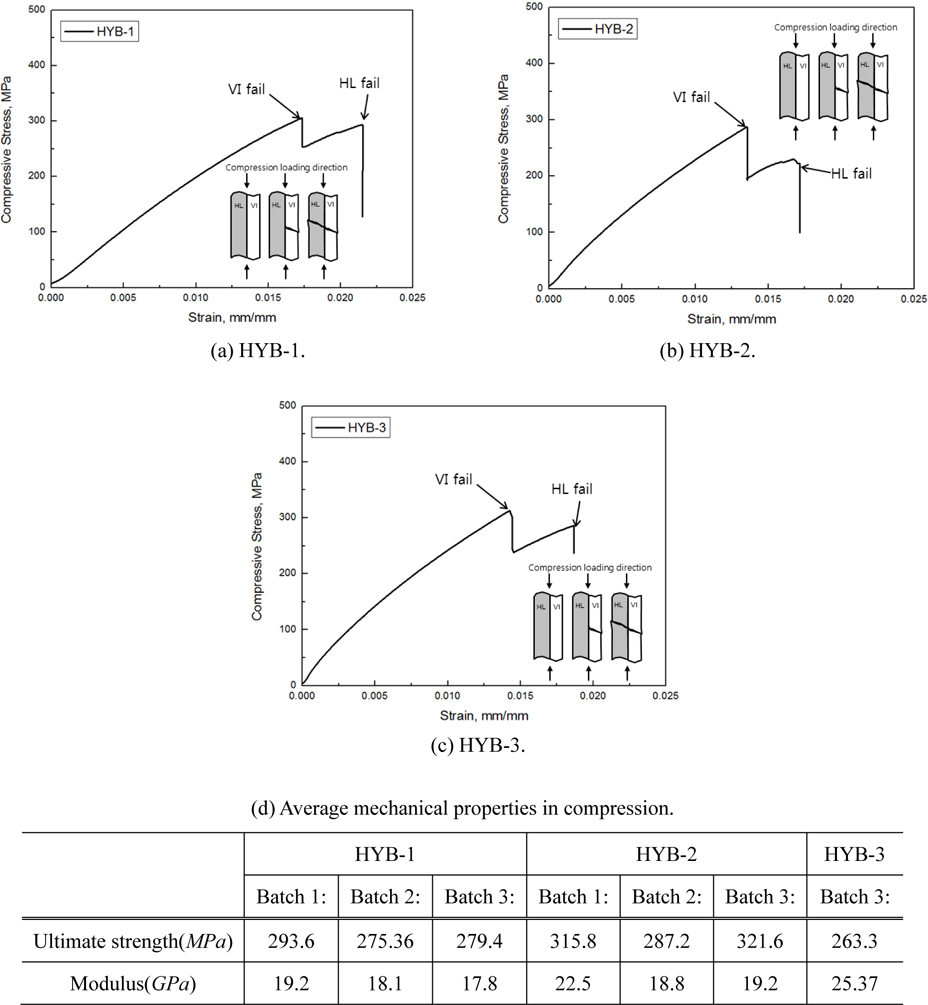
From the results of compression tests in Fig. 6, the curves steadily rise as both the HL and VI sides hold loading until the first peak. The curve reaches its maximum stress state at the first peak where the VI portion of the composite fails abruptly due to its lower compressive strain at failure, as shown in Fig. 3. Even though the VI portion is failed, the HL portion still remains intact and continues to carry compressive load. The curve steadily rises again until the ultimate failure in the HL portion. Ultimate failure in compression usually occurs once the VI side of the sample finally ruptures in the gage section. Therefore, the first peak by VI side failure determines the UCS of all HYB samples. This suitably explains the batch discrepancy of HYB-2 samples. Because UCS of HL from Batch 3 is higher than that from Batch 1, HYB-2 sample from Batch 3 produces higher UCS over that from Batch 1. The dominant failure mode in compression was gage section rupture caused by fiber kinking at the center of the sample where forces were concentrated.
Similar to tensile elastic moduli, compressive modulus also increases with increasing number of VI sets on the HYB sample. Both tensile and compressive moduli are proportional to the fiber weight fraction of the HYB samples.
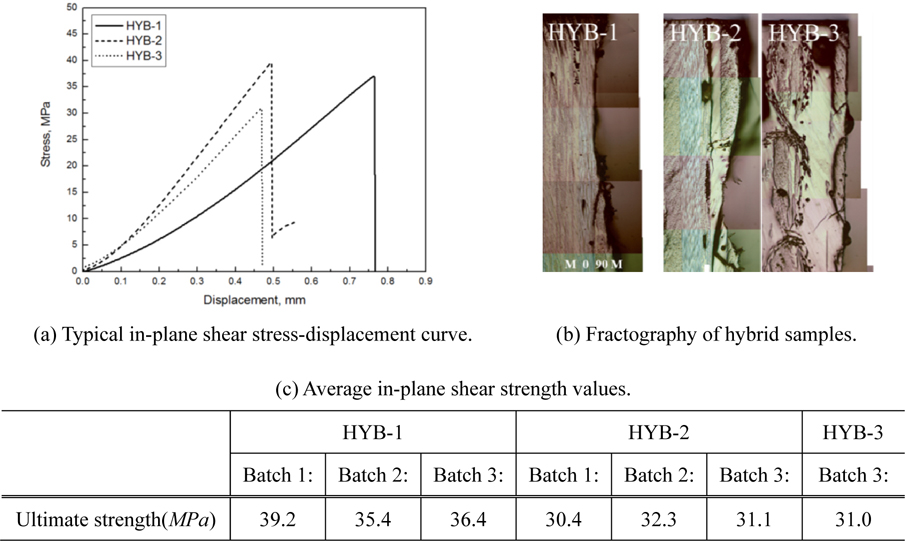
Fig. 7 presents the results of the in-plane shear test for hybrid composites. The resulting curves show that the HYB-3 sample has the in-plane shear strength of 30.4
>
Batch homogeneity test for the hybrid samples
One-way analysis of variance (ANOVA) methods are used to investigate batch homogeneity among the batches for the HYB samples (HYB-1 and HYB-2). The critical value of Fs is 3.89 with the given (2, 12) degrees of freedom is applied to batch homogeneity test. The obtained Fs values of most mechanical properties are higher than 3.89. It means each batch could not produce the GFRP sheets with the consistent mechanical properties. In addition, the obtained Fs values from the HYB samples are higher than those from the HL and/or VI samples. It means the quality control of the HYB composite fabrication is more difficult than that of the HL or VI composite fabrication process. The product variation is depended on variations of different production stages. Composite fabrication of the HYB composites is a combination of the HL process and the VI process, therefore the batch homogeneity tends to go down.
When the batch homogeneity is compared between the HYB-1 and the HYB-2 samples, it is assumed that the HYB samples containing larger amount of the well-controlled VI portion can show higher quality. As shown in Table 3, the HYB-2 samples have additional one set of the VI layers when compared with the HYB-1 samples. However, the HYB-2 samples show higher Fs values over the HYB-1 samples for the compressive properties. It is inconclusive if the additional VI layers can contribute the batch homogeneity.
[Table 6] one-way ANOVA tables for the mechanical properties of the HYB samples.
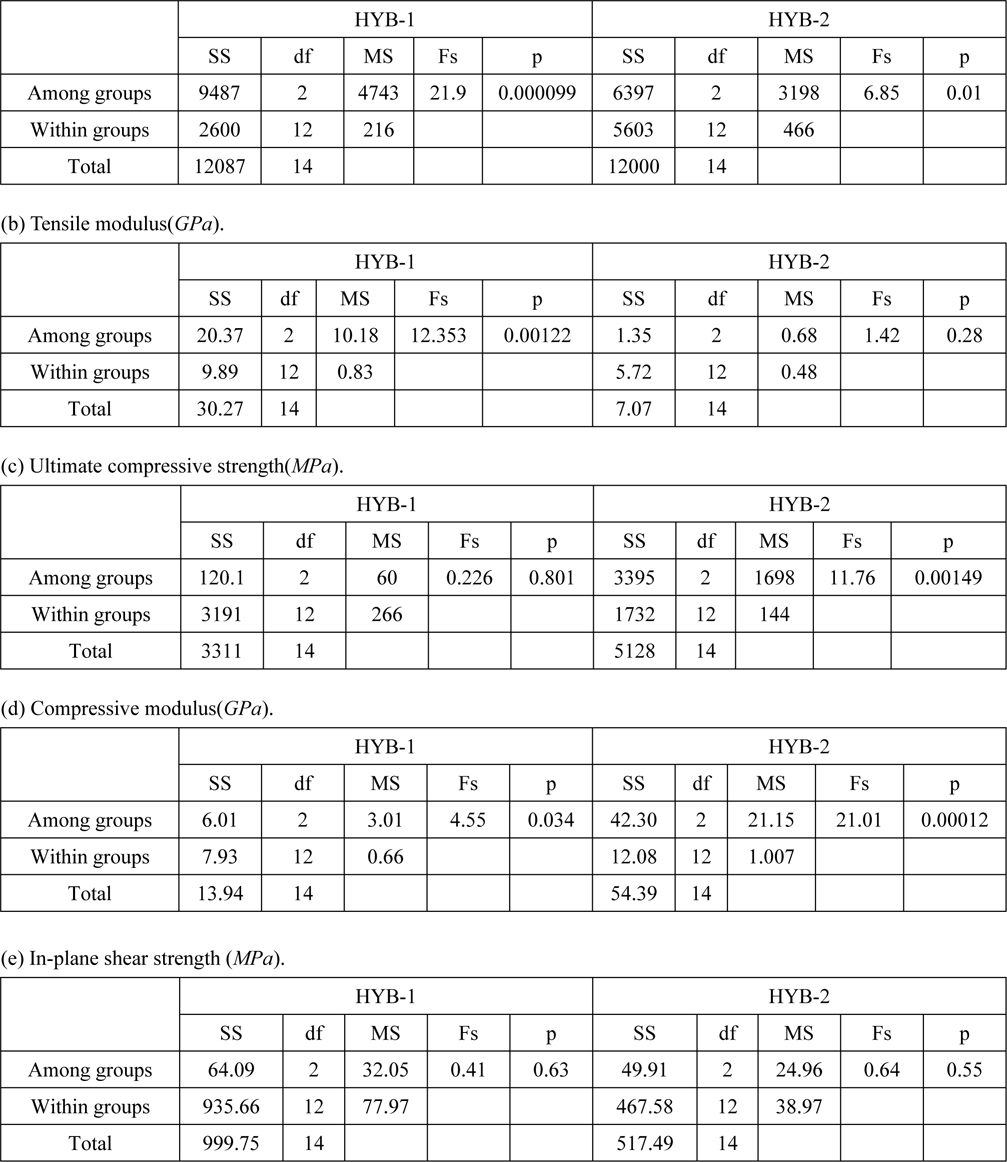
one-way ANOVA tables for the mechanical properties of the HYB samples.
In this paper, the mechanical properties and failure mechanisms of the GFRP composite materials including the hand layup processed, the vacuum infusion processed and the hybrid GFRP composites are investigated. The mid-sized marine GFRP vessel production quality is evaluated with assessing the homogeneity of GFRP production batches. The conclusive remarks can be summarized as follows:
Vacuum infusion processed GFRP samples have larger average ultimate strength and modulus than the hand layup processed GFRP samples in both tension and compression tests. This is predominantly due to the higher fiber volume fraction of the vacuum infusion processed samples. In punching shear tests, the vacuum infusion processed samples have a larger shear strength and displacement over thickness value than hand layup processed samples due to hand layup’s increased porosity.
Hybrid composites presented many of the characteristics found from the hand layup processed samples and the vacuum infusion processed samples. In tension, failure initiates on the hand layup processed layers and ultimately fails on the vacuum infusion process layers. In contrast, the vacuum infusion processed layers fail first in compression. The moduli in tension and compression are proportional to the fiber weight fraction of the hybrid GFRP samples due to their sensitivity to fiber weight percent. In case of in-plane shear failure placed on the interface where the only matrix exists, the in-plane shear strength is insignificantly different regardless of materials.
The hybrid GFRP consisting of 3 sets of the vacuum infusion processed layers on 2 sets of the hand layup processed layers overall exhibits the best mechanical properties over the hybrid GFRP samples with 1 or 2 vacuum infusion processed sets. It is noteworthy that some mechanical properties of the hybrid composites with 2 sets of vacuum infusion processed layers are not improved when compared to those of the hybrid composites with 1 set of vacuum infusion processed layers.
One-way analysis of variance test shows that the mechanical properties of the hand lay-up and vacuum infusion processed GFRP samples are virtually homogeneous among the vessel manufacturing batches. However, batch homogeneity of hybrid GFRP samples is lower than those of hand layup or vacuum infusion processed ones.