This paper reports the results obtained for there flection and transmission coefficients on rubble mound breakwaters in Busan Yacht Harbor. A2D physical model test was conducted in the wave flume at the Coastal Engineering Research Laboratory at Pusan National University, Busan, South Korea. In this study, physical model tests were completed to further our understanding of the hydrodynamic processes that surround a rubble mound structure subjected to irregular waves. In particular, the reflection and transmission coefficients, as well as the spectrum transformation, were analyzed. This analysis suggests that with an increase in wave height around a rubble mound, the reflection coefficient drastically increases at each water level (HHW or MSL or LLW). Moreover, when the water level changes from HHW to LLW, the reflection coefficient is suddenly reduced. A further result of the analysis is that the transmission coefficient strongly drops away from the rear of the structure. Finally, in regard to the rubble mound breakwater in Busan Yacht Harbor, a consideration of the reflection and transmission coefficients plays an important role in the design.
Breaking waves play an important part in almost all coastal engineering issues. Key functions of breakwaters are providing protection against waves in harbors and approach channels, as well as against currents and siltation. An additional purpose of breakwaters is providing mooring services for wind turbines, ships, etc. The difficulties that ships are faced with when they approach the harbor can be reduced by decreasing wave height. Moreover, utilizing safety facilities in the harbor can facilitate sailing safely through the approach channel. In the past few decades a variety of breakwaters have been created. Since these varieties have been implemented, the results indicate that the structures are far from optimal. In South Korea's, Busan coastal area, Rubble Mound Breakwaters have been studied. The Rubble mound breakwater in this area of the beach was the most suitable project for this investigation, which was designed to test irregular waves. For the design of Rubble Mounds, reflection coefficient is one of the most significant hydraulic replies of a breakwater. Furthermore, the main parameter for design of breakwaters is in fact reflection coefficient. In the coastal and harbor structure, the analysis of reflection of waves has been complicated by physical processes which depend on hydro dynamical situations (waves, wave height, wave period, et al.) and type of breakwater.
In addition, little research has been done in the past that focuses on reflection coefficient.
Goda's research (1974) is a rare example. The reflection behaviour for numerous types of conventional slopes, such as rubble mound structures and slopes with all types of simulated armour elements, have been analyzed in depth by Zanuttigh and Van der Meer (2006). This resulted in a broad reflection database that contains segment of the DELOS wave transmission database (Van der Meer et al., 2005). They have established a new formulation for all types of straight slopes in design situations and done an initial analysis on the extension to non-straight slopes (Zanuttigh and Van der Meer, 2007). The results of using stones based on regular wave tests by Brebner and Donnelly (1963) have been very useful in establishing design criteria. Due to the existence of irregular waves especially in deep water areas, and caution should be paid to wave heights during design. Such calculating devices may be co-located probes e.g (Hughes, 1994), or wave probe arrays e.g (Goda and Suzuki 1976; Isaacson, 1991).
In this study, physical model tests have been done in order to further understanding of hydrodynamic processes surround the Rubble Mound in Busan Yacht Harbor when it was subject to irregular waves. Particularly, the reflection coefficients as well as the spectrum transformation have been analyzed. This study focuses on the Rubble Mound structure in Busan Yacht Harbor.
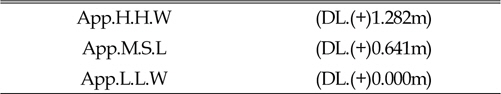
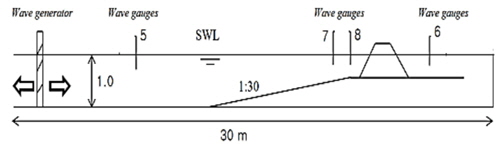
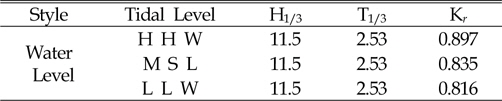
The 2D physical experiments have been done in the wave flume of Coastal Engineering Laboratory. Length of the test flume is 30m, width is 0.60m and height is 1 m. All tests included irregular waves in three kinds (see Table 1) of water level, higher high Water, mean sea level, low water level and dimension levels (Higher high water (HHW), Mean sea level (MSL), Low water level (LLW) and Dimension levels (DL)), based on the Bretschneider-Mitsuyasu spectrum. Wave generator paddle in 00 angle wave attack provided mechanically irregular waves on the flume, which is controlled by a personal program. The program on the computer can be used to generator regular, irregular and a variety of other wave conditions. After finding exactly irregular waves, the computer program was used to make waves with generator (wave period, wave height) according to a model in the scale of prototype. The present experiment made use of 4 wave gauges; the first wave gauge was in front of the generator (5 channel), the second wave gauge was 2 meters in front of the crest rubble mound (7 channel), the third gauge was 1 meter from the crest rubble mound and in front of structure (8 channel), and the last gauge (channel 6) was behind the structure 1 meter distant from crest of Rubble Mound. (see figures 1and 2).
[Table. 1] Three kinds of water level for experiment

Three kinds of water level for experiment
3. Test Equipment and Procedure
A Bretschneider Mitsuyasu spectrum was produced with
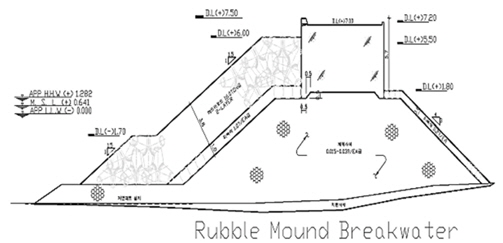
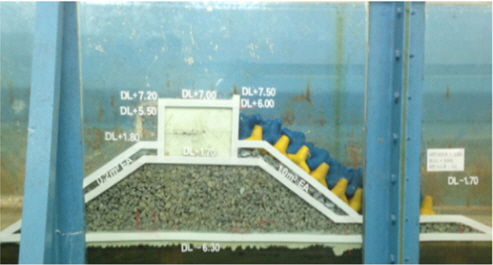
A detail of the Rubble Mound structure used in physical model studies is shown in Figure 3. The bottom slope of flume was 1 in 40. This experiment used a double layer of 12-ton tetrapod in two kinds of color (blue and yellow), as shown in Figure 3. In the computer program, wave height was adjusted to 20.7 cm when the wave generator was used in the physical model test. Bretschneider–Mitsuyasu spectrum was used for the experimental output to realize the capacity of energy spectrum for different locations of the flume (in front of and behind structure). Bretschneider–Mitsuyasu spectrum was set by:

where S(
[Table. 2] Data of rubble mound breakwater

Data of rubble mound breakwater
Figure 3 depicts the elevation of crest freeboard (DL+7.5) and also three water level's elevation in the physical model. After setting up the structure in the flume, water inlet valve was opened until reach the desired water level in the flume (HHW, MSL, LLW). Then wave generator system was started by personal controller for maximum wave height determinates:
where hMax is the maximum wave height in computer programing to start wave generator. Scale of the physical model used in the Laboratory that was 1/40, and
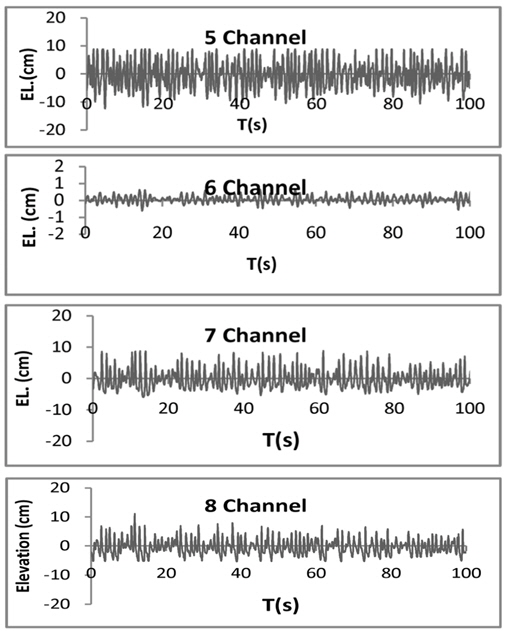
The time series in each experiment's description of the surface elevation of a sea state versus time is shown in Figure 4. Figure 4 demonstrates that with increase of time and location of the gauges, elevation of the wave height changed.
In Figure 4, it can be seen that with the increase in time, and with attention to the location gauges in the physical model, wave height suddenly changes significantly. This result is similar for the two other surface water levels.
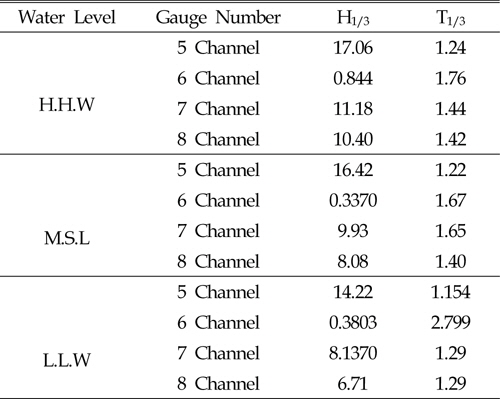
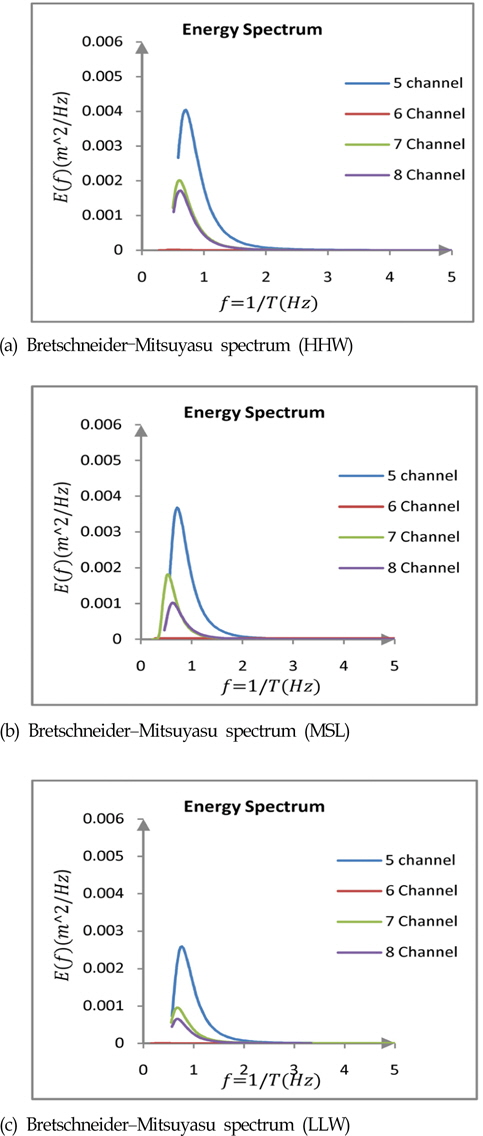
Regarding comparison of maximum energy spectrum between the four locations in HHW, channel 5, S(
These results mean that when making specific waves by wave generator, these waves reduced with distance from the generator, so that significant wave and energy spectrum also decreased. Figure 5 demonstrates that energy spectrum in the case of channel 6 there was minimum energy when using Bretschneider–Mitsuyasu spectrum, since that case was behind the structure and there was very little variation of wave significant.
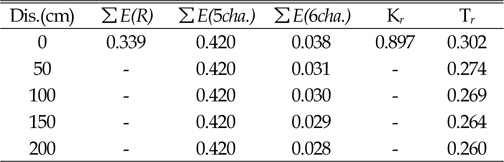
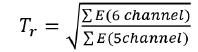
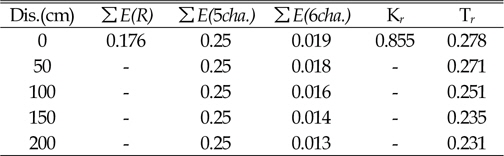
In Table 3, reflections and transmission coefficient were obtained by use of the following equation.
[Table. 3] Particularity of Water Level (HHW)

Particularity of Water Level (HHW)
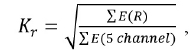
where,
∑
and
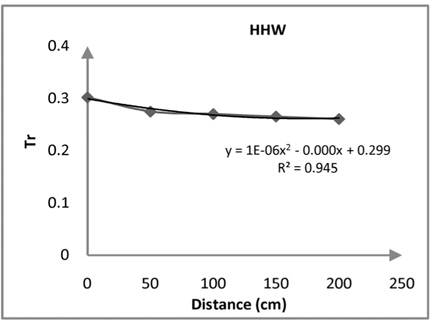
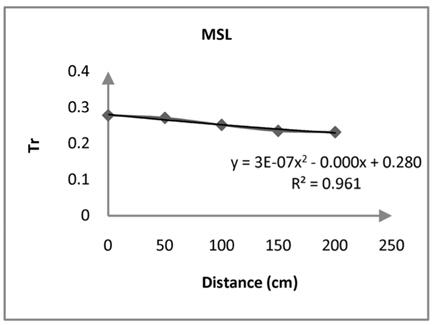
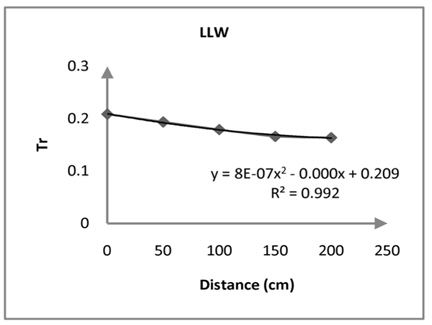
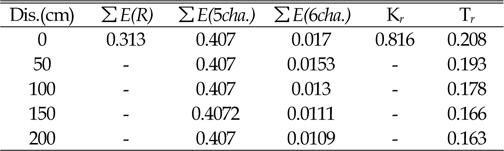
In this experiment, to obtain transmission coefficient in the gauge of channel 6, five different locations of gauge with a distance of 50 cm from each other were performed. The results suggest that with increasing distance of sensor channel 6 from the structure, transmission strongly decreases (see Figures 6, 7 and 8 and Tables 3, 4 and 5).
[Table. 4] particularity of Water Level (MSL)
particularity of Water Level (MSL)
[Table. 5] Particularity of Water Level (LLW)
Particularity of Water Level (LLW)
[Table. 6] reflection Coefficient in the three water level
reflection Coefficient in the three water level
The results of this experimental analysis of rubble mound demonstrated that with increase of water level reflection coefficient increases. Moreover, as distance from the rear of structure increases transmission coefficient strongly decreases. These mean that in the Busan area the distance of 0.80 meters behind the Rubble Mound was very safe and suitable for shipping. As a consequence, wave reflection and wave transmission were important parameters for design of rubblemound in Busan Yacht Harbor. Furthermore, analysis of energy spectrum shows that highest energy was in the location of maximum significant waves, and the results of this research confirmed the entire of process.