We investigated the effects of feeding rate on the growth, blood components, and histology of sub-adult olive flounder
세계 양식선진국은 환경친화적 배합사료를 사용하여 지속가능한 양식업을 육성하고 양식시스템을 자동화하는 등 경쟁력을 강화하고 있다. 배합사료의 사용은 자동공급기를 통해 사료를 공급할 수 있을 뿐 아니라 체계적인 사육관리를 통해 양식방법을 효율화 시킬 수 있다. 우리나라도 안전한 양식수산물 공급, 수산자원 남획 및 어장환경오염 방지 등 지속가능한 양식업 육성을 위하여 배합사료 사용 확대가 필요한 시점이다(Kim et al., 2014). 최근 제주, 여수, 신안, 거제, 울진 및 영덕을 배합사료 시범지역으로 선정하여 다양한 해산어류를 생사료를 사용하지 않고 배합사료를 사용하여 양식하고 있다. 하지만 각 양식어종에 대한 배합사료 공급프로그램이 개발되지 않아 실제 양식현장에서는 대부분 만복공급을 실시하고 있는 실정이다. 배합사료의 만복공급은 사료의 허실로 인한 수질오염 및 생산단가 상승을 초래하며, 소화 및 대사 장애 등의 문제점이 발생할 수 있다(Kim et al., 2014; Lee et al., 2014). 따라서 향후 배합사료 사용확대를 위해서는 각 양식어종에 대한 성장단계별 및 수온별 배합사료 공급량에 대한 공급프로그램이 개발되어야 할 것이다.
넙치는 2013년 기준 우리나라 전체 해산어 총생산량 73,108톤 중 36,944톤이 생산되어 51%를 차지하는 중요한 양식어종이다(Statistics Korea, 2014). 넙치의 출하크기는 대부분 1 kg 내외였으나, 최근 2 kg 이상의 대형넙치의 생산 및 출하가 꾸준히 증가하고 있는 추세이다. 지금까지 넙치에서 보고된 공급량 연구결과를 보면 대부분 치어기 단계(Choi et al., 2008; Kim et al., 2010; Kim et al., 2011; Kim et al., 2014) 또는 여름철 고수온기 및 겨울철 저수온기(Kim et al., 2009; Kim et al., 2010)에 이루어 졌으며, 300 g 이상의 크기에서는 연구가 전무한 실정이다. 따라서 본 연구는 배합사료 공급프로그램 개발을 위한 기초연구로 384 g 넙치의 최적 사육수온 범위인 20-24.5℃ 수온에서 배합사료의 적정공급량 조사와 더불어 성장, 사료효율, 혈액성분 및 조직성상에 미치는 영향을 알아보기 위해 수행되었다.
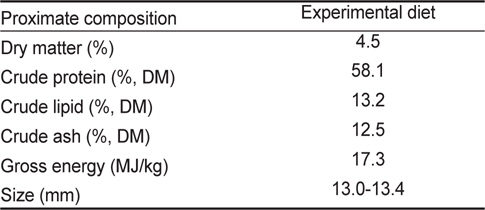
본 실험에 사용된 실험사료는 상업용 시판 넙치용 배합사료를 이용하였으며, 일반성분 분석은 Table 1에 나타내었다. 384g 육성기 넙치의 적정 사료공급량 확인을 위해 어체 무게당(g) 0%, 0.3%, 0.5%, 0.7% 및 만복공급(Saturation)으로 설정하여 총 5개 실험구로 나누어 공급하였다.

Proximate analysis of the experimental diet of the olive flounder (Paralichthys olivaceus; % of DM basis)
사양실험에 사용된 실험어류는 제주도내 창해수산에서 제주대학교 소속 해양과환경연구소로 운송되어 2주 동안 시판 배합사료를 공급하면서 실험환경에 적응할 수 있도록 순치시킨 후 사료공급실험에 사용되었다. 예비사육 후 실험어류(초기 평균 무게: 384.2±5.91 g)는 총 10개의 1,200 L 원형수조에 각 수조당 27 마리씩 무작위로 선택하여 배치되었다. 사료공급실험은 실험구당 2 반복구를 두었으며, 사육수는 여과해수를 사용하여 2-3 L/min 의 유수량이 공급되도록 조절되었고, 모든 실험수조에 용존산소 유지와 원활한 사육수 순환을 위하여 에어스톤을 설치하였다. 광주기는 자동타이머가 설치된 형광등을 이용하여 12L:12D 조건으로 유지되었고, 전 실험기간 동안 평균 수온은 20℃에서 24.5℃ 범위로 자연수온에 의존되었다. 실험사료는 1일 2회(오전 08:00, 오후 18:00)에 나눠서 3주 동안 어체중의 수준별로 공급하였다.
사료공급 실험 후, 어류의 최종 평균무게를 측정하여 증체율(weight gain), 사료효율(feed efficiency), 일간성장률(specific growth rate), 단백질전환효율(protein efficiency ratio) 및 생존율(survival)을 계산하였다. 최종 무게측정 후, 혈액분석을 위해 각 수조마다 4마리씩 무작위로 선별하여 마취용액(MS-222, 100 mg/L)으로 마취시켜 헤파린 처리가 된 주사기를 사용하여 미부동맥에서 채혈한 후, hematocrit 및 hemoglobin 함량을 측정하였다. 분석 후, 남은 혈액은 ALT (alanine aminotransferase), AST (aspartate aminotransferase), total protein 및 glucose 분석을 위해 원심분리기(Micro 17TR, Hanil Science, Korea)를 이용하여 5,000 rpm으로 10분간 원심분리하여 혈장을 분리하였다.
실험사료의 일반성분 분석은 AOAC (2000) 방법에 따라 수분은 상압가열건조법(125℃, 3 h), 조회분은 직접회화법(550℃, 12 h)으로 측정하였고, 단백질은 자동 조단백분석기(Kejltec system 2300, Sweden)로 분석되었으며, 지방은 Folch et al. (1959)의 방법에 따라 Soxhlet 추출장치(Soxhlet heater system C-SH6, Korea)를 이용하여 분석되었다.
Hematocrit은 헤파린이 처리된 모세혈관채혈튜브(Micro Hematocrit Capillary Tubes)에 혈액을 채운 다음 고무판(Wax plates)에 세운 후, 혈액진단원심분리기(Micro Hematocrit VS-12000, Vision Scientific, Korea)에서 10분간 원심분리하여 값을 측정하였다.
Hemoglobin, ALT, AST, total protein 및 glucose 함량은 각각의 시약과 반응시킨 후 혈액생화학분석기(Express plus system, Bayer, USA)를 이용하여 분석하였다. ALT와 AST는 kinetic, hemoglobin, total protein 및 glucose 함량은 end point방법으로 분석되었다.
넙치 해부를 통하여 간췌장, 신장 및 전장의 조직학적 변화를 확인하기 위해 각 실험구당 3마리씩 무작위로 추출하였다. 해부한 조직을 Bouin's solution에 24시간 동안 고정 후 고정된 샘플을 수세와 탈수를 거쳐 paraffin에 포매하여 4-6 μm 두께로 연속절편하여 조직표본을 만들었다. 제작된 조직표본은 Mayer's hematoxylin과 0.5% eosin (H-E)의 비교염색을 실시한 후 광학현미경으로 관찰하였다.
실험사료군의 배치는 완전확률계획법(Completely randomized design)에 따라 실시하였고, 성장 및 분석결과는 SPSS(Version 12.0) 프로그램을 이용하여 One-way ANOVA로 통계 분석되었다. 실험 데이터 값의 유의차는 Duncan’s multiple test (
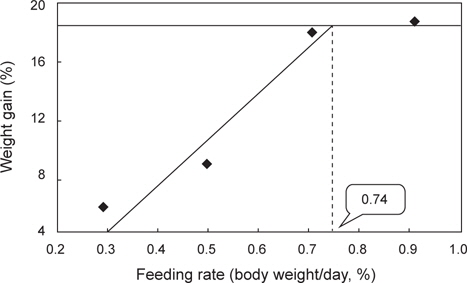
미성어기 넙치(384 g)를 대상으로 적수온기 배합사료 공급량을 알아보기 위한 3주간의 성장실험 결과는 Table 2에 나타내었다. 성장결과에 있어서는 사료를 공급하지 않은 0% 실험구에서 어체중이 감소되는 성장률(-13.9%)을 보였으며, 하루에 약 0.79 g 어체중이 감소하였다. 증체율 및 일간성장률에서는 사료공급량이 증가함에 따라 증가하여 0.7% 및 만복실험구에서 유의적으로 가장 높은 성장률을 보였다. 가장 성장률이 높은 만복실험구의 경우 3주 동안 약 72 g 성장하였다. 사료효율, 단백질전환효율 및 생존율에서는 모든 실험구에서 유의적인 차이를 보이지 않았다. Kim et al. (2014)의 연구에서도 본 연구와 비슷하게 97 g 넙치를 대상으로 21℃ 수온에서 사료공급량 실험을 실시한 결과, 사료를 공급하지 않은 절식실험구(0%)에서 어체중이 감소하는 성장률(-12.5%)을 보였으며, 하루에 약 0.7 g 어체중이 감소하였다. 증체율 및 일간성장률에 있어서도 사료공급량이 증가함에 따라 유의적으로 증가하여 만복실험구에서 유의적으로 높은 성장률을 보였다. 또한 Lee et al. (2014)은 넙치(240 g)를 대상으로 19-21℃ 수온에서 사료공급량 실험을 실시하였는데 사료를 공급하지 않은 절식실험구(0%)에서 본 연구 결과와 유사하게 어체중이 감소하는 성장률(-8.1%)을 보였으며, 하루에 약 0.4 g 어체중이 감소하였다. 증체율 및 일간성장률에서도 본 연구결과와 유사하게 만복실험구에서 유의적으로 높은 결과를 보였다. 지금까지 보고된 적정공급률 연구결과를 보면 97 g 넙치는 하루에 어체중의 2.23%, 240 g 넙치의 경우 1.09%, 317 g 넙치는 0.99%로 분석되었다. 본 연구의 경우 성장률을 기초로 브로큰라인 분석을 통한 미성어기 384 g 넙치의 적정공급률은 0.74%로 분석되었다. 지금까지의 연구결과를 보면 일반적으로 사료공급량은 어체 크기 및 사육수온에 따라 다르며, 어류가 성장함에 따라 공급률은 감소되는 결과를 보였다(Schmittou et al., 1998; NRC, 2011). 본 연구에서도 이전의 연구결과와 비교하였을 때 넙치가 성장함에 따라 공급률은 감소되는 것을 알 수 있었다. 이와 비슷한 연구결과는 다른 어종에서도 많이 보고되었다(De Silva et al., 1986; Hung and Lutes 1987; Adebayo et al., 2000; Ng et al., 2000; Mihelakakis et al., 2002). 따라서 384-453 g 미성어기 넙치는 사료섭취가 가능한 범위에서 사료가 허실되지 않게 어체중의 0.74%를 공급하는 것이 적절할 것으로 판단된다.
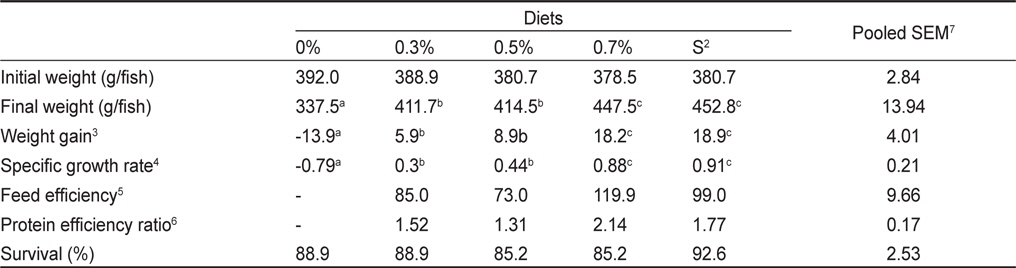
Effects of feeding rate on the growth performance of olive flounder Paralichthys olivaceus fed the experimental diet for 3 weeks1
배합사료 공급률이 넙치의 혈액성상에 미치는 영향을 알아보기 위해 조사한 혈액분석 결과는 Table 3에 나타내었다. Hematocrit, hemoglobin 및 glucose 함량은 모든 실험구에서 유의적인 차이를 보이지 않았다. AST의 경우 0.5% 실험구에서 가장 높은 수치를 보였으나, 만복실험구와는 유의적인 차이를 보이지 않았다. ALT에 있어서는 만복실험구가 0.5% 실험구와 비교하여 유의적으로 높은 수치를 보였다. Total protein 함량은 0.5% 실험구에서 유의적으로 높은 함량을 보였으며, 만복실험구와는 유의적인 차이를 보이지 않았다. 본 연구는 비록 3주라는 짧은 기간 동안 수행되었지만 만복실험구에서 다른 실험구와 비교하여 높은 ALT 및 AST 함량을 보였다. ALT와 AST는 일반적으로 척추동물에서 간의 기능과 상태를 나타내는 지표로서 사용되며 일반적으로 높은 ALT와 AST는 간 기능의 손상 또는 약화를 의미한다(Pan et al., 2003). 따라서 장기간 사료를 만복으로 공급하였을 경우 사료를 소화하여 흡수하기 위한 대사과정에서 간 기능이 약화되어 정상적인 영양소 대사에 영향을 끼칠 수 있을 것으로 본다. 이전의 연구에서도 만복실험구에서 hematocrit 및 hemoglobin 수치가 감소되었으며(Kim et al., 2014, Oh et al., 2014), AST의 함량이 유의적으로 높은 결과를 보였다(Kim et al., 2014). 배합사료의 만복공급은 성장에는 효과가 있으나, 3주라는 짧은 기간임에도 불구하고 혈액분석 결과에서 좋지 않은 결과를 보임으로서 향후 보다 더 정확한 매커니즘을 파악하기 위해서는 장기간 사육실험을 통한 평가가 이루어져야 할 것으로 판단된다.
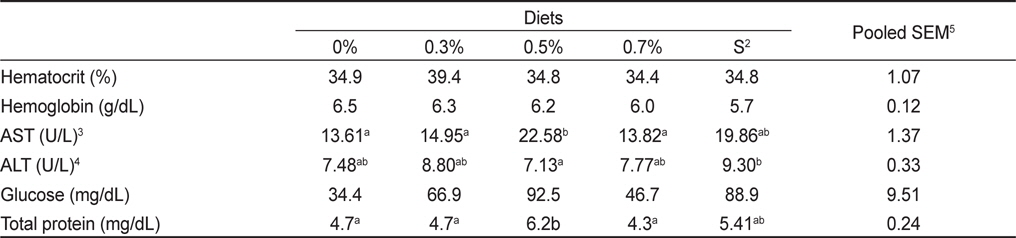
Effects of feeding rate on the serological characteristics of olive flounder Paralichthys olivaceus fed the experimental diet for 3 weeks1
사료공급률을 달리하여 사육한 실험어의 전어체 분석 결과는 Table 4에 나타내었다. 전어체의 수분함량에서는 모든 실험구에서 유의적인 차이를 보이지 않았다. 단백질 함량은 만복실험구가 다른 실험구와 비교하여 유의적으로 높은 값을 보였으며, 지방함량은 만복실험구가 다른 실험구와 비교하여 유의적으로 낮은 값을 보였다. 회분함량에서는 절식실험구가 다른 실험구와 비교하여 유의적으로 높은 값을 보였다. 본 연구에서는 동일한 실험사료를 공급하였음에도 불구하고 전어체의 일반성분 결과가 다른 것은 공급량을 제한함으로써 어체성장에 필요한 적정 영양소요구량을 섭취하지 못하였기 때문으로 판단된다. 따라서 배합사료의 공급량이 과잉 또는 부족하게 되어 전어체의 일반성분에도 영향을 주었을 것으로 판단된다. 하지만 보다 더 정확한 매커니즘을 파악하기 위해서는 장기간의 실험을 통한 증명이 필요할 것으로 판단된다.
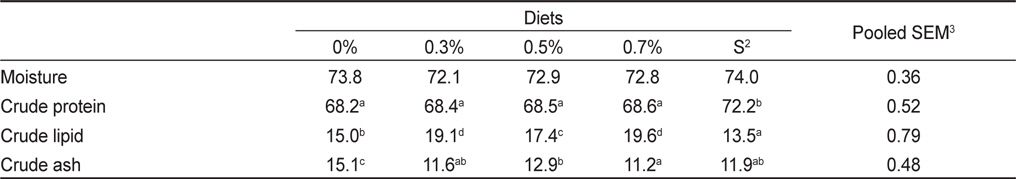
Effects of feeding rate on the whole-body composition of olive flounder Paralichthys olivaceus fed the experimental diet for 3 weeks (%)1
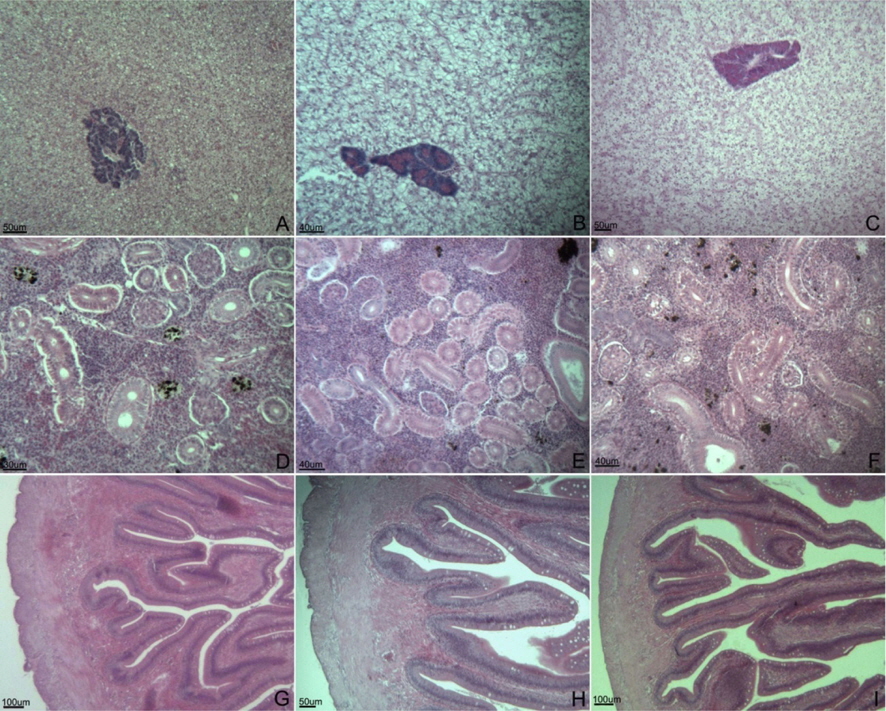
배합사료의 공급량이 넙치의 간췌장, 신장 및 전장의 조직학적 변화에 미치는 영향을 알아보기 위해 0% (절식실험구), 0.5% 및 만복실험구(saturation)의 조직상을 조사한 결과는 Fig. 1에 나타내었다. 3주간의 사육실험 동안 모든 실험구에서 복부팽창과 같은 병변현상은 관찰되지 않았다. 모든 실험구의 간췌장, 신장 및 전장에서 정상적인 조직상을 보였으며 차이를 보이지 않았다. Kim et al. (2011)은 저수온기 넙치 치어를 대상으로 배합사료 공급률을 달리하여 간췌장, 신장, 전장에서 조직분석을 실시한 결과, 적정공급률 실험구가 절식실험구 및 만복실험구와 비교하여 양호한 조직상을 보여 주었다. Kim et al., (2014) 연구에서도 적정수온에서 넙치 240 g을 대상으로 공급률을 달리하여 조직분석을 실시한 결과, 적정공급률 실험구가 절식실험구 및 만복실험구와 비교하여 양호한 조직상을 보여주었다. 이러한 결과는 어류가 사료를 정상적으로 섭취하지 못하거나 이와 반대로 과잉 공급되어 영양소의 소화 및 흡수 작용에 영향을 미친 것으로 사료된다. 이러한 결과는 배합사료가 과잉 또는 불충분하게 되면 양식어류의 내부 소화기관에도 부정적 영향을 끼칠 수 있음을 시사한다. 이와 다르게 본 연구의 조직분석에서 차이를 보이지 않은 것은 어체의 크기 및 수온 등의 차이로 판단된다.
연구결과를 종합해 보면, 배합사료의 공급률은 미성어기 넙치의 성장에 영향을 미치므로 넙치 사육시 사육수온과 성장단계를 고려하여 적정량의 사료가 공급되도록 관리되어야 할 것이다. 또한 장기간 사료를 공급하지 않거나 만복공급을 했을 경우 어류의 건강도에 부정적인 영향을 끼칠 수 있을 것으로 판단된다. 최적수온인 20-24.5℃에서 성장률을 기초로 Broken-line regression 분석을 통한 넙치 384 g의 배합사료 적정공급률은 어체중 당 0.74%가 적절한 것으로 사료된다. 향후에는 장기간에 걸쳐 치어부터 성어까지 전체 성장단계에 걸쳐 배합사료 공급률에 대한 효과가 평가되어야 할 것으로 판단된다.