검색 전체 메뉴
PDF
맨 위로
OA 학술지
기후변화에 따른 대청호 추동지점에서의 남조류 발생 패턴 분석 Effect of Climate Change for Cyanobacteria Growth Pattern in Chudong Station of Lake Daechung
  • 비영리 CC BY-NC
ABSTRACT

To study the fluctuations and relationship in climate change, environmental factors and cyanobacteria communities, we investigated Chudong station of the Daechung reservoir. The average annual temperature showed the maximum value (13.9℃) from 1994, showed a gradually increasing pattern from 1969 to 2010 in the Daechung reservoir. The number of days with temperatures over 20℃, minimum temperature of the year and average temperature of the winter season patterns also showed a significant increase. The long-time changed in the annual precipitation were not showed a significant variation. The water temperature record comparatively high value in summer, declined in winter. At all period, the phytoplankton were highest biomass in July 2000, and then, showed comparative higher biomass in the summer months. Cyanobacteria taxa were also showed more than 50%. Emergence of cyanobacteria also appeared in November 2007, were prolonged emergence. The dominant genera of taxa were the dominant sphere (Microcystis spp.) until early 2000. After that, the dominant species were the dominant linear (Aphanizomenon spp., Anabaena spp.). Cyanobacteria were the most correlated with water temperature (r =0.341, p< 0.01) and phosphate concentration (r = 0.355, p< 0.01).

KEYWORD
Chudong , Climate change , Cyanobacteria , Daechung reservoir
  • 1. Introduction

    현재 전 세계적으로 환경오염으로 인한 지구온난화가 진행되고 있으며 이에 따른 기후변화로 인해 이상 저온, 이상 고온, 홍수, 가뭄 등의 현상이 발생하고 있다. 또한 이런 현상은 하천, 호수의 물리화학적 및 생태학적 특성을 교란시키는 등 수생태계에도 영향을 미치고 있다(Bates et al., 2008). 우리나라에도 환경오염으로 인한 지구온난화 현상으로 평균 기온 상승, 이상 기후(폭설 등) 현상 등이 나타나고 있어 향후 수생태계 내의 에너지 흐름 교란에 영향을 미칠 것으로 예상된다.

    수생태계 내의 미소 먹이망 중 1차 생산자인 식물플랑크톤은 수온과 수질(영양염류 등)에 가장 민감하게 반응하는 생물군으로 기후변화에 따른 수온 상승은 식물플랑크톤의 생활사에 직・간접적으로 영향을 미친다(Blenckner et al., 2002).

    여름철 부영양화 수계에서는 식물플랑크톤의 대량 발생을 야기시키며 수온상승으로 인한 남조류의 발생을 촉진시킨다. 남조류의 대발생은 수돗물의 이취미 발생, 불쾌감 등을 초래하여 우리나라 뿐 아니라 많은 여러 나라에서 문제가 되고 있다. 특히 남조류 중 Microcystis, Anabaena, Aphanizomenon 속 등은 가축과 사람에 간암 및 신경계통에 독성을 유발하는 유해한 물질을 생산하는 것으로 알려져 있다.

    이런 유해 남조류에 대한 발생 특성 및 기작에 관한 연구는 국내 외적으로 많이 수행되어지고 있다(Kim and Moon, 2000; Kim et al., 2013; Lee, Jheong et al., 2010; Lee and Cho, 2006; Li et al., 2010; Liu et al., 2011; Wu et al., 2010; You et al., 2013).

    본 조사 수역인 대청호는 대전과 충청도 지역에 필요한 수자원 공급, 발전, 홍수조절을 목적으로 축조된 댐(대청댐)에 의해서 형성된 인공호로 구불구불한 하천 모형의 특성에 따라 수체류시간이 길고 오염물질이 장기간 체류되어 매년 여름철 부영양화 현상이 반복적으로 일어나고 있다. 그리고 대청호는 여름철 집중강우 발생시 유역에 산재해있던 오염물질이 단기간 내에 호수로 유입되는 특성에 의해서 하절기에 남조류의 대발생 현상이 매년 빈번히 발생하고 있으며 꾸준한 연구도 수행되어지고 있으나(Cho et al., 2012,; Jeong et al., 2011; Lee, Lee et al., 2010; Lee et al., 2005; Park, 2005), 장기 기후변화에 따른 수질환경요인 및 남조류의 발생 패턴과의 관계에 관한 연구는 아직 보고된 바가 없다.

    따라서 본 연구에서는 대청호 추동지점을 대상으로 장기적 남조류 발생 패턴을 분석하고, 기후변화에 따른 수질환경 요인 및 남조류의 발생 패턴 간의 관계를 파악하여 기후변화가 남조류 발생에 어떠한 영향을 미치는지에 대해 연구하고자 하였다.

    2. Materials and Methods

       2.1. 조사 지점 개황

    대청호는 금강수계 수자원의 다목적 개발을 위하여 건설된 인공호수로서 하구로부터 약 150 km 상류지점인 대전광역시 대덕구 미호동과 충북 청원군 문의면 덕유리 사이에 대청댐을 건설하면서 조성되었다. 대청호 유역은 전북 무주군, 충남 금산군, 충북 영동군・옥천군・보은군・청원군, 경북 상주시 및 대전광역시의 동구와 대덕구의 전부 혹은 일부가 포함된다. 용담호 유역(930 km2)을 포함한 대청호의 유역면적은 4,134 km2이고, 연간 용수 공급량은 1,649백만 m3이다(NWRMIIS. 2006).

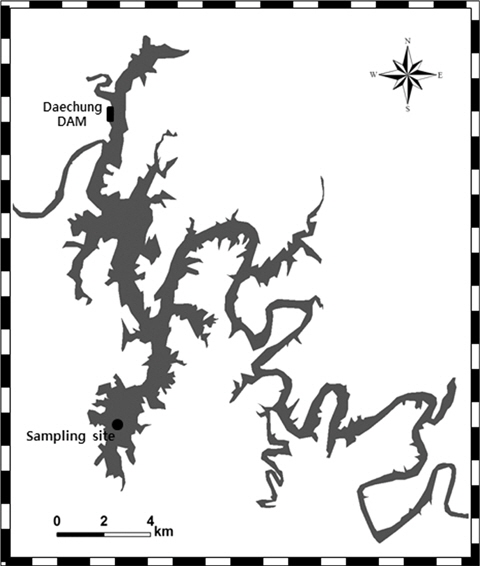
    대청호는 저수면적에 대한 유역면적의 비가 56.8로서 유역면적이 상대적으로 넓어 오염의 가능성이 크며, 총저수량에 대한 유효저수량의 비율이 53.0%로서 소양호(65.5%)나 충주호(65.1%) 보다 용수 이용율이 낮은 호소이다(NWRMIIS. 2006). 본 연구의 조사지점인 추동지점은 대청호로 직접 유입되는 주원천 합류부 근처로 대청호 중간의 만입부에 위치하고 있다. 추동 지점은 주원천 유입부가 대청호에서 넓게 만입되어진 형태적 특성에 따라 상류지점들에 비해 강우에 의한 유입유량의 변화와 유입수의 수질변화에 의한 영향을 비교적 적게 받으며, 대전 지역의 상수원으로 사용되는 대전취수탑이 위치하고 있어 대청호 조류경보제 대상 지점이다(Fig. 1).

       2.2. 연구 방법

    기후변화에 따른 수생태계 변화에 대한 장기 모니터링을 위하여 1969년부터 2010년까지 기상청 기상 관측자료(대전 관측소)의 기온 및 강우량 데이터를 사용하였다. 기온은 일단위 데이터를 이용하여 연평균기온, 최고기온, 최저기온, 20℃ 이상 일수 등을 계산하였으며, 6월~ 8월까지를 여름철, 12월~ 2월까지를 겨울철로 보고 각 계절별 평균기온을 산출하였다. 대청호 강우량의 경우 대청호 유역 기상관측소들의 자료를 사용하여 티센비를 이용한 면적 강우량을 선정하였다. 이를 이용하여 연평균 강우량, 일 최대 강우량, 5 mm 이하 강우일수 등을 산출하였다.

    물리・화학적 수질 환경 요인은 1993년부터 2010년까지 측정된 추동 지점의 수질측정망 운영계획(WEIS, 물환경정보시스템) 자료로 Chlorophyll a, 수온, 총질소(TN), 용존총 질소(DTN), 암모니아성 질소(NH4-N), 질산성 질소(NO3-N), 총인(TP), 인산염인(PO4-P), 용존총인(DTP) 항목의 일단위 데이터를 사용하여 매월 평균값을 계산하였다.

    대청호 추동지점의 식물플랑크톤은 2000년부터 2010년, 3월부터 11월까지 주 1회 대청호 조류예보제 시행을 위해 조사된 속 수준의 자료를 이용하였다(GRERC, 2000; GRERC, 2001; GRERC, 2002; GRERC, 2003; GRERC, 2004; Lee et al., 2007; Lee et al., 2009; Park et al., 2008; Park et al., 2006; Park et al., 2007). 식물플랑크톤 분류군별 현존량은 남조류, 녹조류, 규조류, 기타조류로 분류하여 파악하였으며, 분류군별 종조성 및 우점종을 선정하였다.

       2.3. 통계 분석

    기상학적, 물리・화학적 요인 및 생물 요인 간의 상관성을 파악하고자 SPSS (v. 10.0)을 이용하여 상관분석을 시행하였다. 또한 이들 간의 관계를 파악하고자 주성분 분석을 실시 한 후, 그 요인 중 유해조류의 변화에 가장 영향을 주는 기후, 환경요인의 정도(유의성)을 파악하고자 선형회귀분석(Linear regression)을 실시하였다. 통계적 유의성은 p<0.05를 기준으로 하였다.

    3. Results and Discussion

       3.1. 기상학적 특성 분석

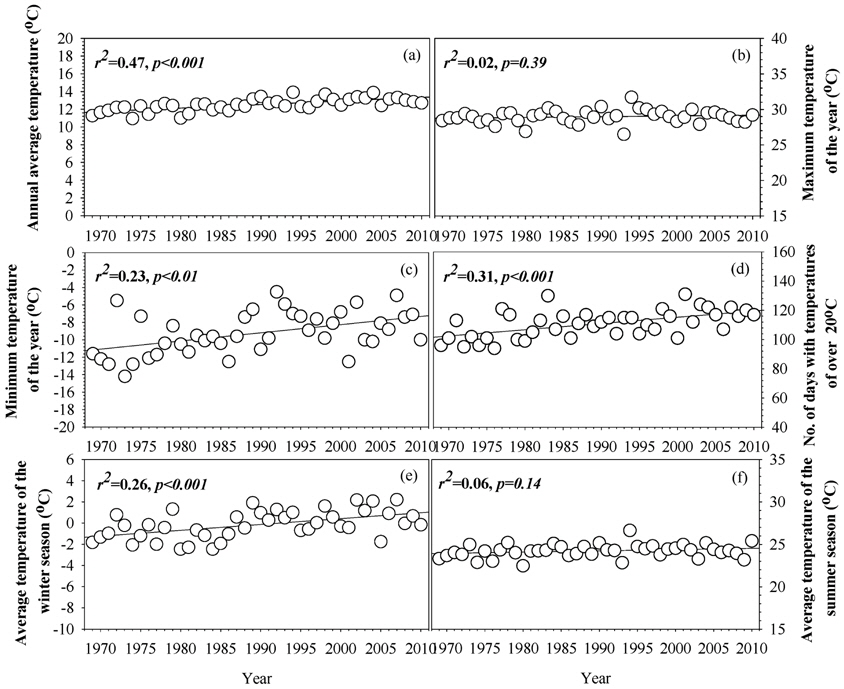
    대전, 충주, 청주 등 충청권의 주요 상수원인 대청호의 기후변화 현상을 확인하기 위해 1969년부터 2010년까지 대청호 유역(대전기상청)의 기온변화패턴을 조사한 결과, 연평균 기온은 10.9℃ ~ 13.9℃ 의 범위로 최저 연평균기온은 1974년, 최고 연평균기온은 1994년에 나타났으며, 시간이 지날수록 점차 증가하는 패턴을 보여주었다. 연중 최고 기온과 여름철 평균기온은 유의한 증가추세를 보이지 않은 반면, 연중 최저기온의 범위는 -14.2℃ (1973) ~ -4.5℃ (1992), 겨울철 평균기온은 -2.5℃ (1980) ~ 2.2℃ (2002, 2007)의 범위로 연중 최저기온과 겨울철 평균기온은 유의한 상승추세를 보여, 최근 들어 대청호 유역에서 겨울철 기온이 상승하고 있는 것으로 나타났다. 한편 여름철 평균기온의 변화는 크지않았으나 연중 20℃ 이상 일수는 2001년 131일로 최대치를 나타냈으며, 유의한 증가추세를 보여 고온 현상 기간이 연장되는 것으로 판단되었다(Fig. 2).

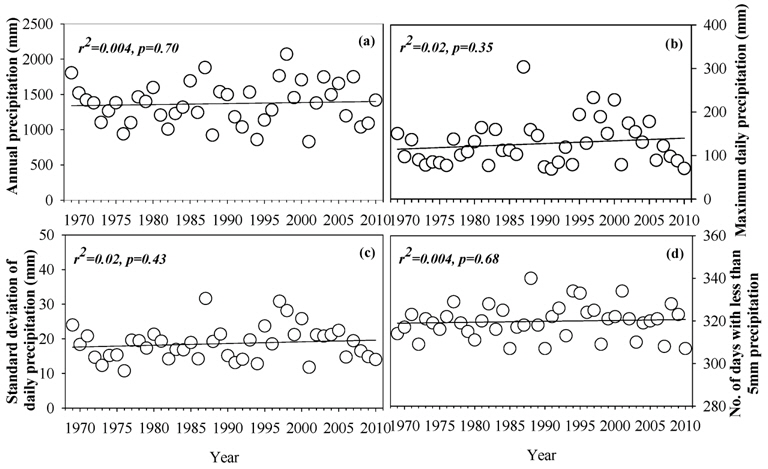
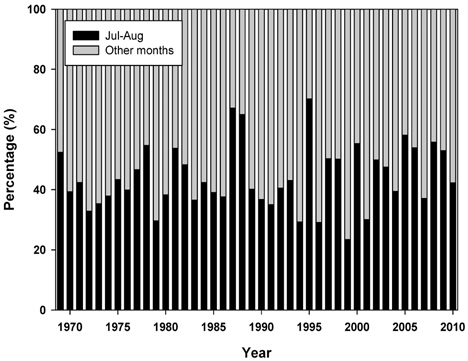
    1969년부터 2010년까지 대청호 유역의 연 강우량은 828.7mm로 2001년에 최저 강우량을, 2070.0 mm로 1998년 최고 강우량을 보여주었다. 5 mm 미만 강우일수는 307 ~ 340의 범위로 큰 차이를 보이지 않았으며 1998년 최대값을 보였다(Fig. 3). 대청호 유역에서 7월~ 8월 장마기간 동안 강우량은 1987년 1,261.9 mm (67.1%)로 최고 집중강우기를 보였으며 대부분 40% 이상의 높은 강우량을 나타내어 우리나라의 몬순 기후 특성을 보여주었다(An et al., 2001)(Fig. 4). Seasonal Mann-Kendall법을 이용한 시계열 추이 분석 결과 대청호 유역의 연강우량, 연중 일최대강우량, 연간일 강우량편차 및 5 mm 미만 강우일수 등은 모두 유의한 증감패턴을 보이지 않아 대청호 유역의 강우량 변화는 기후 변화에 따른 특정한 양상을 보이지 않는 것으로 나타났다.

       3.2. 대청호 유역의 수질 환경 요인

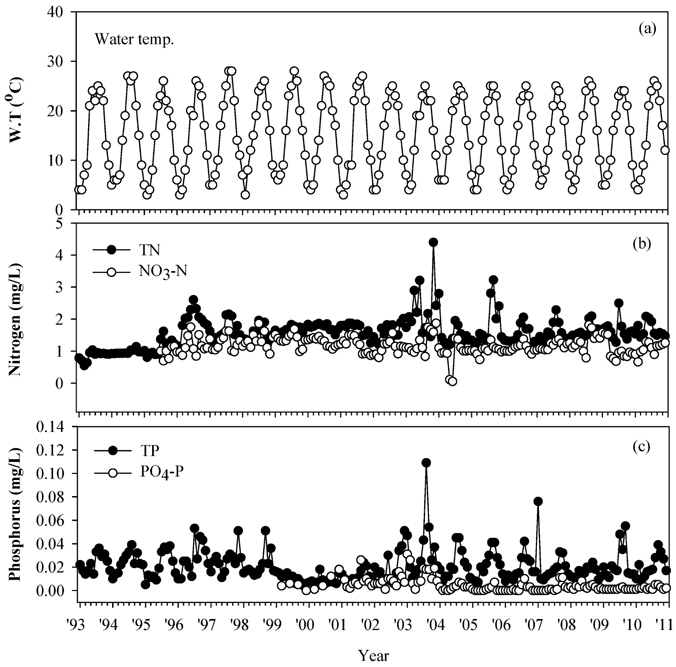
    1993년부터 2010년까지 대청호에서 조류 증식에 가장 직접적인 영향을 미치는 요인으로 판단되는 수온과 영양염류농도(총인, 인산염인, 총질소 질산염)의 장기변동을 조사한 결과, 수온은 3℃ ~ 28℃의 범위를 보였으며, 가장 낮은 수온인 3℃는 1995년, 1996년, 1998년, 2001년 2월에 나타났으며, 수온이 가장 고온인 시기는 1997년 8월, 9월과 1999년 8월에 나타났다. 대청호 유역의 수온은 매년 여름에 증가하고 겨울에 감소하는 전형적 온대성 기후의 특성으로 유사한 증감패턴을 보여주었다(Fig. 5).

    영양염류 중 총질소의 농도는 0.547 ~ 4.400 mg/ℓ의 범위를 나타냈으며 평균 1.584 mg/ℓ로 환경부에서 지정한 호소 생활환경 기준으로 “매우나쁨(VI)”에 해당하여 추동지점은 매우 부영양 상태임을 나타내었다(Oh and Kim, 1995; Park and An, 2012). 월별 변화 양상은 1993년 3월에 가장 낮은 총질소 농도를 보였고, 2003년 11월에 최고치의 총질소 농도를 보여 시기별 큰 차이를 보여주었다. 질산염은 0.052 mg/ℓ로 2004년 6월에 최저치를, 1.872 mg/ℓ로 2003년 12월에 최고의 질산염을 나타내었다(Fig. 5).

    총인과 인산염인의 농도는 각각 0.004 mg/ℓ ~ 0.109 mg/ℓ, 0.000 mg/ℓ ~ 0.031 mg/ℓ범위를 보여주었다. 총인 농도는 평균 0.021 mg/ℓ로 호소 생활환경 기준 평가 결과 “약간좋음(II)”으로 나타나(Fig. 5), 우리나라 인공호에서 대부분 나타나는 식물플랑크톤 성장에 영양염 인이 제한요인(limiting factor)으로 작용할 가능성을 시사하였다(Lee, Kim et al., 2010).

    인산염 계열의 영양염류는 2003년 8월에 가장 높게 나타났으며(0.109 mg/ℓ), 여름철 집중강우기에 크게 증가하는 패턴을 보여주어 주로 외부(강우 등)에서 유래되는 것으로 판단되었다(Joung et al., 2005)(Fig. 5).

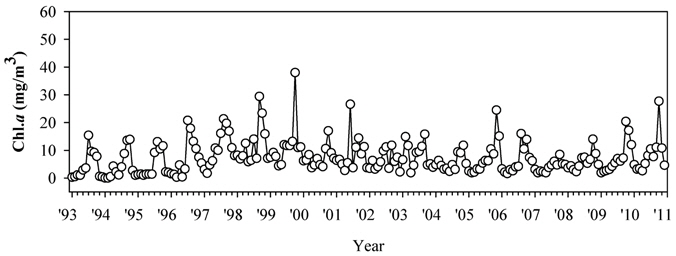
    대청호 추동지점에서 Chlorophyll-a 농도는 0.3 mg/m3 ~38.0 mg/m3의 범위로 평균 7.3 mg/m3를 보였으며, 겨울철에 가장 낮은 농도를, 1999년 10월에 가장 높은 Chlorophyll-a 농도를 나타내었다. 이처럼 Chlorophyll-a 농도는 겨울철에 낮고 여름철에 증가하는 패턴을 보여주었다(Fig. 6).

       3.3. 대청호 조류 발생 변화 분석

    2000년부터 2010년까지 대청호 추동지점의 조류예보제자료를 이용한 식물플랑크톤 현존량의 변화 패턴(3월~ 11월)은 2000년 7월에 177,748 cells/ml로 가장 많은 개체수를 보였으며, 2008년 4월에 61 cells/ml로 가장 적은 개체수를 보여주었다. 전반적으로 수온이 높은 여름철인 7월 ~ 9월에 높은 출현 개체수를 나타내었다(Shin et al., 1999)(Table 1).

    [Table 1.] Variation of monthly phytoplankton abundance from 2000 to 2010 in Chudong station of the Daechung reservoir

    label

    Variation of monthly phytoplankton abundance from 2000 to 2010 in Chudong station of the Daechung reservoir

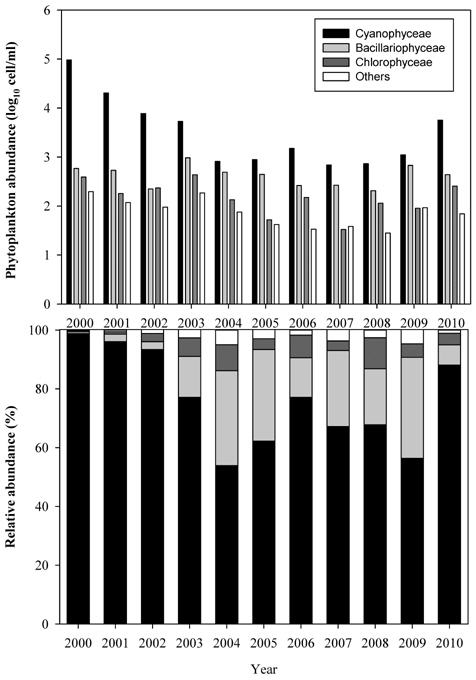
    대청호 추동지점의 분류군 별 식물플랑크톤 출현은 조사기간 동안(2000 ~ 2010) 남조류가 가장 높은 출현도를 보였으며 그 외 규조류, 녹조류, 기타조류 순으로 나타나 대청호 추동지점의 조류 발생은 규조류보다는 남조류의 현존량에 의존한다고 판단되었다(Oh et al., 1997). 대청호 추동지점은 지속적으로 남조류에 의한 녹조 현상이 일어나고 있으며(Jeong et al., 2011; Oh and Kim, 1995) 본 연구에서 도 동일하게 남조류의 출현 현상이 높게 나타났다(Fig. 7).

    대청호 추동지점에서 남조류는 2000년과 2001년에 매우 높은 출현을 보였으며(95% 이상), 그 후 점차 감소하다 2006년 이후에 증가하는 패턴을 나타내었다. 규조류의 변화 양상은 남조류와 상이한 증감 패턴을 보여주었다(Fig. 7).

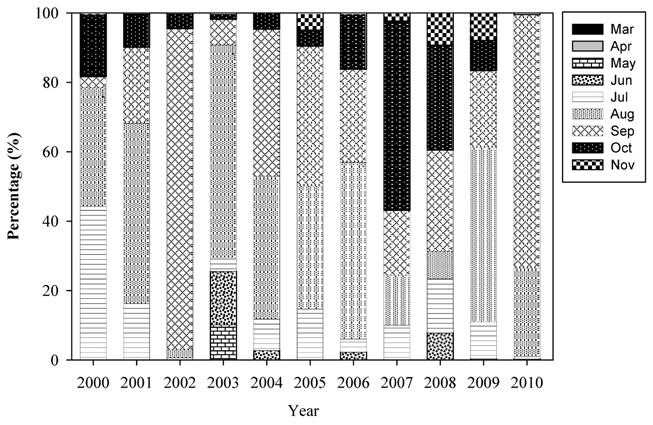
    본 연구인 대청호 추동지점에서 조사 시기 중 대부분의 계절에 높은 출현빈도를 보이는 분류군인 남조류의 월별 변화 양상을 분석한 결과, 2006년 이전에는 7월 ~ 8월에 높은 출현을 보여주었으며, 그 후 급감하였다(Park, 2005). 반면 2007년 이후 남조류의 출현 양상은 8월~ 10월에 높게 나타났으며, 특히 2008년(9.3%)과 2009년(7.9%)에는 11월까지도 남조류가 우점하여 남조류 출현 기간이 연장되었다(Fig. 8).

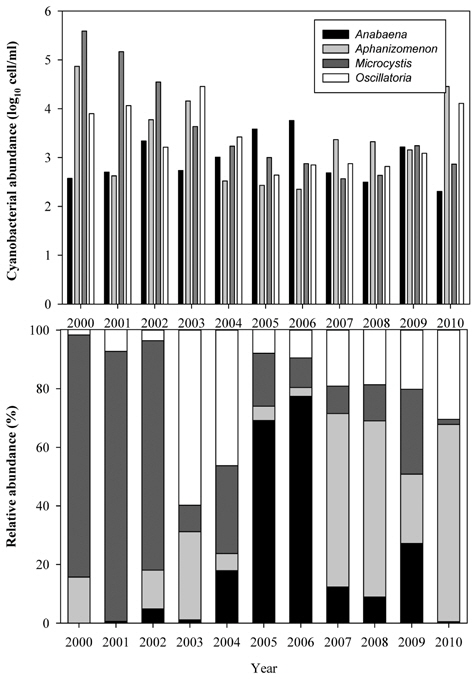
    일반적으로 남조류는 20℃ 이상의 고온에서 높은 성장을 보인다(Robarts and Zohary, 1987; Watanabe and Oishi, 1985). 본 연구에서도 겨울철 기온 상승 및 20℃ 이상 일수 증가에 의한 영향으로 수온이 증가되면서 남조류가 장기적으로 출현하는 양상을 보였다. 대청호 추동지점에서 남조류는 매년 Anabaena, Microcystis, Aphanizomenon, Oscillatoria 속이 높은 출현을 보였으며, 시기 별 출현 양상은 2002년까지는 구형 남조류인 Microcystis 속의 우점도가 다른 속에 비해 높았으며(75% 이상) 2005년 이후부터 선상남조류인 Anabaena, Aphanizomenon 등이 60% 이상 우점도를 보여주었다(Table 2)(Fig. 9). Joung et al. (2005)의 연구에서는 단기간의 조사이지만 구형인 Microcystis spp.의 우점에서 선상 남조류 Oscillatoria spp. 등의 우점으로 변화하였으며, Park (2005)의 연구에서도 Microcystis aeruginosa 소멸을 대신하여 Anabaena spp., Oscillatoria spp., Aphanizomenon flos-aquae가 높은 현존량을 보이는 것으로 조사되어 본 연구와 유사한 양상을 보여주었다.
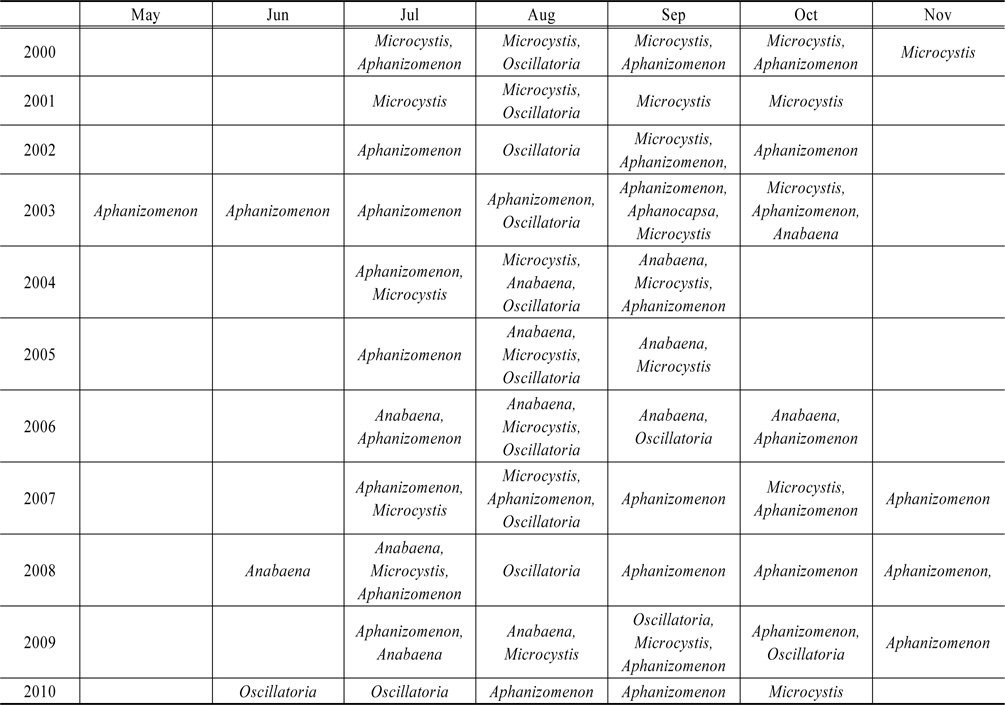
    [Table 2.] Dominant genus of monthly cyanobacteria from 2000 to 2010 in Chudong station of the Daechung reservoir

    label

    Dominant genus of monthly cyanobacteria from 2000 to 2010 in Chudong station of the Daechung reservoir

       3.4. 기후변화가 조류발생에 미치는 영향 분석

    대청호 추동지점에서 유해 남조류 발생에 영향을 미치는 기후, 환경인자 간의 상관성을 파악하고자 생물요인인 총 남조류 현종량, Anabaena, Microcystis, Aphanizomenon, Oscillatoria속의 현존량 및 환경요인인 기후변화, 물리・화학적 환경요인 간의 상관분석을 실시한 결과, 총 남조류 현존량은 PO4-P (r = 0.355, p<0.01)와 가장 높은 상관성을 보였으며 상대적으로 수온(r = 0.341, p<0.01)도 높은 상관성을 나타내었다. Anabaena, Microcystis, Oscillatoria 속의 현존량은 기온, 수온과 모두 유의한 상관관계를 보였다(p< 0.05) (Table 3). Lee et al. (2010)의 연구와 유사하게 본 연구에서도 남조류와 영양염류 간의 관계에서는 질산 계열(TN, DTN, NH4-N, NO3-N) 보다는 인산 계열(TP, DTP, PO4-P)과 유의한 상관성을 나타내었다(p<0.05). 상관분석 결과를 바탕으로 남조류의 변화에 어떠한 환경인자가 가장 영향을 미치는지를 분석하고자 선형회귀분석을 실시하였다. 선형회귀분석 결과, 수온(r = 0.604, p<0.001) 및 PO4-P (r = 0.282, p<0.01)와 가장 높은 유의성을 보여 대청호에서 남조류 발생은 수온과 제한영양염(PO4-P)에 가장 큰 영향을 받는 것으로 나타났다(Table 4). 이는 수온 상승, 이상 기후현상 지속화 및 제한영양염에 의해 유해 조류 대발생 및 유해 조류 출현의 장기화 현상을 시사하는 것으로 판단된다.

    [Table 3.] Correlation coefficient between cyanobacteria abundance and physicochemical factors from 2000 to 2010 in Chudong station of the Daechung reservoir

    label

    Correlation coefficient between cyanobacteria abundance and physicochemical factors from 2000 to 2010 in Chudong station of the Daechung reservoir

    [Table 4.] Linear regression model between cyanobacteria abundance and physicochemical factors from 2000 to 2010 in Chudong station of the Daechung reservoir

    label

    Linear regression model between cyanobacteria abundance and physicochemical factors from 2000 to 2010 in Chudong station of the Daechung reservoir

    4. Conclusion

    금강 수계 대청호 추동지점을 대상으로 기후 및 환경요인의 장기 변동을 파악하고 장기 남조류 발생 패턴을 분석하여 이들 기후 및 환경 요인이 남조류 발생에 미치는 영향력을 분석하고자 하였으며, 다음과 같은 결과를 도출하였다.

    1)1969년부터 2010년까지 대청호 유역의 연평균 기온은 10.9℃ (1974) ~ 13.9℃ (1994)의 범위로 점차적으로 평균기온이 증가하는 패턴을 보여주었으며 연중 20℃ 이상 일수, 연중 최저 기온 및 겨울철 평균기온도 유의한 상승 추세를 보여 대청호 유역의 겨울철 기온은 점차 상승하고 있는 것으로 나타났다. 2) 1993년부터 2010년까지 대청호 추동지점의 수질 환경요인 중 수온 변화 패턴은 여름철에 증가하고 겨울철에 감소하는 전형적인 온대성 기후의 특성을 나타내었다. 3) 영양염류 중 인산염 계열의 영양염류는 주로 여름철에 증가하는 양상을 보여주었으며, 이들 영양염류의 장기적인 추세는 특정한 변화 패턴을 보이지 않았다. 4) 대청호 추동지점의 장기 식물플랑크톤 현존량 변화는 2000년 7월에 177,748 cells/ml로 가장 많은 개체수를 보였으며 전반적으로 여름철에 높은 출현 개체수를 나타내었다. 분류군별로는 모든 해에 남조류가 50% 이상으로 대청호 추동지점의 조류 발생은 남조류에 기인하는 것으로 판단되었다. 5) 월별 남조류 출현 양상은 2006년 이전은 7월 ~ 9월에 높은 출현을 보인 반면 2007년 이후 7월부터 11월까지도 남조류의 높은 출현을 나타내어 남조류 출현 기간이 길어지는 양상을 보여주었다. 6) 우점종은 2002년까지 구형 남조류인 Microcystis 속이었으나 2005년부터 선상남조류인 Anabaena, Aphanizomenon등으로 변화되었다. 7) 대청호 추동 지점의 남조류는 수온과 제한영양염(PO4-P)에 가장 큰 영향을 받는 것으로 나타나 기후변화에 의한 수온상승은 남조류의 출현 장기화 현상을 시사하였다.

참고문헌
  • 1. An K. G., Seo J. W., Park S. S. 2001 Influences of Seasonal Rainfall on Physical, Chemical and Biological Conditions near the Intake Tower of Taechung reservoir [Korean Journal of Limnology] Vol.34 P.327-336 google
  • 2. Bates B. C., Kundzewicz Z. W., Wu S., Palutikof J. P. 2008 Climate Change and Water P.55-75 google
  • 3. Blenckner T., Pettersson K., Padisak J. 2002 Lake Plankton as Tracer to Discover Climate Signals [Verhandlungen Internationale Vereinigung Limnologie] Vol.28 P.1324-1327 google
  • 4. Cho W. H., Yum K. T., Kim J. S., Ban Y. J., Chung S. W. 2012 Study on Algae Occerrence in Daecheong Reservoir [Journal of Environmental Impact Assessment] Vol.21 P.367-380 google
  • 5. 2000 The Investigation of Drinking Water Quality in Keum River Watershed P.42-54 google
  • 6. 2001 The Investigation of Drinking Water Quality in Keum River Watershed, GPRN. 11-1480141-000003-10 P.127-137 google
  • 7. 2002 The Investigation of Drinking Water Quality in Keum River Watershed P.33-40 google
  • 8. 2003 The Investigation of Drinking Water Quality in Keum River Watershed P.52-60 google
  • 9. 2004 The Investigation of Drinking Water Quality in Keum River Watershed P.49-58 google
  • 10. Jeong D. H., Lee J. J., Kim K. Y., Lee D. H., Hong S. H., Yoon J. H., Hong S. Y., Lim T. S. 2011 A study on the management and improvement of alert system according to algal bloom in the Daecheong Reservoir [Journal of Environmental Impact Assessment] Vol.20 P.915-925 google
  • 11. Joung S. H., Ahn C. Y., Choi A. R., Jang K. Y., Oh H. M. 2005 Relation between Rainfall and Phytoplankton Community in Daechung Reservoir [Korean Journal of Environmental Biology] Vol.23 P.57-63 google
  • 12. Kim H. S, Moon C. W. 2000 Diurnal Changes of Vertical Distribution of Microctstis aeruginosa during the Water Bloom in Kongsan Reservoir [Korean Journal of Limnology] Vol.33 P.119-127 google
  • 13. Kim J. E., Park J. W., Jo K. A., Kim S. K. 2013 Variances of Environmental Factors during Water Bloom by Microcystis aeruginosa (Kutzing) Kutzing in llwol Reservoir, Suwon [Korean Journal of Limnology] Vol.46 P.265-275 google
  • 14. Lee J. A., Lee J. J., Jung J. W., Park H. K., Kim Y. J., Yoo K. A., Lee H. J., Kwon Y. H., Hwang D. J., Park J. H., Park S. J., Kim D. H., Jung J., Park J. J., Kim J. M. 2007 Report on Implementing the Algae Alert System 2006 P.141-179 google
  • 15. Lee J. A., Lee J. J., Lee M. N., Cheon S. U. 2009 Result of Implementing the Algae Alert System on the Daecheong Reservoir in 2009 P.120-140 google
  • 16. Lee J. J., Lee J. A., Cheon S. U. 2010 Temporal and Spatial Phytoplankton Development in the Daecheong Reservoir [Proceeding of the 2010 Spring Co-Conference of the Korean Society on Water Environment and Korean Society of Water and Wastewater] P.603-604 google
  • 17. Lee J. M., Lee J. J., Park J. G., Lee J. H., Chang C. Y., Yoon S. M. 2005 Zooplankton Fauna and the Interrelationship Among Cladoceran Populations and Microcystis aeruginosa (Cyanophyceae) during the Cyanobacterial Blooming Season at Daecheong Lake, South Korea [Korean Journal of Ecology and Environment] Vol.38 P.146-159 google
  • 18. Lee J. W., Kim J. Y., Hyun K. S. 2010 Characteristics and Correlation of Influence Factors for Eutrophication in Daecheong Lake [Korean Society of Water Science and Technology] Vol.18 P.39-46 google
  • 19. Lee K. L., Jheong W. H., Kim J. H., Kim H. S. 2010 Effects of the Temperature and Light Intensity on the Growth and Microcystin Prodection of Three Species of Microcystis (M. aeruginosa, M. ichthyoblabe, M. viridis) [Korean Journal of Limnology] Vol.43 P.400-408 google
  • 20. Lee O. H., Cho K. J. 2006 Nitrogen and Phosphorus Uptake and Growth Kinetics of Microcystis aeruginosa Cultured under Chemostats [Korean Journal of Ecology and Environment] Vol.39 P.119-130 google
  • 21. Li Z., Yu J., Yang M., Zhang J., Burch M. D., Han W. 2010 Cyanobacterial Population and Harmful Metabolites Dynamics during a Bloom in Yanghe Reservoir, North China [Harmful algae] Vol.9 P.481-488 google
  • 22. Liu X., Lu X., Chen Y. 2011 The Effects of Temperature and Nutrient Rations on Microcystis Blooms in Lake Taihu, China: An 11-year Investigation [Harmful algae] Vol.10 P.337-343 google
  • 23. 2006 National Water Resources Management Integrated Information System (NWRMIIS) google
  • 24. Oh H. M., Kim D. H. 1995 Short-term Prediction of the Blue-green Algal Bloom in Daechung Reservoir [Korean Journal of Limnology] Vol.28 P.127-135 google
  • 25. Oh H. M., Park J. H., Yun M. W., Maeng J. S. 1997 Relation between Phosphorus Concentration and Distribution of Polyphosphate in Cyanobacteria at Water Bloom in Daechung Reservoir [Korean Journal of Limnology] Vol.30 P.97-106 google
  • 26. Park H. K., Kim J. Y., Lee J. A., Lee J. J., Yoon J. S., Lee H. J., Hwang D. J., Kwon Y. H., Park J. H., Han Y. W., Lee J. B., Jung J., Choi Y. S., Kim J. H., Kim J. S. 2008 Report on Implementing the Algae Alert System 2008 P.129-175 google
  • 27. Park H. K., Lee H. J., Kim Y. J., Lee J. A., Lee J. J., Jung J. W., Seo J. K., Lee H. J., Kwon Y. H., Park J. H., Na K. B., Jung J. 2006 Report on Implementing the Algae Alert System 2005 P.129-165 google
  • 28. Park H. K, Yoo K. A, Park S. J, Lee J. A, Lee J. J, Jung J. W, Lee H. J, Yoon J. S, Kwon Y. H, Hwang D. J, Park J. H, Han Y. U, Kim S. D, Jung J, Park J. J, Kim J. M, Hyun C. L, Lee C. K, Kim B. S, Kim J. Y, Lee Y, Han J. H, Cho U. H. 2007 Report on Implementing the Algae Alert System 2007 P.151-196 google
  • 29. Park H. M., An K. G. 2012 Long-term Water Quality Fluctuations in Daechung Reservoir and the Limiting Nutrient Evaluations using In Situ Enclosure Nutrient Enrichment Bioassays (NEBs) [Journal of Korean Society on Water Environment] Vol.28 P.551-560 google
  • 30. Park J. G. 2005 Developmental Characteristic of Cyanobacterial Bloom in Lake Daecheong [Korean Journal Environment Biology] Vol.23 P.304-314 google
  • 31. Robarts R. D., Zohary T. 1987 Temperature Effects on Photosynthetic Capacity, Respiration, and Growth Rates of Bloom-forming Cyanobacteria [New Zealand Journal of Marine and Freshwater Research] Vol.21 P.391-399 google
  • 32. Shin J. K., Joh G. J., Oh I. H. 1999 Environmental Factors and Phytoplankton in Taechong Reservoir [Korean Journal of Environmental Biology] Vol.17 P.529-541 google
  • 33. Watanabe M. F., Oishi S. 1985 Effects of Environmental Factors on Toxicity of a Cyanobacterium (Microcystis aeruginosa) under Culture Conditions [Applied and Environmental Microbiology] Vol.49 P.1342-1344 google
  • 34. Wu W., Li G., Li D., Liu Y. 2010 Temperature may be the Dominating Factor on the Alternant Succession of Aphanizomenon flos-aquae and Microcystis aeruginosa in Dianchi lake [Fresenius Environmental Bulletin] Vol.19 P.846-853 google
  • 35. You K. A., Byeon M. S., Youn S. J., Hwang S. J., Rhew D. H. 2013 Growth Characteristics of Blue-green Algae (Anabaena spiroides) Causing Tastes and Odors in the North-Han River, Korea [Korean Journal of Ecology and Environment] Vol.46 P.135-144 google cross ref
이미지 / 테이블
  • [ Fig. 1. ]  Map showing the sampling station in Daechung reservoir.
    Map showing the sampling station in Daechung reservoir.
  • [ Fig. 2. ]  Change of Annual average temperature (a), Maximum temperature of the year (b), Minimum temperature of the year (c), Number of days with temperatures of over 20℃ (d), Average temperature of the winter season (e) and Average temperature of the summer season (f) from 1969 to 2010 in Daechung reservoir.
    Change of Annual average temperature (a), Maximum temperature of the year (b), Minimum temperature of the year (c), Number of days with temperatures of over 20℃ (d), Average temperature of the winter season (e) and Average temperature of the summer season (f) from 1969 to 2010 in Daechung reservoir.
  • [ Fig. 3. ]  Change of Annual precipitation (a), Maximum daily precipitation (b), Standard deviation of daily precipitation (c), Number of days with less than 5 mm precipitation (d) from 1969 to 2010 in Daechung reservoir.
    Change of Annual precipitation (a), Maximum daily precipitation (b), Standard deviation of daily precipitation (c), Number of days with less than 5 mm precipitation (d) from 1969 to 2010 in Daechung reservoir.
  • [ Fig. 4. ]  Total annual precipitation from 1969 to 2010 in Daechung reservoir.
    Total annual precipitation from 1969 to 2010 in Daechung reservoir.
  • [ Fig. 5. ]  Change of Water temperature (a), Nitrogen concentration (b), Phosphorus concentration (c) from 1993 to 2010 in Chudong station of the Daechung reservoir.
    Change of Water temperature (a), Nitrogen concentration (b), Phosphorus concentration (c) from 1993 to 2010 in Chudong station of the Daechung reservoir.
  • [ Fig. 6. ]  Change of Chlorophyll a from 1993 to 2010 in Chudong station of the Daechung reservoir.
    Change of Chlorophyll a from 1993 to 2010 in Chudong station of the Daechung reservoir.
  • [ Table 1. ]  Variation of monthly phytoplankton abundance from 2000 to 2010 in Chudong station of the Daechung reservoir
    Variation of monthly phytoplankton abundance from 2000 to 2010 in Chudong station of the Daechung reservoir
  • [ Fig. 7. ]  Variation of phytoplankton community (top) and percentage of relative abundance (bottom) from 2000 to 2010 in Chudong station of the Daechung reservoir.
    Variation of phytoplankton community (top) and percentage of relative abundance (bottom) from 2000 to 2010 in Chudong station of the Daechung reservoir.
  • [ Fig. 8. ]  Percentage of monthly cyanobacteria abundance from 2000 to 2010 in Chudong station of the Daechung reservoir.
    Percentage of monthly cyanobacteria abundance from 2000 to 2010 in Chudong station of the Daechung reservoir.
  • [ Table 2. ]  Dominant genus of monthly cyanobacteria from 2000 to 2010 in Chudong station of the Daechung reservoir
    Dominant genus of monthly cyanobacteria from 2000 to 2010 in Chudong station of the Daechung reservoir
  • [ Fig. 9. ]  Variation of cyanobacteria genus (top) and percentage of relative abundance (bottom) from 2000 to 2010 in Chudong station of the Daechung reservoir.
    Variation of cyanobacteria genus (top) and percentage of relative abundance (bottom) from 2000 to 2010 in Chudong station of the Daechung reservoir.
  • [ Table 3. ]  Correlation coefficient between cyanobacteria abundance and physicochemical factors from 2000 to 2010 in Chudong station of the Daechung reservoir
    Correlation coefficient between cyanobacteria abundance and physicochemical factors from 2000 to 2010 in Chudong station of the Daechung reservoir
  • [ Table 4. ]  Linear regression model between cyanobacteria abundance and physicochemical factors from 2000 to 2010 in Chudong station of the Daechung reservoir
    Linear regression model between cyanobacteria abundance and physicochemical factors from 2000 to 2010 in Chudong station of the Daechung reservoir
(우)06579 서울시 서초구 반포대로 201(반포동)
Tel. 02-537-6389 | Fax. 02-590-0571 | 문의 : oak2014@korea.kr
Copyright(c) National Library of Korea. All rights reserved.