If we stand at the technology side, the value of technology firms would be recognized from two big streams, but an additional new stream brings confusion. One is the perspective of technology in which value comes from technological ability. The counterpart is the perspective from capital in which value should be recognized from earning ability. The new perspective is from the new international accounting standards of IFRS (International Financial Reporting Standards) which puts emphasis on quoted price from market, i.e., comparative value effective since 2013. The three big perspectives of value such as technological ability, earning ability and comparative value confuse technology side value analysts.
Then, how does the stock market valuate technology firms? Listing in stock market is the final goal for startups or for commercialization of technology. Therefore, all kinds of valuation before stock market should consider the valuation methods in the stock market. This study aims to analyze the valuation of technology firms in the stock market to answer how before-market entities should be valuated.
To support this purpose, we analyzed 230 market reports for technology firms in the KOSDAQ, the 2nd stock market of Korea originally established for technology firms. All these reports were disclosed in 2012 by professional analysts employed in various securities companies. Most reports estimated earnings or stock price after 6 months or 1 year. The 2012 reports are the latest in our analysis, since a forecast for 1 year in late 2012 is realized in late 2013.
This study defines technology firms as the companies in the manufacturing industry or in technology-based services such as the game industry and IT services. Here, startups are the early-stage technology firms defined by the Korean government and the Korea Exchange.
Although we add some valuations to show the effectiveness of the models used in the market, this study is basically an analysis of a survey of firm reports. The structure of this study is as follows: Section 2 presents a literature review and the valuation methods used in the market, and section 3 explains the methods and data. Section 4 analyzes the valuation methods used in the firm reports, and section 5 checks the effectiveness of each method of valuation. Section 6 contains a summary of this study and discussions related to theory and practice.
Ⅱ. Literature Review and Valuation Methods
The literature related to the valuation of technology firms may come from three aspects: analysts’ ability to forecast, valuation methods, and valuation of technology firms (Seol, Oh and Park, 2012). We, however, will put an emphasis on Korean studies rather than international studies, since we deal with market reports in the Korean stock market.
The first stream is the studies on analysts’ ability to estimate earnings (Mikhail et al., 1997; Clement, 1999; Jacob et al., 1999) or their influence on stock price (Brav and Lehavy, 2003; Bradshaw and Brown, 2006). Unlike international studies, Korean studies, usually in the same study, generally deal with both the ability to forecast earnings and the ability to influence the stock price. Ahn, Shin and Jang (2005) reported that the more famous an analyst, the less their error ratio, which in turn allows more analyses, which further decreases their error ratio. Kim, Jeon and Lee (2011) analyzed the consistency of forecasting ability of analysts through the analysis of market reports on listed companies during 2002-2007. Their findings show that analysts are optimistic and that only 37% of their forecasts hit their target price. In addition, analysts who were more correct had consistency in forecasting ability. However, experience of analysts was not related to the consistency of forecasting.
As for specific industries, Hong and Hwang (2012) analyzed the accuracy of analysts in the aircraft industry. Baek (2003) analyzed the difference in determinants of stock price between information and communication industry (ICT) and non-ICT manufacturing firms, and reported that R&D and advertising expenditure positively affects stock price. Kim, Eom and Seok (2011) analyzed the accuracy of analysts for high-tech and low-tech industries under the definition that an industry with more than 1% R&D expenditure is considered a high-tech industry. They found no difference between the two groups during 2004-2006.
The second stream is the studies on comparative methods or multiples which are the most popular method in the stock market. Kang, Yu and Moon (2012) analyzed 1,310 firms in the stock market during 2004-2009 to check the accuracy of several variables used for multiples. They found book value is the best, followed by operating cash flow, net profit, operating profit and sales revenue. Oh and Kim (2011) tested the accuracy of the comparison method defined by the Inheritance and Gift Tax Act. They found that PER multiples overestimated more than PBR multiples. Lee and Choi (2002) found the limits of PER and PBR multiples analyzing the stock market data during 1996-2001 and suggested a knowledge asset valuation method. Fernandez (2001) surveyed the European usage of valuation methods and found that the frequency order is PER multiples followed by EV/EBITDA multiples, and the excess earning model.
The third stream is the studies on the valuation of technology or venture firms in the stock market. Kim, Lee and Kim (2000) checked the effectiveness between the discounted cash flow (DCF) method and the Black-Scholes (BS) model analyzing 77 venture firms in the KOSDAQ. They found the BS model was more effective than the DCF model. Kim, Jeong and Kim (2004) also found the same result from the analysis of KOSDAQ venture firms. Yun and Lee (2004) used the BS model to analyze venture firms of KOSDAQ. The recent study of Lee and Jeong (2011) also used the BS model for the valuation of photovoltaic material technology of a KOSDAQ company using the generalized method of moments for the probability process of basic assets. Ju (2011) used Luehrman’s (1998) modified BS model to analyze 48 firms in the KOSDAQ classifying advanced technology firms and general startups. They found the BS model as stable in identifying trends and reliable in estimating market price. Lee and Oh (2004) changed the option model of abandonment of Byrgstahler and Dichev (1997) in various types and checked the effectiveness of those models in KOSDAQ firms. Seol and Yoo (2002) suggested various types of the real options model.
The commonly used methods in the market are the market approach, simply called comparison method or multiples method. Market approach is a method that measures the value of the subject company in comparison with comparable companies. The common comparative indicators are price earnings ratio (PER), price book ratio (PBR), and price sales ratio (PSR) etc.
However, the market often applies a method specified in the law to measure merger and acquisition value, which is based on PER. Article 7 (relative value) of the Detailed Regulations for Regulation on Issuance, Public Disclosure, etc. of Securities (July 2014) lays out the methods to select a similar comparable company and to calculate the comparative value.
Comparable companies are defined as the “minimum three listed companies in the same 3-digit industry of the industry classification system of the Korea Stock Exchange, whose major products are similar to those of the subject company, and whose year-end continuing earnings before tax per share and net asset per share are in the 30% range with the subject company”. And this method is the same as is specified in the Inheritance and Gift Tax Act. And relative value is defined as the minimum 30% off from the average of the comparative values of similar companies calculated as below. Continuing earnings before tax per share is the average for the last two years. The value of the subject company is calculated by this equation.
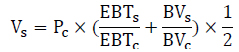
Vs=Value of the subject company Pc=Price of comparable companies EBTs=Earnings before tax of the subject BVs=Book value of the subject
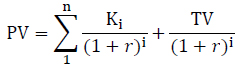
Unlike in the stock market, the discounted cash flow method was the most popular for valuation of technology or technology firms until the disclosure of IFRS 13, the fair value measurement, which emphasizes market data resulting in the comparison method. The method measures present value by discounting cash flows for each future year along with the terminal value (TV).

Ki=cash flow of year i 𝑟=discounts rate
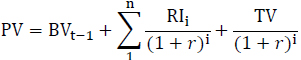
On the other hand, the residual income method by Ohlson (1995) is a frequently used valuation method for firms as it minimizes subjective judgment. Firm value in the residual income method represents the combination of equity capital, referring to the invested money, and the income that exceeds the future cost of capital, that is, the residual income. Since residual income is obtained only for the forecast period in actual calculation, the terminal value after the forecast period should be included. Residual income (RI) is the earnings which represents the excess of return on equity (ROE) over cost of equity (COE). In 2012, Woori Investment and Securities, a securities company, employed the model as its basic valuation model.
PV=(Equity capital)t−1×(ROEt−1−COEt−1)

RI =current net incomet−equity capitalt−1×COEt COE=risk free rate+ β×market risk premium
The method is frequently used, but a lot of empirical studies find it has limited use, since it is grounded on the assumption that the accounting book has no biases (Liu and Ohlson, 2000; Callen and Segal, 2005).
Stock market has traditionally put great emphasis on relative value. And previous studies by Fernandez (2001), Lee and Choi (2002), and Yoo and Moon (2012) pointed out that the stock market performs valuation by using multiples obtained from relative value. Therefore, even for technology firms, the method would be frequently used for valuation. From this, we set the following hypotheses.
H1 Market approach that performs relative valuation is the most popular method in the stock market, even for technology firms.
Meanwhile, a multitude of variables are used in calculating relative value: book value, cash flow, net income, operating profit and sales revenue. Kang, Yoo and Moon (2012) pointed out that multiples grounded on book value and cash flow show the greatest accuracy. However, by reflecting on the perspective of capital that lays great emphasis on net income, we establish the following hypothesis.
H2 Stock market, even for technology firms, lays the greatest emphasis on net income for valuation among all other indicators.
If multiples method is the most frequently used in the stock market, we can assume it is the most accurate one, so it is widely used. Therefore, we hypothesize that relative valuation is the most accurate method.
H3 Multiples method is the most accurate method, for valuing technology firms in the stock market.
Technology firms characteristically depend more on technological capability than on their overall managerial assets. Tech firms can have a lot of intangible assets as found in Lee and Choi (2002).
H4 Stock price forecasting is less accurate in industries having more intangible assets such as IT and bio than the industry with more tangible assets such as machinery, materials and electronics.
The Korea Exchange classifies firms into startups, mid-companies and general companies. The startups here are early-stage technology firms. However, the term early-stage or early-stage technology firms has several meanings such as just startups, young technology firms in age, and young technology firms in the age of listing. It may be difficult to estimate the stock price of these kinds of companies, since their business are not yet stabilized. Therefore, we can set these hypotheses:
H5 Startups classified by the Korean Exchange, show lower accuracy in stock price forecasting than mid-sized or general companies.
H5-1 The younger a company, the lower accuracy is in stock price forecasting.
H5-2 The younger a company is in listed age, the lower accuracy is in stock price forecasting.
Stock price reflects the operation of each company. Therefore, we may think that the low price of technology firms means the low level of stability of operation. The low level of stability makes stock prices vulnerable; in turn it makes estimation accuracy lower.
H6 Higher the price of technology firms, the more accuracy there is in the forecast of stock price.
The analytical methods are two types according to the hypotheses. The method for Hypothesis 1 and 2 are simple, showing the refined and analyzed data. However, the methods for other hypotheses are complex and are as follows: First, we classified the reports by groups. Second, we define the concept of accuracy of forecasting. Third, the hypotheses were tested through the F-test for the differences by groups. But in case the results by F-test are doubted, t-test was added. Fourth, if statistical tests were satisfied, that meant differences by group existed, where after we checked the real figures to see if they support our hypotheses.
The analytical methods are two types according to the hypotheses. The method for Hypothesis 1 and 2 are simple, showing the refined and analyzed data. However, the methods for other hypotheses are complex and are as follows: First, we classified the reports by groups. Second, we define the concept of accuracy of forecasting. Third, the hypotheses were tested through the F-test for the differences by groups. But in case the results by F-test are doubted, t-test was added. Fourth, if statistical tests were satisfied, that meant differences by group existed, where after we checked the real figures to see if they support our hypotheses.
Thus, this study defines the accuracy of forecasting into the following three types: 1) Whether actual price reaches or exceeds the forecast price even once. 2) Whether the difference between actual price and target price is within 10% at the end of forecasting period. 3) And the error ratio between the 1-month-average actual price at the end of forecasting period and the target price.
Regarding the test of accuracy, we accept each hypothesis if at least two of the three definitions are satisfied. That means accuracy is rejected even if 1 of 3 definitions is statistically significant.
We used the market reports of KOSDAQ companies by financial analysts who work for securities companies. Financial analysts created a total of 440 reports in 2012, of which 230 reports were selected.
In selecting these reports, besides the definition of technology firms, we added a different condition: 1 report for 1 company by 1 analyst. There are many cases where one analyst created several reports with the same valuation method on one single company. Here, a report was selected if there are other reports from other analysts on a similar date, although there are three exceptions. In three companies, two reports were selected because they were released with the time interval of more than six months along with several other analysts’ reports for comparison on a similar date.
The 230 reports were written by 118 first authors who worked for 33 securities companies. 91 of them released one or two reports, and 27 of them published more than three reports. There is a case where one analyst wrote eight reports.
A number of reports were released for the same company. Six companies had ten or more reports, and the largest number was 15. As 1 report from 1 analyst was selected, the maximum number of reports on one single company is 9.
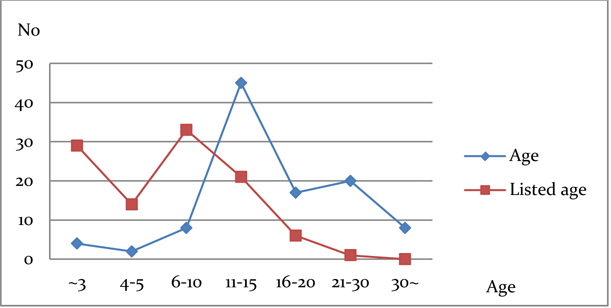
The 104 companies were 1 to 49 years old, averaging 16.9 years, and listing period ranged 1 to 18 years, averaging 7.4 years. The distribution is as shown on Figure 1. The largest groups in age were 11 to 15 years old and 93% of the companies had the listed age of 15 years or less
Ⅳ. Analysis of Valuation Methods
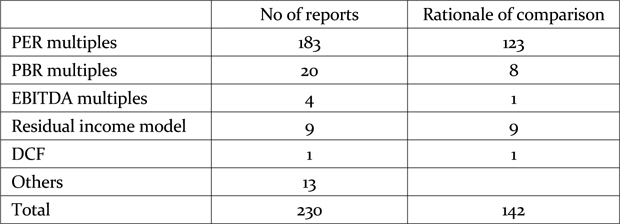
As shown in Table 1, 217 of all the 230 reports have a clear method. Among them, 207 (95%) adopted one of three representative multiples methods such as PER multiples (183), PBR multiples (20), and EBITDA multiples (4). This fact leads us to accept hypothesis 1, that the valuation of technology firms in the stock market use relative value drawn from other stocks' value.
[Table 1] Distribution of methods
Distribution of methods
Hypothesis 2 states that the stock market, even for technology firms, lays the greatest emphasis on net income for valuation among all other indicators. The table shows that income-based methods were PER multiples and EBITDA multiples of 81%. If residual income valuation and discounted cash flow method are added here, the ratio becomes 88%. Thus, we can say that Hypothesis 2 is sufficiently satisfied.
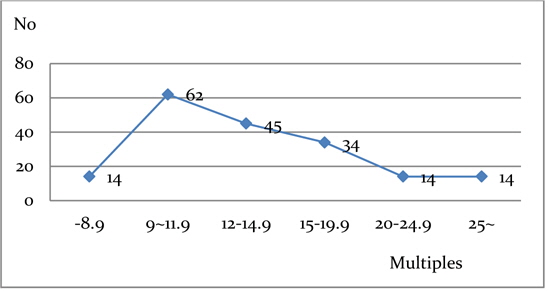
The distribution of PER multiples adopted in 183 reports is as seen in Figure 2. The average for all the 183 companies was 15.0. The range of multiples of 9 to below 12 was 62 followed by the range of 12-15. The lowest multiple was 6.9, while the highest was 82.3. 21 companies had multiples with 20 or higher, while 4 companies had multiples of 30 or higher. One company in the medical equipment industry had the highest PER multiples of 82.3, 52, and 43, while a BT company had 53 and 40.8. Meanwhile, one company in the game industry registered 35.9 and a pharmaceutical company showed 31.
PBR multiples applied to 20 companies: 12 reports have multiples of 2-3, 5 companies at 2 or less, and 3 companies exceeding 3. The average for PBR multiples was 2.27. EBITDA multiples were used in 4 reports; 3 reports had multiples of 4-5 and 1 report had 7.1.
Forecasting period to draw the cash flow is as follows: 121 reports forecasting 2 years, 84 reports forecasting 3 years, 17 reports forecasting 1 year, and 4 reports forecasting 4 years. Here, it can be said that in the stock market, forecasting for cash flow is not applied over 4 years, but mainly 2-3 years.
In comparison, the average multiples from comparable companies were not directly used in all the cases. The discount and premium applied to the average was –30% to 38% in cross-sectional comparisons and –38% to 30% in time series comparisons. This means that the range of discount or premium to the multiples drawn from comparisons was –40% to 40%.
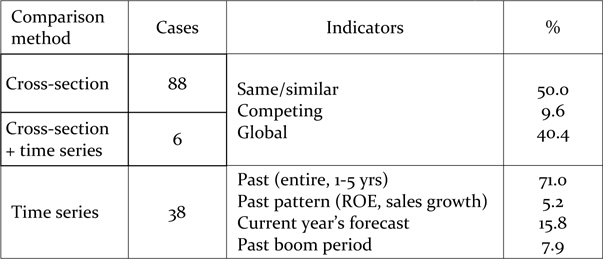
A total of 132 reports revealed the statistical evidence for the multiples used, of which 123 are PER multiples, 8 PBR multiples and 1 EBITDA multiples. A total of 88 reports applied cross-sectional comparisons, while 6 reports used mixed data from time series and cross-sectional data. Of these, 50% performed a comparison with competing businesses, while 50% conducted a comparison with broadly the same or similar businesses. Meanwhile, 38 reports used past or future data and 71% of time series data performed a comparison with data from a specific past period. 15.8% of other time series data were based on the current year’s forecast, since the forecasting was done during the year.
Another tool for comparison is the multiples bands. If we dot the size of multiples over time on the second dimension, many lines can be drawn according to the size of multiples of PER, PBR or EBITDA, representing a band. The band between maximum and minimum lines of multiples of PER, PBR or EBITDA is called PER band, PBR band or EBITDA band, respectively. This band shows historical trends of each multiple, which shows whether the stock price is overvalued or undervalued.
[Table 2] Revealed statistical rationale for multiples
Revealed statistical rationale for multiples
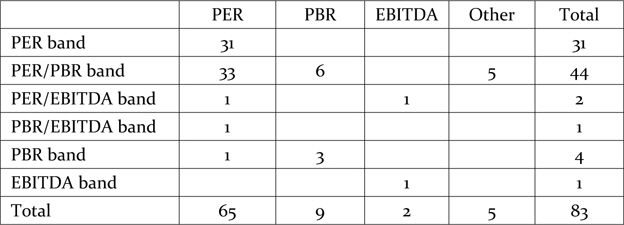
A total of 83 reports use multiples bands. Among them, 44 reports examined PER bands and PBR bands at the same time while 31 reports tapped into PER bands alone. Of 183 reports that applied PER multiples, 65 reports (35.5%) examined PER bands. Of those 20 reports that used PBR multiples, 9 reports (45%) used PBR bands. And 2 out of 4 reports used EBITDA bands.
[Table 3] Kinds of multiples after reviewing bands

Kinds of multiples after reviewing bands
Of a total of 230 reports, 10 reports valuated not by relative value, but by earning ability. Of the 10 reports, 9 used the residual income model, while 1 used the traditional discounted cash flow method.
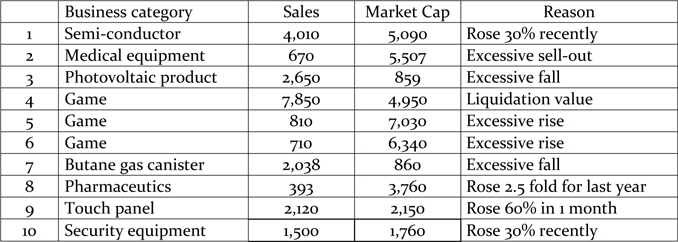
Table 4 summarizes the reasons for using other valuation methods other than general market reports. Among 9 reports that used the residual income method, 5 showed excessive rises, while 4 showed whether the excessive fall was correct. The last report on the table that used the discounted cash flow method was to assess whether the recent rise was excessive.
[Table 4] Reasons for using other valuation methods (100 mil. won)

Reasons for using other valuation methods (100 mil. won)
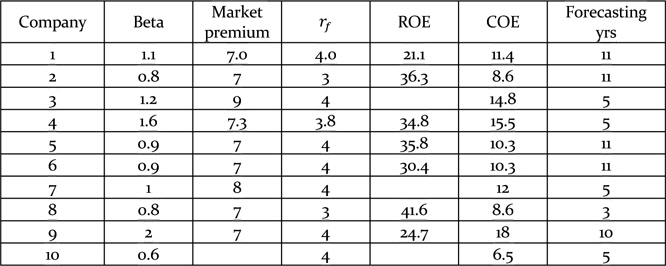
Among the variables used in the residual income method, beta indicates that the price fluctuation of a company against that for the entire stock market was 0.8 to 2, while it was larger than 1 for 5 reports and smaller than 1 for 4 reports. Risk free rate remained in the scope of 3 to 4%, and market premium between 7.0 and 9.0 with a mode of 7.0%. Cost of equity was 8.6 - 15.5%. On the other hand, return on equity was 21 - 41%.
[Table 5] Decomposition of other valuation methods

Decomposition of other valuation methods
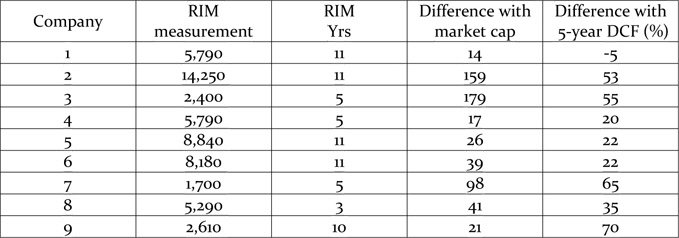
One most controversial variable is the forecasted earning period. The earning period assumed in the nine reports widely varies from 3 to 11 years. Although long estimation lessens terminal value and short estimation increases it, forecasting period puts big influence on value.
To check such issue, we measure the value of the same companies with 5-year forecasting through the discounted cash flow (DCF) method using the same variables as were used in the same reports. As shown in Table 6, 8 cases out of 9 showed overestimation from 20% to 70%. Even 3 reports having the same 5-year earning period overestimated 20% to 65%.
[Table 6] Examination of residual income method with alternatives (100 mil. won)
Examination of residual income method with alternatives (100 mil. won)
In the 1st definition of accuracy where actual price meets target price, accuracy was 18.8%. In the second definition where the difference between target and real price was within 10%, accuracy is 34.4%.
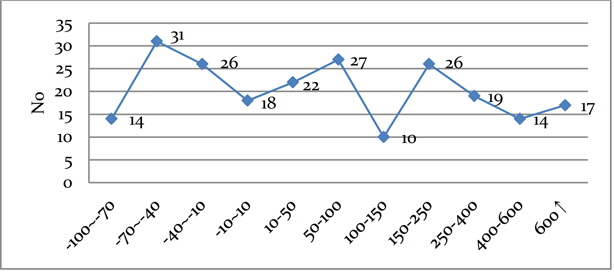
The third definition by error rate is shown in Figure 3. Error rate refers to gaps between target price and actual price which is defined as the 1-month average price at the end of the forecasting period. Error rate ranges very widely from –100% to 3,620%. An error rate of –100% means actual price becomes half of the target price. Also, an error rate of 3,620% means 36-fold overestimation. If we define within-10%-difference as an accurate value, only 18 (8%) of 224 forecasts are accurate. On the whole, 71 cases (31.7%) were underestimation, while 135 cases (60.3%) were overestimation. Average error rate for underestimation is 51% and that for overestimation is 283%, while the overall average error rate was 187%. It can be said that the degree of overestimation is greater than the degree of underestimation.
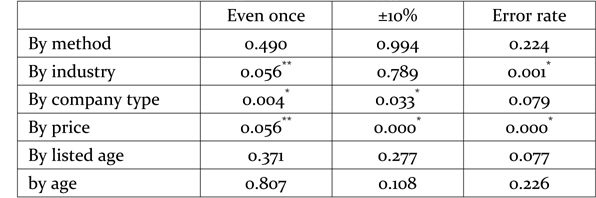
There are too many tables for accuracy test by groups, so we will show only some important tables. If the target price is exceeded even once, differences by groups are summarized as follows: • By industry, accuracy was 0-53%. The statistical significance by industry is 0.056. While the number is slightly above 5%, that much should prove the existence of differentiation by industry. This means accuracy differs by industry. • Business categories such as startups, mid-sized companies, and general companies register an accuracy of 9 to 28%. And the statistical significance is 0.004. This means accuracy differs by business categories: higher accuracy in general firms and lower accuracy in startups. • Methods such as PER multiples, PBR multiples, EBITDA multiples, and residual income method register an accuracy of 0 to 25%. But the significant probability is 0.490, so we reject the difference by methods. This means accuracy by methods is not different, which may be shocking to the theorists in this field. • Pricing, which is categorized into 10,000 won or less, 10,000 to 15,000 won, 15,000 to 20,000 won, 20,000 to 30,000 won, 30,000 to 50,000 won, and 50,000 won or more register an accuracy of 13 to 31%. Although the statistical significance by price group is 0.056, we accept the difference. This may be interpreted as forecasting for higher price groups have more accuracy and for lower price groups lower accuracy. • The statistical significance in listing period is 0.371 and that in age is 0.807, in both of which no difference between ages and listing period are found.
In case the difference between actual price and target price is within 10%, differences of accuracy by groups are summarized as follows: • The statistical significance by industry is 0.789. So, it can be said that there is no difference by industry in this definition. • The statistical significance by business types is 0.033. Yes, higher accuracy in general firms and lower accuracy in startups. • The statistical significance by method is 0.994. No difference by methods is found. • About pricing, it is 0.000. There are perfect differences between price ranges. Higher price, higher accuracy. • The statistical significance in listed age is 0.277 and that of age is 0.108, both of which are rejected.
The third definition of error rate has the following results: • The statistical significance of error rate by industry is 0.001. There is a clear difference by industry. • The statistical significance of error rate by business type is 0.079. There is no difference by business type. • The statistical significance of error rate by methods is 0.224. There are no differences by methods. • The statistical significance of error rate by different prices is 0.000. There are clear differences by different prices. • The statistical significance of error rate by listed year and age are respectively 0.077 and 0.226, which means no differences between age and listed time.
Accuracy tests under 3 definitions are presented in Table 7. This study defines accuracy as when two of the three criteria are satisfied.
[Table 7] Significance tests by groups
Significance tests by groups
Through variance analysis, difference is recognized only by industry, by company type, and by price. Hypothesis 3 states that relative value is the most accurate but it is rejected.
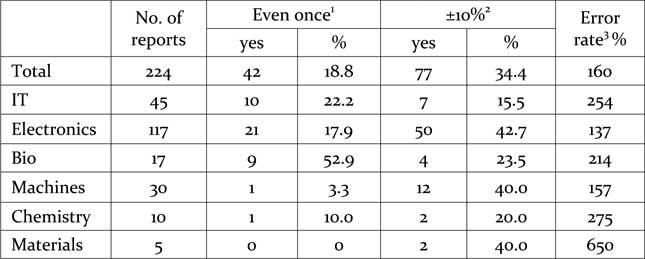
Accuracy of forecasting by industry is as shown in Table 8. Under the 1st and 3rd definition, accuracies are accepted by industry. Hypothesis 4 states that the accuracy of forecasting is lower in the industry having more intangible assets such as IT and bio industry as compared to manufacturing industries such as machines, materials and electronics.
[Table 8] Accuracy of forecasting by industry

Accuracy of forecasting by industry
When target price is exceeded even once, accuracy is between 0% and 53%, so differentiation seems clear. While error rate ranges from 137% to 650%, which represents overestimation on average. To be specific, industries such as electronics, machines, and materials register a lower ratio of overestimation, while chemistry, bio, and IT register a relatively high ratio of overestimation. To sum up, when target price is exceeded even once, accuracy is higher than average for bio and IT. On the other hand, in error rate, electronics and machines register a lower error rate. Under such circumstances, we do not accept hypothesis 4.
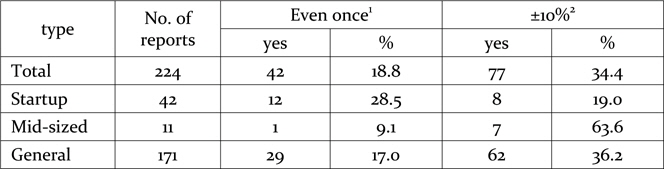
By company type, difference has been recognized only for the two criteria: "even once" and "within 10%". Hypothesis 5 states that startups show lower accuracy in stock price forecasting than mid-sized or general companies. In “even once” cases shown in Table 9, accuracy of startups are higher than mid-sized and general companies, although the hypothesis is confirmed in the case of “within 10%”. Accordingly, we reject this hypothesis. Thus, all the 3 hypotheses about age or size are rejected.
[Table 9] Accuracy of forecasting by company type
Accuracy of forecasting by company type
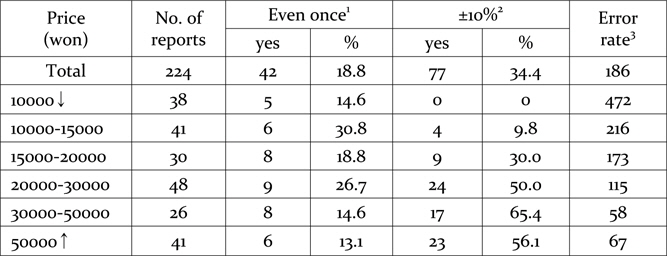
Hypothesis 6 states that a technology firm with a low price shows lower accuracy in stock price forecasting. As seen in Table 10, when target price is exceeded even once, the significant level by groups is slightly over 5%, but this quantity may be accepted. Accordingly, differences by groups are confirmed for all the criteria. However, let us look at the patterns of each definition. In “within 10%” case, accuracy rates increase along with the price level, and error rates decrease along with the price level. In conclusion, hypothesis 6 is accepted, although there is no clear pattern in the “within 10%” case. Higher the stock price, the more accurate is the forecast.

Accuracy by price
The test results for the hypotheses are summarized as follows:
H1 Market approach that performs relative valuation is the most popular method in the stock market, even for technology firms. - acceptH2 Stock market, even for technology firms, lays the greatest emphasis on net income for valuation among all other indicators. - acceptH3 Multiples method is the most accurate method for valuing technology firms in the stock market. - rejectH4 Stock price forecasting is less accurate in the industry having more intangible assets such as IT and bio than the industry with more tangible assets such as machinery, materials and electronics. - rejectH5 Startups classified by the Korean Exchange, show lower accuracy in stock price forecasting than mid-sized or general companies.- rejectH5-1 The younger a company, the lower accuracy is in stock price forecasting. - rejectH5-2 The younger a company is in listed age, the lower accuracy is in stock price forecasting. - rejectH6 Higher the price of technology firms, the more accuracy there is in forecast of stock price. - accept
Additional findings of this study are as follows: • Among 230 reports, 90% (207) used the 3 multiples methods, consisting of PER multiples of 80%, PBR multiples 8.7% and EBITDA multiples 1.7%. RIM was used in 9 cases, and traditional DCF was only used in 1 case. • Forecasting for cash flow is not applied over 4 years, but mainly 2-3 years. • The average of PER multiples is 15 with the range of 6.9 to 83. That of PBR multiples is 2.27. • The average amount from comparisons is not used directly. Rather discount and premium of -40 to 40% are used. • Among 207 multiples reports, 132 reports revealed the statistical rationale of multiples, and 83 reports used the tool of multiples bands. • The accuracy of forecasting was 18.8%, 34.4% and 8% according to the different definitions. This is quite low if we compare our findings to 37% in Kim, Jeon and Lee. (2011)
2. Implications and Conclusion
This study has a few implications for previous studies with respect to theory and practice. One is against Gleason et al. (2008) who argue that sophisticated models like the residual income method are superior to the multiples method. In addition, Kang, Yoo, and Moon (2012) suggested that multiples based on book value or operating cash flow are superior to net profit, operating profit, and sales, but our result differs from them. Oh and Kim (2011) pointed out that PER multiples overestimate more than PBR multiples. Also, our result differs with them. On the contrary, our study is similar to the study by Kim, Eom and Seok (2011) that finds no difference in accuracy of forecasting between high-tech firms and low-tech firms.
However, as seen in Oh and Kim (2012) and Oh (2013), the multiples specified in the supplementary valuation method of the Inheritance and Gift Tax Act is a method for tax valuation, and hence, a real market comparison should be avoided.
The market premium risks used in the 9 RIM models were 7-9, which is lower than the average of Korea of 6.3 announced by Fernandez, Linares and Acin (2014). This number may reflect the characteristics of technology firms. The risk of 88 countries in 2014 was 4.9% (Luxembourg) to 15.0% (Greece).
In practice, the most important implication of this study may be given to the technology side to those who believe that technological capability is the most important determinant of value. Unfortunately, technological capability is not counted in the stock market. Rather relative value based on earnings is the most important method in the stock market.
Although we adopt three definitions of accuracy to sophisticate the accuracy unlike other studies which use 1 or 2 definitions, the accuracy was 8-34.4%. Therefore, this study raises a more sophisticated definition for accuracy of forecasting, and adds to the issue of accuracy in valuation methods. We expect a new concept of definitions and methods to enhance the accuracy.
This study only covers 2012 KOSDAQ reports, because at the moment, it is the latest year available for analysis as late 2012 forecasts appeared in late 2013. If data is expanded to include more time series data, the results may reflect economic cycles.