We report high-speed pulse train generation from a relatively low-speed 10-GHz mode-locked laser by means of line-by-line spectral coding. To increase the pulse repetition rate multiplication (RRM) factor, we combine coding schemes for both spectral intensity and phase by placing a simple mask at the coder focal plane. The resulting RRM factor, determined by multiplying the RRM factors of the individual coding schemes, rises as high as 16. To verify the generated pulses, the optical spectra and autocorrelation traces are examined.
High-speed optical pulse sources are very attractive for high-speed optical time-division-multiplexing networks, microwave photonics, optical measurements, etc. To overcome the electrical bottleneck of an actively model-locked laser, various methods for optical repetition rate multiplication (RRM) of relatively low-speed pulse sources, such as rational harmonic mode locking [1], multipath pulse delay [2], and periodical spectral filtering [3], have been studied. Although those methods show distinct advantages, their relatively stringent requirements limit the uppermost values of the RRM factor. Recently, RRM based on a line-by-line spectral coding of individual spectral lines has been studied [4, 5]. By coding the intensities of individual spectral lines, we can implement any periodic spectral filter with arbitrary period or comb spacing, resulting in pulse RRM. One of the drawbacks of this method is high power loss due to removal of unwanted spectral lines, especially when the pulse speed (i.e., RRM factor) increases. To overcome the problem of high insertion loss, optical all-pass filtering based on phase control (or coding) of individual spectral lines was suggested [6, 7]. The quality of the output pulse trains is sensitive to the applied phase, requiring precise phase control, especially when the RRM factor increases; as a result, the reported RRM factor was less than 5. Recently, we reported a spectral intensity and/or phase coding for RRM of a 10-GHz mode-locked output [8]. In Ref. [8] we confirmed that the intensity coding induced a high insertion loss, and the phase coding required a precise phase control. As a compromise we suggested simultaneous coding of spectral intensity and phase, and showed some preliminary results. This Letter reports details and extensions of the preliminary results in Ref. [8]. The compromise scheme can provide reasonably low loss and high phase-error tolerance by choosing relatively low RRM factors for both intensity and phase coding. However, the resulting RRM factor of the combined scheme, given by multiplying both RRM factors, can be a considerably large number. Again, we use a similar lineby- line spectral coder based on simple, cost-effective masks and components for simultaneous intensity and phase coding. Changing the simple mask patterns, we obtain various high-speed pulse trains up to and including a frequency of 160 GHz from a 10-GHz mode-locked laser.
II. EXPERIMENTAL SETUP AND MASK PATTERNS
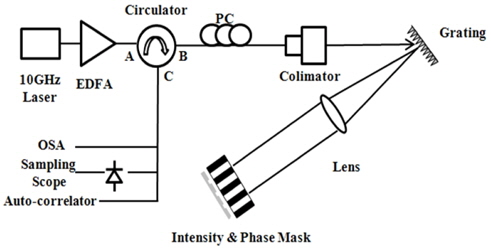
Figure 1 shows the schematic diagram of our line-by-line spectral coder, which is a typical fiber-coupled Fourier-transform pulse coder constructed in a reflective geometry [8,9]. A fiber-pigtailed collimator magnifies the input beam size to ~14 mm on the 1200 grooves/mm grating, to enhance the coder resolution. Discrete spectral comb lines of a 10-GHz mode-locked laser are diffracted by the grating and focused by the lens with a focal length of 40 mm. The incident and diffracted angles at the grating are 71° and 64° respectively. A polarization controller (PC) is used to adjust for horizontal polarization on the grating. At the focal plane, individual 10-GHz spectral lines are spaced by 88 μm, and show an image size of ~42 μm, ensuring a spectral resolution of ~5 GHz, which is high enough for coding/filtering of a spectral comb with 10-GHz spacing. An intensity mask is placed at the focal plane to pass or block the individual spectral lines. A retro-reflecting phase mirror leads to double-pass geometry; all of the spectral lines transmitted through the intensity mask are reflected and phase coded by an optical (phase) delay mirror. All of the reflected spectral lines are recombined into a single mode fiber and are separated from the input via an optical circulator. The total insertion loss from circulator input port A to output port C is about 7 dB. The 10-GHz laser is a commercially available mode-locked fiber laser (Calmar Optcom PSL-10-3TR) driven by a low-noise sinusoidal source (Anritsu 68047B). The output RRM signal is monitored by an optical spectrum analyzer (OSA; resolution bandwidth = 0.07 nm, video bandwidth = 1 kHz), a fast sampling scope (SS; bandwidth = 40 GHz), and an intensity autocorrelator (resolution = 1 ps).
For spectral (intensity) filtering, an intensity mask at the lens focal plane passes or blocks the individual spectral lines. The slit width (
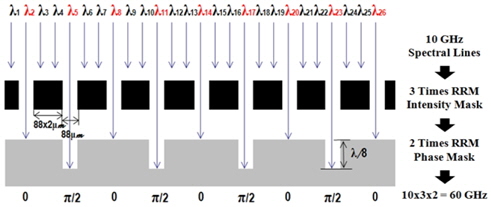
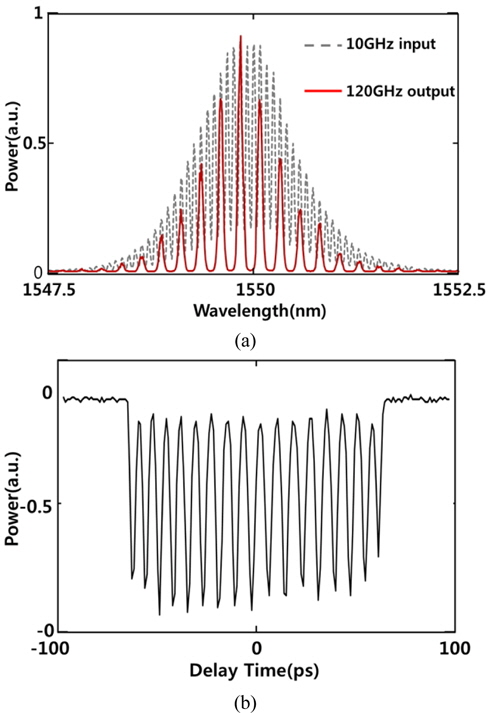
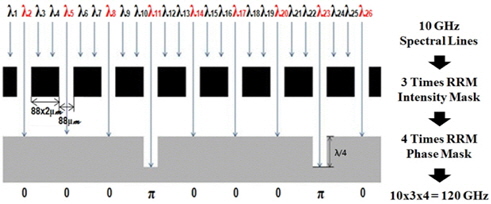
Now we can combine the spectral intensity and phase coding to obtain high RRM factors, given by multiplying the individual RRM factors. Note that relatively low RRM factors for the intensity and phase coding can provide reasonably low loss and high phase-error tolerance. Fig. 2 shows an example of phase and intensity mask patterns for 60-GHz pulse train generation. The intensity pattern (top) alternately passes one spectral line and blocks the subsequent two lines, increasing the spectral spacing by a factor of three and resulting in three times the RRM. The phase mask pattern (bottom) for {0, π/2} periodic phase coding gives twice the RRM. By combining both intensity and phase patterns, we can achieve 6 (= 3×2) times the RRM. Another combination involving an intensity coding with RRM = 3 and a {0, 0, π, 0} periodic phase coding with RRM = 4 is shown in Fig. 3. Here we can achieve 12 (= 3×4) times the RRM, resulting in 120-GHz pulse train generation from a 10-GHz source. Note that the π (maximum) phase difference between the coded and uncoded lines gives the maximum allowable phase error, whereas the RRM = 3 intensity coding gives relatively low loss. We may choose other combinations of the intensity and phase mask patterns to get other high-speed, repetition rate multiplied pulses.
III. EXPERIMENTAL RESULTS AND DISCUSSION
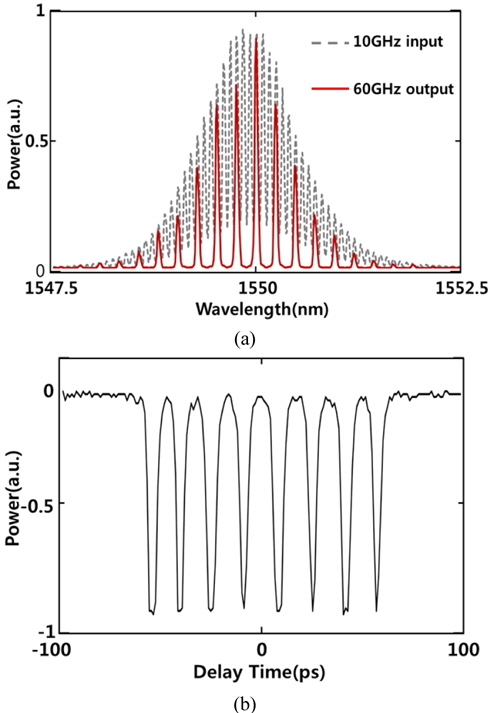
To experiment with combined intensity and phase coding, we choose the RRM = 3 intensity and RRM = 2 phase patterns shown in Fig. 2. The intensity mask filters out the redundant spectrum, and the spectral spacing increases to three times the original spacing. Then {0, π/2} sequence periodic phase coding, which gives an additional factor of two in RRM, is applied to the intensity-filtered spectral lines. Figure 4 shows the experimental results. The spectral intensity coding increases the spectral spacing by a factor of three, but the added phases do not affect the shape of the spectral intensity. The added phases double the intensity-coded pulse speed. The autocorrelation trace clearly shows the output pulses at 60 (= 10×3×2) GHz. Due to the resolution bandwidth (RBW) limit of 0.07 nm, which approaches the 10-GHz (
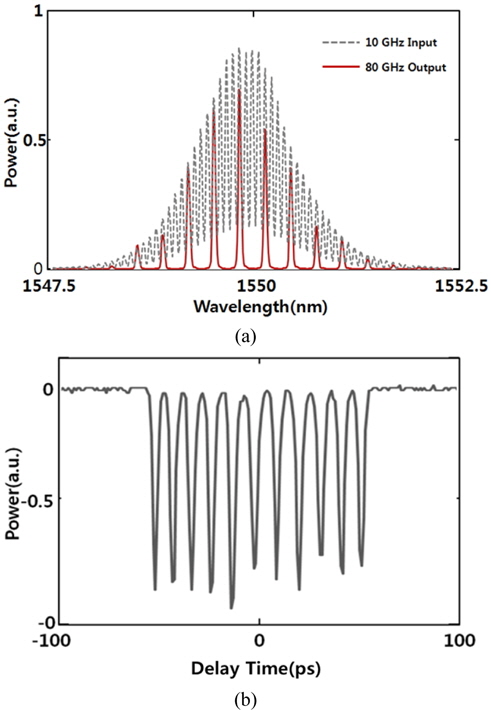
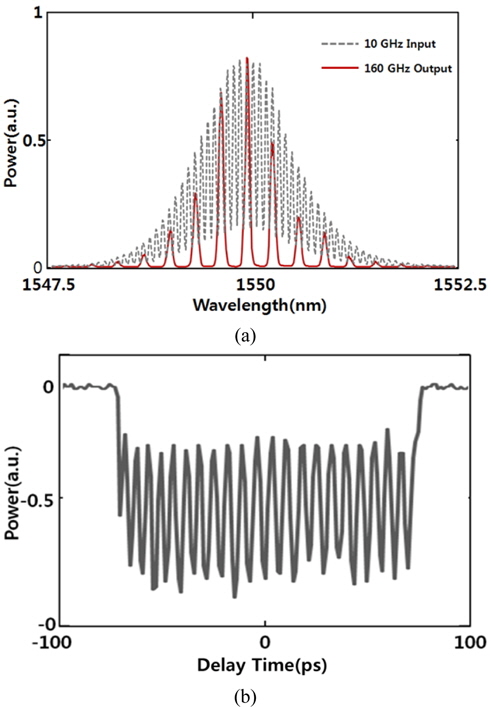
Other high-speed pulse trains at integer multiples of 10 GHz can be generated by combining appropriate intensity and phase masks. Some of them are shown in Figs. 6 and 7, demonstrating 80-GHz and 160-GHz pulse trains. The 80-GHz pulses are obtained by combining RRM = 4 intensity and RRM = 2 phase codings, and the 160-GHz pulses are obtained by RRM = 4 intensity and RRM = 4 phase codings, respectively. In this way arbitrary high-speed pulse trains in steps of 10 GHz can be generated by combining intensity and phase masks with appropriate RRM factors.
The fluctuations in peak intensity observed in the autocorrelation traces indicate that there are pulse-to-pulse intensity fluctuations in the output. These fluctuations are induced by the slight misalignment among spectral comb position, intensity mask, and phase mask, and by the phase coding error at the phase mask. Even though we cannot measure time traces directly at these frequencies, we can deduce the magnitude of the fluctuation by examining the output pulses at measurable speeds under separate intensity or phase coding. The intensity coding induces ±2% of the output pulse fluctuation [4], while the phase coding induces ±4% [8]. Therefore we expect that ±4.5% pulse-to-pulse intensity variations would be observed in the output pulses after filtering.
In conclusion, we have built a simple, cost-effective, line-by-line spectral intensity and phase coder with resolution ~5 GHz at 1.55 μm. We used a grating, collimating lens, an intensity mask, and a phase-delay retro-reflection mirror. A simple and easily made intensity mask with transparent and opaque patterns was employed at the Fourier transform plane of our spectral coder to provide the coding (filtering) of the spectral intensity. A ribbed mirror in a reflective geometry followed for phase coding of the spectral lines passed by the intensity pattern. By choosing intensity- and phase-mask patterns with relatively low RRM factors, we can maintain relatively low loss and high spectral-coding tolerance, by which we can achieve sufficiently high net RRM factors. In this way we realize various high-speed (up to 160-GHz) pulse trains from a relatively low-speed (10-GHz) mode-locked laser.