Machine material and structural strain are critical factors for appraising mechanical properties and safety. Particularly in three and four-point bending tests, which appraise the deflection and flexural strain of an object due to external force, measurements are made by the crosshead movement or deflection meter of a universal testing machine. The Digital Image Correlation (DIC) method is one of the non-contact measurement methods. It uses the image analyzing method that compares the reference image with the deformed image for measuring the displacement and strain of the objects caused by external force. Accordingly, the advantage of this method is that the object’s surface roughness, shape, and temperature have little influence. However, its disadvantage is that it requires extensive time to compare the reference image with the deformed image for measuring the displacement and strain. In this study, an algorithm is developed for DIC that can improve the speed of image analysis for measuring the deflection and strain of an object caused by a three-point bending load. To implement this algorithm for improving the speed of image analysis, LabVIEW 2010 was used. Furthermore, to evaluate the accuracy of the developed fast correlation algorithm, the deflection of an aluminum specimen under a three-point bending load was measured by using the universal test machine and DIC measurement system.
Object displacement and strain rate are critical criteria for appraising the mechanical properties and safety of a machine’s material and structure. Normally, these are measured by using contact-type sensors such as strain gauges and displacement sensors. However, because contact sensors are constrained by surface roughness, temperature, humidity, and shape, they are sometimes difficult to apply. Particularly in three and four-point bending tests, because the deflection and flexural strain rate caused by the bending load of the object are measured, contact sensors cannot be applied; thus, these values are primarily measured by using the displacement values of the crosshead of a universal testing machine and flexure deflection meter. [1, 2, 9, 10]
The DIC measurement method is a noncontact vision measurement system. It analysis the taken images using the CCD camera under external force and then these images are used by measuring the displacement and strain. Accordingly, the advantage of this method is that the object’s surface roughness, shape, and temperature have little influence. Its other advantage is that displacement and strain rate can be measured because it is an image analysis-based measurement method associated with imaging equipment, such as scanning electron microscope (SEM) or CT. Furthermore, through full field measurement as well as the formation of a displacement and strain rate map, measurements of stress distribution and defect progress are possible. However, its disadvantage is that it requires extensive time to compare reference image with deformed image for measuring the displacement and strain. [1-4]
This paper discusses the development of an algorithm for improving the speed of image analysis in the DIC measurement program. LabVIEW 2010 was used to implement the fast correlation algorithm of analyzing the reference image and the deformed image. Additionally, a three-point bending test was conducted by using an aluminum 6061 specimen. Through the measurement system using DIC and a universal testing machine, step load is applied and deflection is measured under a three-point bending load. Furthermore, to evaluate the accuracy of the developed fast correlation algorithm, each a measurement result using the universal test machine and DIC measurement system were compared.
2.1. Digital Image Correlation Measurement System
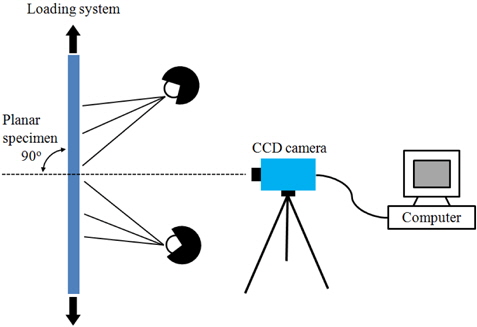
The measurement method using DIC is a noncontact vision measurement method, which measures displacement and strain rate by using a CCD camera and analyzing the correlation of the reference image and the deformed image under the external force. The measurement method using DIC is divided into two systems. The first is a twodimensional (2D) measurement system that uses one CCD camera and measures in-plane displacement. The second is a three-dimensional (3D) measurement system that uses two CCD cameras to form a stereovision system, which simultaneously measures both in-plane and out-of-plane displacement. Figure 1 shows the configuration of the 2D DIC measurement system, displaying the characteristic that its configuration is simpler than that of other noncontact measurement systems. [4-6, 8]
A CCD camera is used in the measurement method using DIC. By using gray scale values of images acquired, the reference image and deformed image of the object caused by external force, the correlation between two images is analyzed. In the case of the widely used 8-bit CCD camera, the object’s image is expressed with a grayscale value between 0 and 225. As a result, because countless points have the same grayscale value, the displacement and strain cannot be measured.
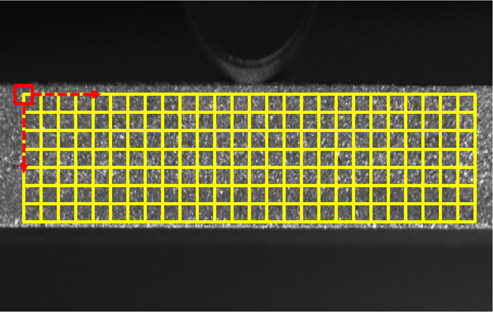
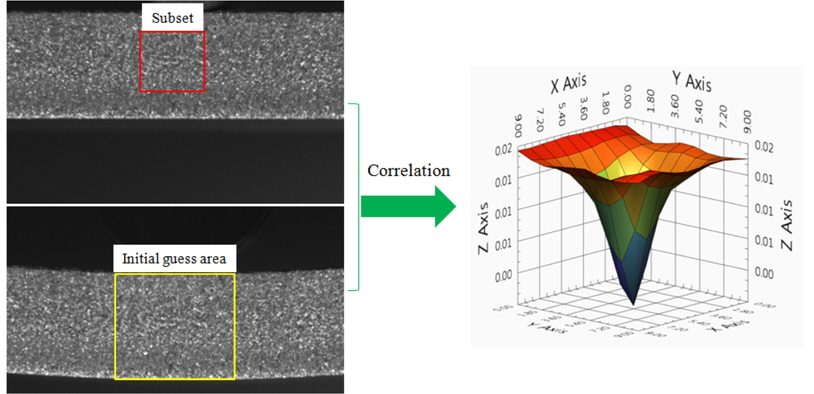
In the measurement method using DIC, to compare the correlations between the reference image and deformed image, with a deformation applied to the object by external force, a “subset” or a square shaped image designated a “window” is separated and the correlation is analyzed of the reference image and the deformed image. Figure 2 shows the method to measure the object’s displacement by using DIC. The square indicated in red represents the subset image for analyzing correlation among the images, while grids in yellow are the points for measuring displacement of the object caused by external force. [1, 2, 7, 8]
2.2. Image Correlation and Initial Guess Area
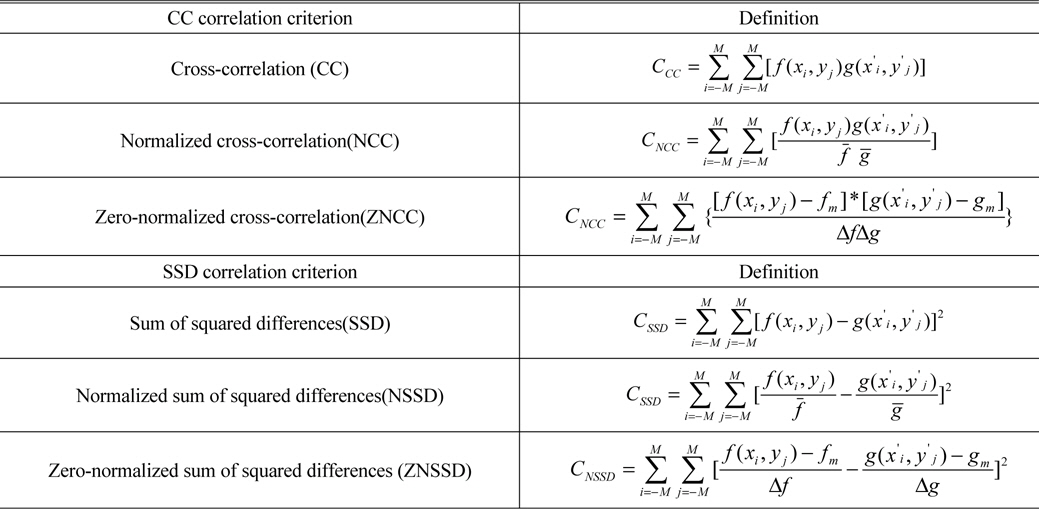
The primary methods for comparing the correlation of the reference image and the deformed image are cross correlation (CC) criteria and sum of square difference (SSD) correlation criterion. In the CC criteria method, if the correlation of the reference image and the deformed image is high, the calculation equation reaches peak value. Conversely, in the SSD correlation criterion comparison method, when the value of correlation is high in between the reference image and the deformed image, the lowest value will be obtained. Table 1 shows the correlation criterion, namely CC Criteria and SSD correlation criteria.
[TABLE 1.] Commonly used cross-correlation criterion and SSD correlation criterion

Commonly used cross-correlation criterion and SSD correlation criterion
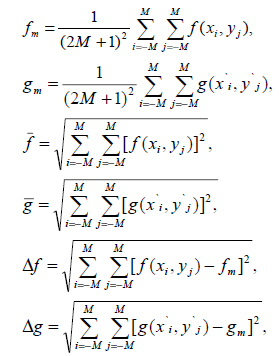
In Table 1,

In Table 1, the
In the measurement method using DIC, to compare the correlation in between the reference image and the deformed image of the object, extensive time is required for correlation calculation, which is a disadvantage. To overcome this disadvantage, an initial guess area is established to reduce the separation area of the subset images in the deformed image. This initial guess area is used for a correlation comparison with the subset images that are separated from the reference image. For a solid object, as external force is applied, all points change continuously. Therefore, the initial guess area size is increased with increasing the external force. Figure 3 shows results for comparison in the image after strain, based on the coordinates of the subset image separated from the reference image using the SSD comparison algorithm. In the figure, the coordinates of points with the lowest value indicate the locations of object displacements caused by external force. [3, 4, 6, 7]
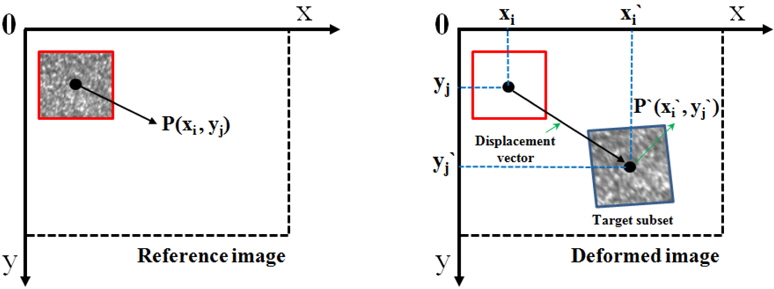
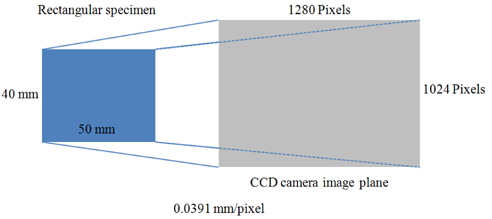
In the measurement method using DIC, to measure the strain caused by external force acting on the object, the correlations of the reference image and the deformed image are compared, then the strain of the object is measured by using the CCD camera. In this measurement, pixel coordinates of the CCD camera are obtained. Figure 4 shows the movement of the reference subset image and the deformed subset image is applied to the object by external force. The movement of the object is tracked through pixel coordinate values of the CCD camera. Therefore, to determine the actual distance moved by the object owing to external force, pixel unit values are converted to distance values. Figure 5 shows the method for determining the distance per pixel to convert the pixel unit value to the actual distance of the object. By using the number of pixels, which indicates the unit length, as shown in the figure, the strain of the object that is expressed in pixel units can be expressed as the actual strain length of the object.
3.1. Conventional Correlation Algorithm
When using a conventional algorithm for comparing the correlation of the reference image and the deformed image, the coordinates of the subset image, which is separated from the reference image, are used and the initial guess area is established; by reducing the separated area of the subset image to compare correlation in the deformed image, the number of computations for correlation comparison is decreased.
However, when the object experiences large deformation, the numbers of the deformed images increases. Therefore, to measure the maximum strain of the object, the size of the initial guess area size is increased, so as the increased initial guess area size is applied in all the deformed images, the number of calculations used in correlation comparison is geometrically increased. [3-7]
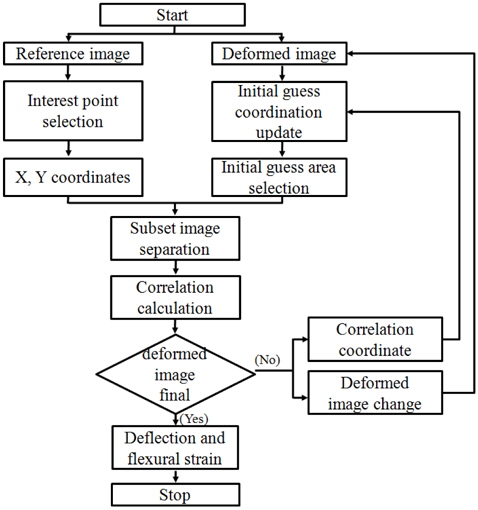
3.2. Fast Correlation Algorithm
Generally, in the case of a solid object, when external force is applied, deformation happens continuously and the respective images, which have acquired the deformed images caused by external force, are correlated.
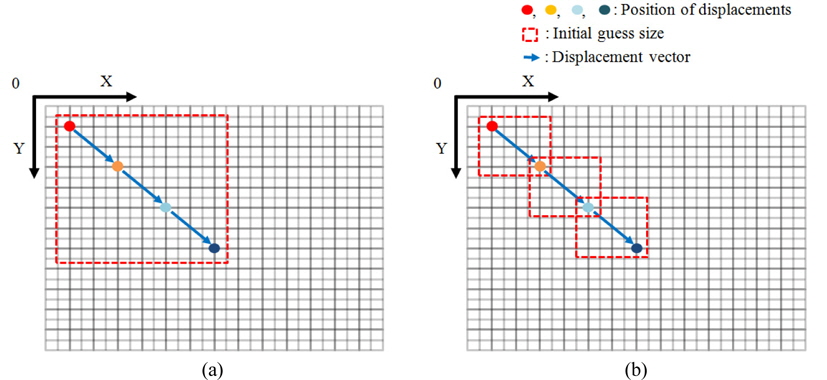
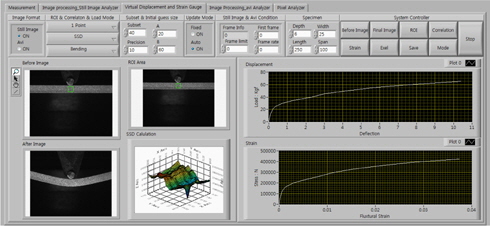
In the measurement of the displacements caused by external force, using the digital image correlation methods, the correlation speed is affected two elements. One is the subset image size and another is the amount of the calculation number of the correlation between the reference image and the deformed images. The subset image size is the amount of the correlation data. In other words, if the subset image size increases, the computing data that is to compare the correlation of the reference image and the deformed image is increased. Therefore, the calculation speed decreases. The amount of the calculation number is affected by the initial guess size. The initial guess area is the expected location of tracing the reference image subset in the deformed image. If the initial guess size increased, the calculation amounts of the correlation between the reference and the deformed image are increased and so the correlation analysis speed was decreased. Therefore, regarding the establishment of the initial guess area for measurement of the deformation, the coordinates acquired through the correlation comparison with the deformed image are reflected in the initial guess area coordinate of the next correlation comparison. Therefore, compared with the conventional correlation algorithm, owing to the decrease in the size of the initial guess area, the number of calculations is decreased in the correlation comparison algorithm used to calculate correlation of the reference image and the deformed images caused by external force; thus, the result can be derived quickly. Figure 6 shows the initial guess size between the conventional correlation algorithm and the fast correlation algorithm. In here, the color circles are the displacement location caused by the external force, the red square is the initial guess size and the arrows are the displacement vectors caused by the external force. Figure 6 (a) shows the size of the initial guess area for analyzing the deformation of the object caused by external force, according to the conventional correlation algorithm. As shown in the figure, because the size of the initial guess area, which includes the largest deformation, is consistently applied to analyze each deformed image acquired by external force, the number of repetitive calculations for correlation comparison is increased. Figure 6 (b) shows the initial guess area for correlation comparison using the fast correlation algorithm. Here, the coordinates for the correlation comparison of the deformed images are applied to the next correlation calculation. Thus the size of the initial estimation area is decreased and the number of repetitive calculations is decreased. Figure 7 shows the fast correlation algorithm. Figure 8 shows the interface of the DIC measurement program that implements the fast correlation algorithm using the LabVIEW 2010. In additional, to measure the deflection and flexural strain rate of the object caused by the bending load, information was input such as the shape of the specimen and span length.
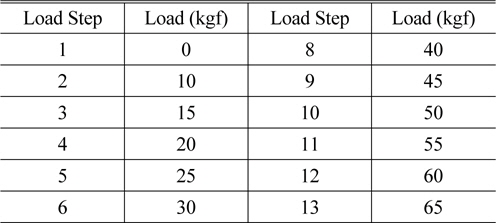
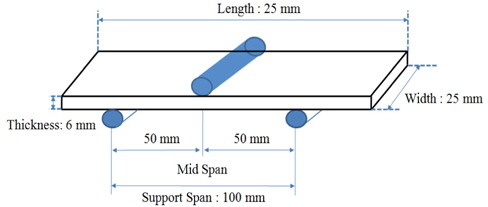
To use DIC for measuring the deflection and flexural strain, which occur due to a three-point bending load, an aluminum 6061 specimen was chosen. The aluminum has a small elastic modulus and a large percent of elongation. So it can easily incur deformation with a small load and it is easy to observe from the elastic to plastic zones. To measure the deflection and flexural strain in the elastic to the plastic zone of the aluminum specimen caused by 3 point bending loads, a three-point bending test was performed under the conditions of bending load listed in Table 2. Figure 9 shows the conditions of the three-point bending test and shape information for the aluminum specimen.
[TABLE 2.] Load conditions of three-point bending test

Load conditions of three-point bending test
4.2. Three-point Bending Test Conditions of DIC System
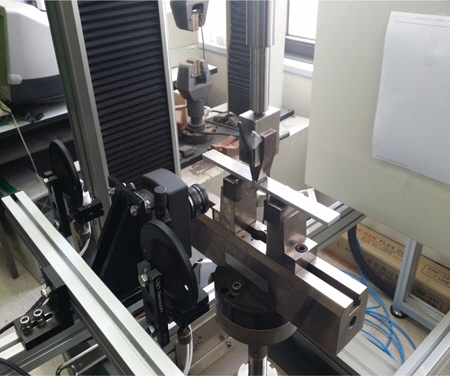
Generally, in the three-point bending test using the universal testing machine, mid span is used to apply the bending load to the specimen; through its moving distance, the deflection is measured. Therefore, to use the DIC measurement system for measuring the deflection caused by the three-point bending load, the mid span part was photographed at which point the bending load acts and the reference subset image was separated in the center of the mid span and specimen position. Furthermore, the measurement resolution using the DIC measurement method was affected by CCD camera pixel number. Therefore, in DIC, to increase the measurement resolution, the distance between the specimen and the CCD camera was adjusted. Additionally, to compare the correlations of the reference image and the deformed image, a white light source was used at the side of specimen, so that light and dark patterns appear irregularly. Figure 10 is a photograph of the DIC system measuring the deflection and flexural strain rate caused by the three-point bending load.
5.1. Number of Calculations for Correlation Comparison
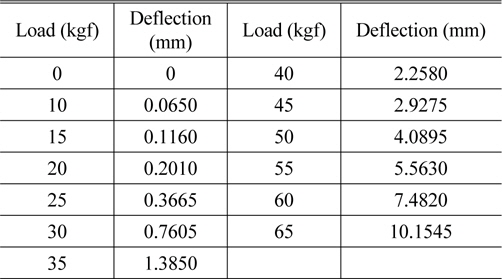
Table 3 is a graph listing the deflections of the aluminum specimen with different loads applied using the universal testing machine. The rupture of the aluminum specimen has happened. So, to compare the measurement results between the universal testing machine and the DIC, the load steps are used until the 65 kgf. The results from the graph indicate that the largest deflection occurred at 10.1545 mm when 65 kgf load was applied. If we divide this by per pixel distance in DIC, the result is a value of approximately 201.4 pixels. Therefore, in the conventional correlation comparison algorithm, a value of more than 205 pixels should be substituted into the
[TABLE 3.] Deflections under load from the universal test machine

Deflections under load from the universal test machine
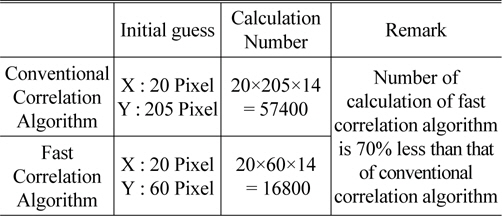
[TABLE 4.] Comparison of calculations between conventional and fast correlation algorithms

Comparison of calculations between conventional and fast correlation algorithms
5.2. Reliability of Fast Measurement DIC Algorithm
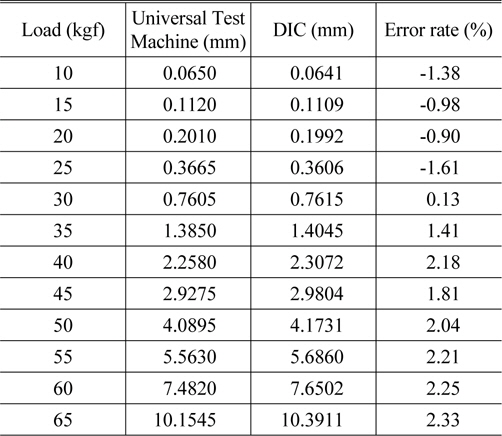
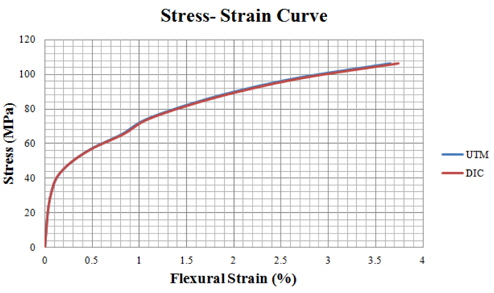
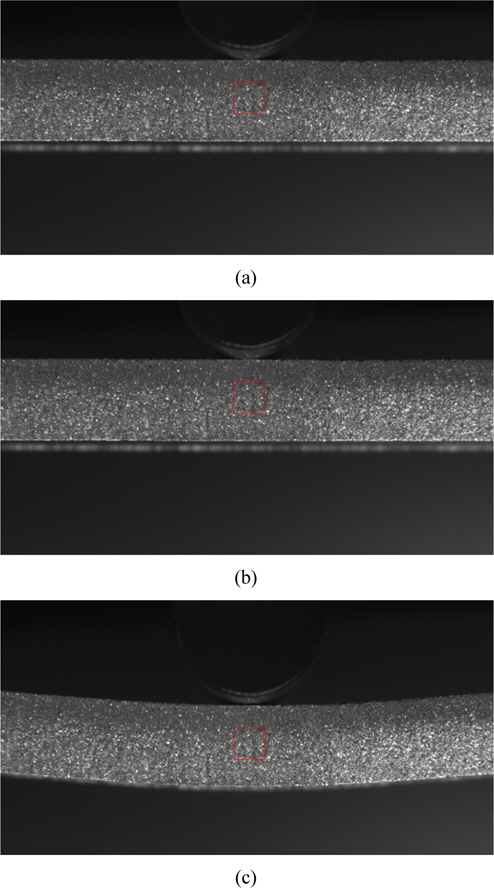
In the three-point bending test, the largest deflection that is applied with the bending load is measured to determine the flexural strain. Therefore, in the three-point bending test, the largest deflection occurs in the middle part of specimen. Thus, to use DIC for measuring the deflection and flexural strain rate of the specimen under the three-point bending load, the subset image was separated from the mid span and central parts of the specimen in the image acquired reference image; by comparing correlations with the respective images of specimen strain caused by different bending loads, deflection and flexural strain caused by the bending load were measured. Table 5 lists the deflections and error rates of aluminum specimens to which different bending loads were applied, according to the universal testing machine and DIC. As listed in the table, the DIC measurement program induced less than 3% of measurement error using the fast correlation algorithm, compared to the universal testing machine as a reference. Additionally, not only elastic but plastic zone ranges due to bending load can be measured. Figure 11 is a graph of flexural strain rates using the universal testing machine and the DIC measurement system applied with the fast correlation algorithm. Figure 12 is CCD camera images which are deformed images caused by 3 point bending load. In this figure, the red square center point is tracking the deflection using the DIC measurement system that applied the fast correlation algorithm.

Comparison of deflection and measurement error between the universal test machine and the DIC measurement program applied with fast correlation algorithm
The DIC is a non contact measurement system. This measurement system analyzes images of the reference image and the deformed image to measure the displacement and strain of the object under the external force. However, its disadvantage was that extensive time was required to calculate the correlations of the reference image and the deformed image. Through this study, improved the correlation analysis speed of the DIC measurement system by applying the fast correlation algorithm and via threepoint bending tests of an aluminum specimen, the following conclusions were derived.
(1) Using DIC, deflection and flexural strain rate can be measured when a three-point bending load is applied. (2) Using DIC, deflection of an aluminum specimen to which a three-point bending load was applied can be measured in a wide range, from elastic to plastic zones. (3) In the case of the fast correlation algorithm, to analyze the correlation of the reference image and the deformed image, the initial guess area size was decreased, accordingly decreasing the correlation calculations number and thereby improving the speed. (4) To measure the displacement map and strain map, the DIC measurement system was used. Therefore, the fast correlation algorithm is more effective than the conventional algorithm. (5) By comparing the universal testing machine and the fast correlation algorithm applied in the DIC measurement system, the measured values of deflection and flexural strain rate occurring as a result of the three-point bending load showed a result of less than 3% error.