Nanoporous TiO2 films are commonly used as working electrodes in dye-sensitized solar cells (DSSCs). So far, there have been attempts to synthesize films with various TiO2 nanostructures to increase the power-conversion efficiency. In this work, vertically aligned rutile TiO2 nanorods were grown on fluorinated tin oxide (FTO) glass by hydrothermal synthesis, followed by deposition of an anatase TiO2 film. This new method of anatase TiO2 growth avoided the use of a seed layer that is usually required in hydrothermal synthesis of TiO2 electrodes. The dense anatase TiO2 layer was designed to behave as the electron-generating layer, while the less dense rutile nanorods acted as electron-transfer pathwaysto the FTO glass. In order to facilitate the electron transfer, the rutile phase nanorods were treated with a TiCl4 solution so that the nanorods were coated with the anatase TiO2 film after heat treatment. Compared to the electrode consisting of only rutile TiO2, the power-conversion efficiency of the rutile-anatase hybrid TiO2 electrode was found to be much higher. The total thickness of the rutile-anatase hybrid TiO2 structures were around 4.5-5.0 μm, and the highest power efficiency of the cell assembled with the structured TiO2 electrode was around 3.94%.
나노다공성 TiO2 필름은 주로 염료감응형 태양전지의 작동전극으로 사용된다. 지금까지 염료감응형 태양전지의 광전환효율을 높이기 위해 TiO2 나노구조체에 대한 다양한 연구가 시도되어왔다. 본 연구에서는 수열합성법을 이용하여 FTO glass 위에 루타일 TiO2 나노로드를 수직적으로 성장시켰고 그 위에 아나타제 TiO2 필름을 재 합성하였다. 이 새로운 방법은 아나타제 TiO2 합성시 요구되는 시드층 합성단계를 피할 수 있었다. 밀집한 아나타제 TiO2 층은 전자생성층으로써 고안되었고 시드층 대신 합성된 루타일 TiO2 나노로드는 생성된 전자들이 FTO glass로 이동하는 통로역할을 하게 되었다. 전자이동률을 증진시키기 위해 루타일 나노로드에 TiCl4 수용액을 이용하여 표면 처리하였고 열처리 후 표면 위에 얇은 아나타제 TiO2 필름을 형성시켰다. 합성된 루타일-아나타제 TiO2 구조체의 두께는 4.5-5.0 μm이고 셀 테스트 결과 3.94%의 광전환효율을 얻게 되었다. 이는 루타일 TiO2 나노로드 전극과 비교했을 때 광전환효율이 상당히 향상되는 것을 확인할 수 있었다.
The recent acceleration in the pace of global warming has forced many researchers to focus on the development of alternative energy technologies such as solar cells and wind turbines that can replace a substantial portion of fossil fuels[1]. Among these alternatives, solar-cell technology is under active development owing to the possibility of instant application to the power supply chain[2]. Among solar cells, dye-sensitized solar cells (DSSCs) are considered more economically viable and environmentally friendly compared to silicon-based solar cells[2-5]. Titanium dioxide (TiO2) has been adopted as an electrode material in DSSCs because of its promising characteristics as an n-type semiconductor. It has chemical and physical stability as well as a wide band-gap (3.2 eV) under ultraviolet light[6-8]. TiO2 has three types of crystallographic structures: anatase, rutile, and brookite[9,10]. Anatase is known, despite its metastable characteristics at ambient temperature, to possess the highest photocatalytic activity because of its large surface area compared to rutile and brookite[11-14]. In addition, the anatase structure has low crystal-lattice packing fraction so that it absorbs light better owing to the reduced refractive index[15]. When anatase TiO2 is heated above 500 ℃, it is irreversibly converted to the stable rutile structure[16,17]. Besides the physical and chemical properties of TiO2, the geometry of the nanostructured TiO2 electrode is a critical factor of the performance of DSSCs because the contour surface of the TiO2 structure serves as a network of electron pathways[18-20]. Recently, various types of nanostructured TiO2 such as nanoparticles, nanotubes, nanowires, and nanorods have been prepared and adopted as electrode materials to improve the performances of DSSCs[21-25]. Tan et al.[26] synthesized TiO2 nanoparticles attached to TiO2 nanowires to increase the surface area and applied them as a DSSC electrode material. They reported that the resulting DSSC had a powerconversion efficiency of 8.6%, which is 2% higher than the efficiency of the cell with a TiO2 nanoparticle electrode. Lei et al.[27] grew TiO2 nanotubes on Ti foil using the anodic oxidation method and prepared a cell that had a power-conversion efficiency of 8.07%. Therefore, it is believed that in addition to the requirement of a large surface area for dye absorption, a one-dimensional geometry of TiO2 that provides straight pathways for electron transfer is essential to improve the solar-cell performance. If TiO2 nanotubes are directly synthesized on fluorinated tin oxide (FTO) glass, which is not a commercially available technology at the current moment, higher cell performance might be achieved. Instead, researchers have focused on the direct growth on FTO glass of nanorods that possess characteristics similar to those of nanotubes[28-31]. In particular, rutile TiO2 has a very small lattice mismatch (<2%) with FTO, and it is rather easy to grow rutile TiO2 on FTO with large aspect ratios [32-34]. So far, it has been reported that rutile TiO2 nanorods can be grown on FTO glass via hydrothermal synthesis[27-30]. For instance, Liu et al.[35] obtaineda DSSC power-conversion efficiency of 3% using TiO2 nanorods that were grown to a length of up to 4 μm. In an advanced method, Wang et al.[36] attached TiO2 nanobranches to the nanorods to increase the surface area and achieved a DSSC power-conversion efficiency of 3.75% even with nanorods that had heights of 3 μm. Nevertheless, it has been known that these forms of rutile TiO2 are inferior to anatase TiO2 in terms of DSSC power-conversion efficiency, and it is very difficult to grow anatase TiO2 nanorods vertically on FTO glass because of the large lattice mismatch (~19%) between anatase TiO2 and FTO[37,38]. Therefore, a TiO2 colloid solution must be spin-coated onto the FTO glass in order to synthesize the layer of nanostructured anatase- phase TiO2[39].
In this study, instead of using the thin TiO2 seed layer, rutile TiO2 nanorods were synthesized on FTO glass, on which the dense anatase TiO2 nanostructures were fabricated using two different hydrothermal synthesis techniques in sequence. It was assumed that the electrons that were formed in the transparent anatase TiO2 layerwould be transferred to the FTO glass through the rutile TiO2 nanorods. In addition, the surfacesof the rutile TiO2 nanorods were treated with aqueous TiCl4 solutions that had varying concentrations of TiCl4 for different treatment durations to prevent electron recombination[40].
2.1. Preparation of TiO2 nanostructures
Rutile-anatase hybrid TiO2 nanostructures were prepared on FTO glass (TEC-8, 8 Ω/square) in two sequential hydrothermalsynthesis steps. The typical procedure is as follows: FTO glass was cleaned in a mixed solution of water, acetone, and 2-propanol (volume ratio = 1:1:1) in a sonication device for 30 min. After drying in ambient condition, the FTO glass was placed in a Teflon-lined stainless-steel vessel (100 mL). It was leaned against the vessel wall, with the conductive side facing down in a mixed solution containing 30 mL of de-ionized water, 30 mL of hydrochloric acid (36.5-38.0%, Sigma-Aldrich), and 0.5 mL of titanium butoxide (97%, Sigma-Aldrich). The stainless-steel vessel was then sealed and placed in a convective oven at 150 ℃ for 20 h. Following the procedure described above, rutile TiO2 nanorods were vertically synthesized on FTO glass. The resulting sample was then rinsed with de-ionized water and immersed in an aqueous solution of TiCl4 (0.2-0.4 M) and kept for 1-12 h at ambient temperature.
For the second hydrothermal synthesis, the rutile-covered FTO glass was washed with de-ionized water and dried. Next, the glass was placed in a mixed solution containing 35 mL of H2O, 5 mL of sulfuric acid (ACS reagent, 95.0-98.0%, Sigma-Aldrich), and 2 mL of titanium butoxide (97%, Sigma-Aldrich) in the Teflon-lined stainless-steel vessel. Again, the steel vessel was placed in the convective oven at 180 ℃ and kept for 12 h. The resulting sample was removed, washed with de-ionized water, and dried. The sample was then calcined at 400 ℃ for 2 h. Finally, the rutile-anatase hybrid TiO2 nanostructures were fabricated as a form of the anatase TiO2 layer covering the upper tips of the rutile TiO2 nanorods on FTO glass. Hereafter, each sample is referred to as [R][TiCl4 concentration]-[TiCl4 treatment time][A] The first letter R stands for rutile TiO2, and the final letter A represents anatase TiO2. For instance, to prepare the sample R0.2-12A, rutile TiO2 nanorods were grown on FTO glass and then subjected to TiCl4 (0.2 M) treatment for 12 h, during which anatase TiO2 was synthesized on the nanorods.
2.2. Characterization of TiO2 nanostructures
The crystal structure of the anatase TiO2 nanostructures was characterized by X-ray diffraction (XRD Rigaku, 40 kV, 100 mA). The morphology of the samples was examined with a fieldemission scanning electron microscope (FE-SEM S-4700, Hitachi) and a transmission electron microscope (TEM JEM-2100F HR, JEOL Ltd.) with an accelerating voltage of 200 keV, point resolution of 0.23 nm, and STEM resolution of 0.2 nm.
2.3. Assembling of dye-sensitized solar cells and their performance evaluation
The rutile-anatase TiO2 electrodes were immersed in an ethanol solution of a ruthenium-complex (N719, Solaronix) for 24 h to complete the dye absorption. The FTO glass with 0.7 mm holes was coated with a 7 mM chloroplatinic acid (H2PtCl6, Aldrich) solution to serve as the counter electrode. The dye-absorbed TiO2 electrode and Pt counter electrode were clamped firmly together with 60 mm-thick surlyn. The electrolyte containing 0.03 M I2, 0.05 M LiI, 1 M 1-methyl-3-propylimidazolium iodide, 0.1 M guanidine thiocyanate, and 0.5 M
3.1. XRD analysis of the TiO2 nanostructures
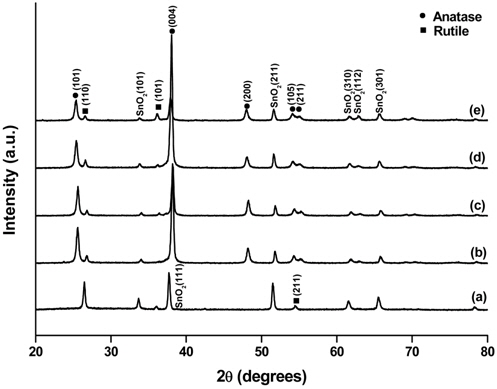
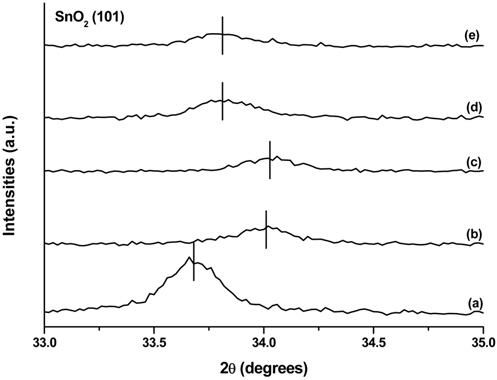
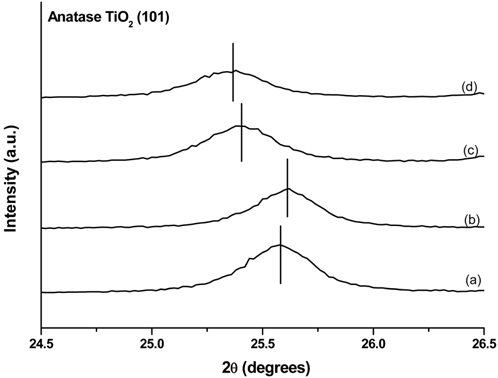
XRD analysis was carried out to determine the crystal structures of the prepared samples. The XRD patterns of the samples are shown in Figure 1. SnO2 peaks appeared in all the patterns because FTO glass was used as the substrate. A comparison of the XRD pattern of sample R (Figure 1(a)) with the standard data in JCPDS 88-1175 confirmed the existence of rutile TiO2, as shown by the (110) peak at 2θ = 27° and the (110) peak at 2θ = 54°. The XRD patterns of R0.2-1A (Figure 1(b)) and R0.4-12A (Figure 1(c)) show additional peaks at 2θ = 25°, 39°, 48°, 54°, and 55°, which match the diffraction peaks corresponding to the (101), (112), (200), (105), and (211) planes, respectively, of anatase TiO2 according to JCPDS 84-1286. Therefore, it is clear that we obtained samples containing both rutile and anatase TiO2 on FTO glass. As reflected by the samples’ names, sample R is the one without TiCl4 treatment of rutile TiO2, while the other samples were treated with TiCl4 solution before anatase TiO2 was synthesized on the rutile TiO2. Close examination of the XRD patterns of R and other samples revealed that the characteristic peaks of SnO2 shifted slightly to the right. The enlarged view of XRD patterns for SnO2 (101) peaks is shown in Figure 2. The (101) peak intensities of the rutile-anatase TiO2 samples were much weaker than that of the rutile-only sample because anatase TiO2 covered the rutile TiO2 layers, limiting the depth of X-ray penetration. The extent of the peak shift depended on the concentration of TiCl4 but not on the TiCl4-treatment duration. When a lower concentration of TiCl4 was applied, a longer exposure of the FTO glass surface to the TiCl4 solution was expected because the amorphous TiO2 deposition rate was slower than that with higher concentration of TiCl4. Therefore, we believe that hydrogen chloride formed during the TiCl4 treatment penetrated the rutile TiO2 layer and attacked the exposed FTO surface, and some Sn atoms were replaced by Ti atoms that have a smaller atomic radius[41]. On the other hand, with a higher concentration of TiCl4, the amorphous TiO2 formation took place faster and covered the FTO surface quickly, preventing further attack of hydrogen chloride.
Another notable feature was that the characteristic peaks of the anatase TiO2 in R0.4-1A and R0.4-12A (Figure 3(c), (d)) were located at positions that were slightly shifted to the left when compared to the same peaks of R0.2-1A and R0.2-12A (Figure 3(a), (b)). The peak shift implies that there was a change in the lattice parameters[42]. Table 1 shows the lattice parameters calculated from the (004) and (200) peaks of anatase TiO2 in the samples. Even though the experimental conditions for the hydrothermal synthesis of anatase TiO2 on the rutile TiO2 layer were identical for all samples, the lattice parameters of each sample were varied. This phenomenon appears to be related to the concentration of the TiCl4 solution, i.e., the lattice parameter
[Table 1.] Peak positions and lattice parameters of anatase TiO2 in TiO2 nano-structures
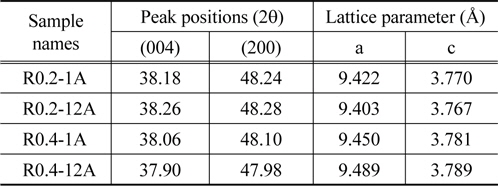
Peak positions and lattice parameters of anatase TiO2 in TiO2 nano-structures
3.2. TEM and SEM analysis of the TiO2 nanostructures
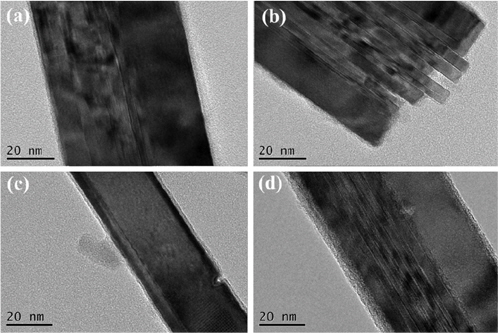
In order to investigate this variation in the lattice parameters of the anatase TiO2 on rutile TiO2, TEM analysis was carried out for rutile nanorods after TiCl4 treatment. Figure 4 shows the TEM images of the rutile TiO2 nanorods treated with TiCl4at various concentrations and for different durations. When the concentration of TiCl4 was 0.2 M, the amorphous TiO2 layer was thin and uniform; and the thickness of the layer was affected by the treatment duration. On the other hand, when the concentration of TiCl4 was 0.4 M, the amorphous TiO2 layerwas much thicker than that obtained from the 0.2 M TiCl4 solution, and an additional bulge corresponding to the rutile TiO2 nanorods was observed. In addition, the thickness of the layer was proportional to the treatment time. Based on these observations,we believe that the less concentrated TiCl4 solution provided the thin amorphous TiO2 layer with the seeds for anatase TiO2 growth. On the other hand, the high-concentration TiCl4 solution provided more coarse and additional seeds apart from the surface of rutile TiO2. Therefore, when a lower concentration of TiCl4 was used, the resulting anatase TiO2 tended to be packed and became denser towards the interior of the particles, creating a pressure that resulted in the smaller lattice parameter. Using a similar analysis approach, Zhang et al.[43] reported fabrication of CeO2 and BaTiO3 nanoparticle thin films in which the increased lattice parameter with decreasing particle size was explained by the negative effective pressure created by the competition between the long-range Coulomb attractive interactions and the shortrange repulsive interactions in ionic nanocrystals. Li et al.[44] also reported that the concurrent packed growth of rutile TiO2 physically squeezed the anatase TiO2 phase, resulting in a decrease in the lattice parameter.
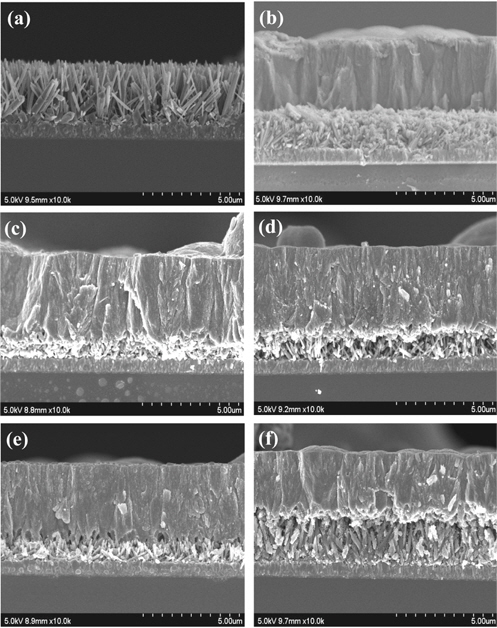
The SEM images in Figure 5 show that the rutile TiO2 nanorods were well grown like mowed grass, as reported by Liu et al.[35]. The concentration of the precursor and other chemicals were adjusted by trial and error until the proper density of nanorods was obtained. In the image of sample RA (Figure 5(b)), whose anatase TiO2 layer was deposited on the rutile TiO2 nanorods without TiCl4 treatment, it can be seen that the dense, powder-like anatase TiO2 grew and filled all the gaps between the nanorods. On the other hand, when the rutile TiO2 was treated with TiCl4 prior to the anatase TiO2 synthesis (Figure 5(c-f)), the anatase phase was confirmed to grow on the tips of the rutile nanorods, leaving the gaps between the nanorods empty[45]. It should be noted that these empty gaps played very important roles in the DSSC performance. When incident light came in through the anatase layer, this empty space allowed the light to reflect multiple times and remained for a longer period in the TiO2 structure to produce more electrons. According to the SEM images, the height of the rutile nanorods was strongly dependent on both the concentration of TiCl4 and TiCl4 treatment duration. The rutile nanorod layer in R0.2-1A was barely recognizable, while the thicker layer of the nanorods in R0.2-12A was clearly distinguishable and showed more empty space. This means that the height of rutile nanorods increased with longer TiCl4-treatment duration. This relationship was also observed in R0.4-1A and R0.4-12A. On the other hand, treatment at a higher concentration of TiCl4 for the same amount of time contributed to the growth of the nanorod radius. It should be carefully considered that the rutile nanorods in sample R were shortened with TiCl4 treatment it has been reported that theTiCl4 solution has an etching effect on rutile nanorods[46,47]. It has also been reported that rutile nanorods grow with extended TiCl4 treatment[47]. These reports match our experimental results that showed the height of the nanorods decreased in the following order: R0.4-12A > R0.2-12A > R0.4-1A > R0.2-1A.
3.3. Power-conversion efficiency
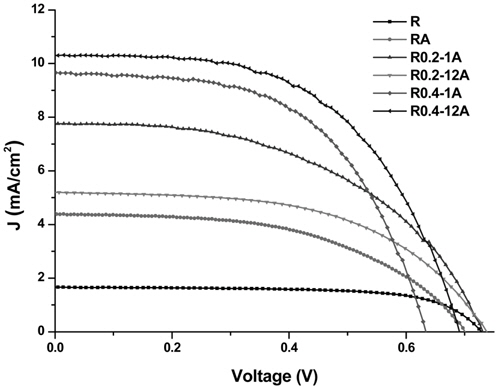
The power-conversion efficiency of a DSSC strongly depends on the geometric configuration and thickness of the TiO2 structure. As shown in the SEM image analysis, the six TiO2 structures on FTO glass showed clear differences in thickness and geometric configuration. The current density-voltage (
[Table 2.] Photovoltaic characteristics of DSSCs assembled with TiO2 nano-structures
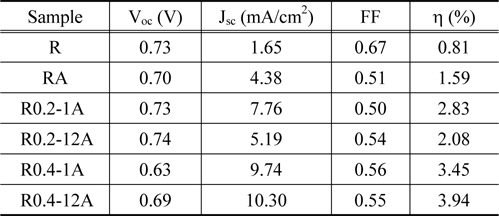
Photovoltaic characteristics of DSSCs assembled with TiO2 nano-structures
In this study, rutile-anatase hybrid TiO2 nanostructures were prepared and characterized. DSSCs were assembled with the prepared TiO2 nanostructures and their photovoltaic characterizations were obtained. The rutile nanorods were found to act as effective pathways for the electrons produced in the anatase layer. It was confirmed that the rutile nanorods should have high length and relatively high density to increase