Load balancing becomes more and more important problem in current high-speed optical networks [1]. The exponential growth of Internet traffic and the emergence of cloud computing could lead to link overload and imbalance at each node of a network, resulting in network performance deterioration, such as increased packet-loss ratio (PLR) and time delay [2-6]. Meanwhile, network traffic is shifting from the “North-South” type to “West-East”, and network resources need to be reassigned with stricter reliability [7-9]. Accordingly, balanced scheduling must be implemented for better performance.
Several studies have been made of routing algorithms for networks to achieve load balancing. A few routing schemes were analyzed in data centers, with improved and guaranteed throughput [10]. An integrated routing algorithm was proposed to achieve load balancing in a hybrid architecture [11]. A topological routing scheme with load balancing and superior quality of service (QoS) support and resource utilization was presented in [12]. Also, the Ameba network architecture with a simple routing algorithm was proposed to achieve load balancing [13]. However, the assignment and distribution of optical flow inside a node with multiple ports could not be taken into consideration in the works above, so it is difficult to ensure the load balancing inside a node.
Considering the load-balancing implementation inside the node, some expensive components were utilized in several studies. A two-stage switching node fabric with load-balancing algorithm with tunable wavelength converters supporting asynchronous variant data was presented in [14]. The load balancing was performed by hardware configurations in a switch architecture [15]. The packet-loss performance was analyzed in a cloud data center with load-balancing switching using a wavelength converter [1]. The performance enhancement of switching fabric employing load balancing was achieved with wavelength converters in [16]. Balance switching can be implemented for synchronous fixed-length packets with wavelength converters [17]. However, it is ineffective to strike the load balance using just hardware with the average optical flow at each wavelength for each port in such works. Meanwhile, the key components such as tunable wavelength converters are still costly or immature for practical deployment [18-21].
In this paper a dynamic load-balancing algorithm is proposed, based on data distribution and service levels in the AOPS node, without wavelength converters and with a limited buffer. It can flexibly schedule data with different priorities according to their corresponding requirements, and the simulated demonstration can be implemented with asynchronous and variant optical packets. Data can be dynamically balanced with this algorithm, the PLR and time delay can be reduced effectively, and QoS can be guaranteed.
II. DYNAMIC LOAD-BALANCING ALGORITHM
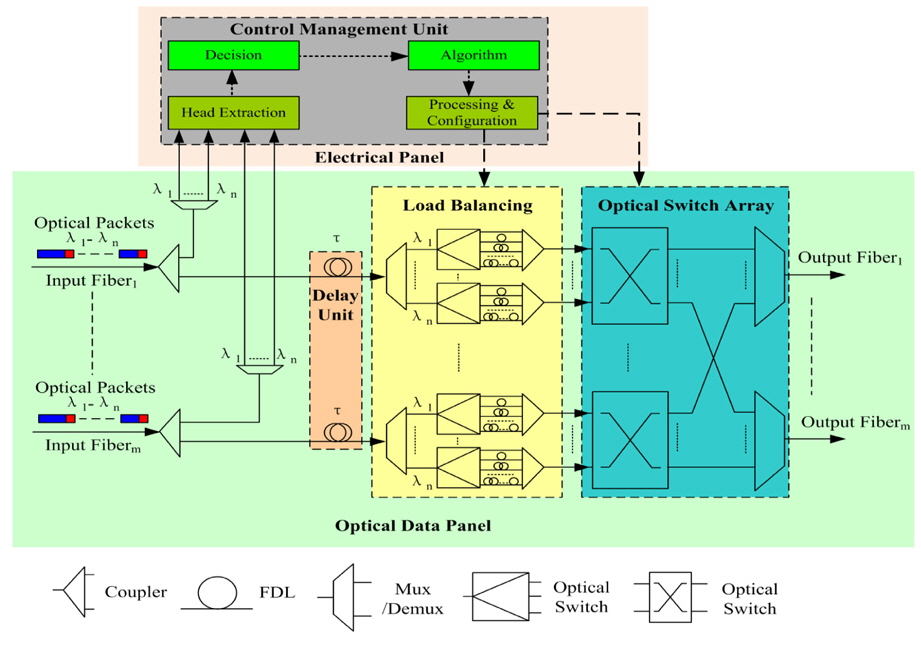
Figure 1 illustrates the architecture of an AOPS node, which consists of a time-delay unit, control-management unit, load-balancing unit, and an optical switching array. It is composed of
The control-management unit gets the load state of the inflow, monitors the balancing state of output optical packets in real time, and calculates the occupancy state of the wavelength channels. The load-balancing algorithm is executed according to the load threshold, service levels, and other control messages after extraction and analysis of the information from inflow headers. Then the output load balance is optimized, and the corresponding balance-state information database is updated accordingly. Whether the load-balancing algorithm is started depends on the load state, and the flow can be balanced according to the service levels to satisfy the corresponding QoS for each level. Consequently the PLR and time delay are reduced, and the total throughput is increased.
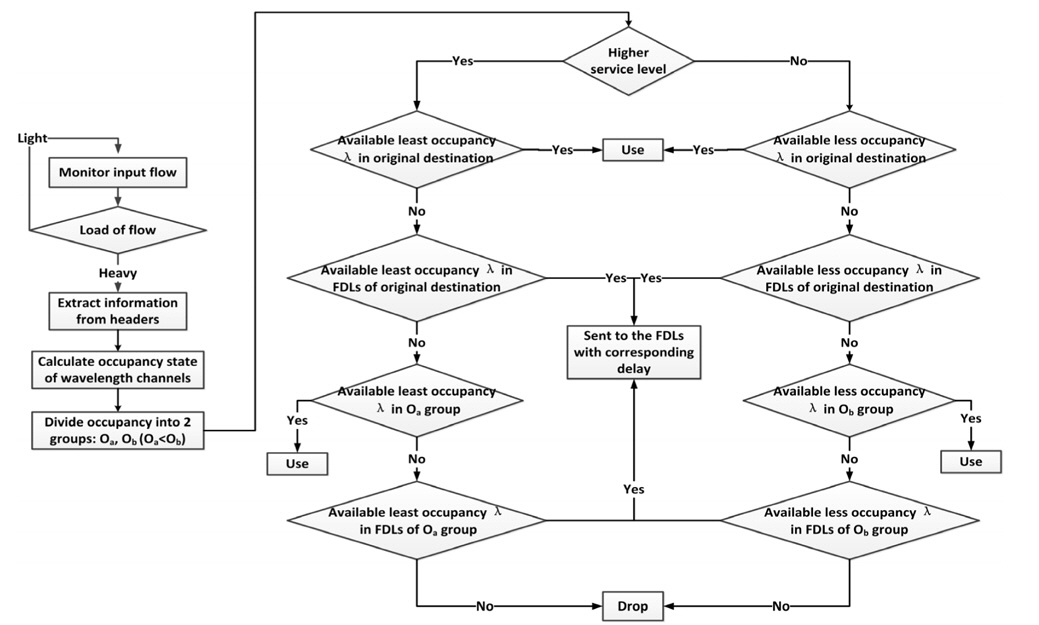
As shown in Fig. 2, the control-management unit first judges the load state of the input flow and starts the load-balancing algorithm if the load is greater than the threshold. After extracting information from the packet headers, the current occupancy state of the output ports is calculated and divided into two groups in ascending order, Oa and Ob. Then the service level is judged, when the level is too high, the least occupied wavelength channel in the direct output wavelength or FDL array of the original destination port can be searched and confirmed according to the algorithm. If none is available, then the search turns to the group Oa to find another possible channel in the direct output wavelength channels or FDL array. If the service level is low, then the corresponding requirement is lowered. First the algorithm searches for the least occupied wavelength channel in the direct output wavelengths or FDL array of the original destination port. If none can be found, then the search is switched to the group Ob to find the suitable path in the direct output wavelength channels or FDL array. Finally the control-management unit updates timely the balancing status of the node in the information database, and refreshes the occupancy states.
Compared to the others, the proposed algorithm may be executed flexibly according to the traffic load, and it can divide the occupancy state into two groups according to the service levels, the data with higher priority entering the first occupancy group while the data with lower priority enter the other. In this way the QoS of higher-level data can be assured, and scheduling time can be saved without the need to traverse the entire occupancy state. The data will only be sent to the corresponding group according to its priority, and then the data in the queue are divided again into two groups, one being sent to output directly and the other buffered in the FDLs. The packets are dealt with according to the balance state and priorities. In this way the occupancy states are analyzed precisely and the data can be scheduled more effectively.
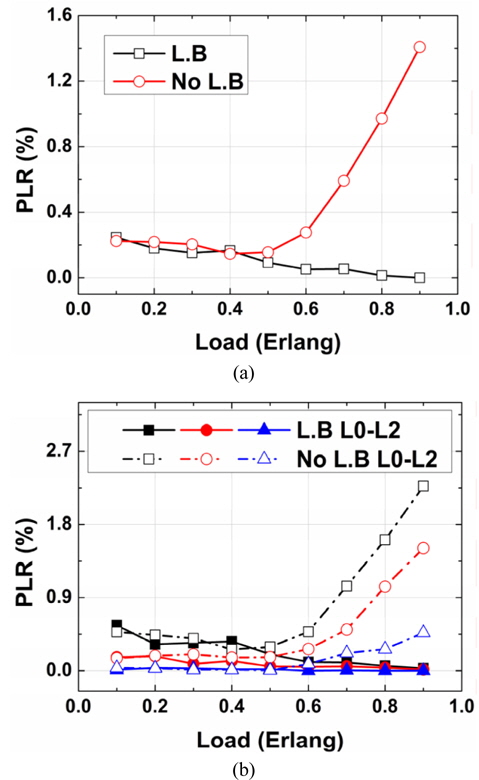
The simulation platform is built based on the switch fabric shown in Fig. 1, which has 50 input/output ports, 50 fiber channels, and 3 service levels of data flow. The packet length and interval time are asynchronous and variant, subject to the negative exponential distribution shown in Table 1. Figure 3 illustrates the PLR curves of the three service levels and their total, with and without the balancing algorithm in the simulation platform. Compared to the situation without balancing algorithm, the performance with load balancing is better and improved in terms of PLR. Figure 3(a) shows the total PLR curve. We can observe that with the balancing algorithm the PLR is reduced when the load increases. Especially when the load is bigger than 0.5 Erlang, the PLR with the algorithm is obviously lower than that without one. The PLR is reduced by 1.41%, keeping below 0.01%. Figure 3(b) shows the PLR versus load for the three different service levels. We can observe that when the load is greater than the threshold, the PLR with the balancing algorithm is also far lower than that without one, and the PLR for all three levels decrease as the load increases. The L0 service with the lowest level has the maximum PLR reduction of 2.24%; the L2 service with the highest level has the least PLR reduction of 0.47%, while the L1 has a reduction of 1.5%.
[TABLE 1.] Simulation parameters
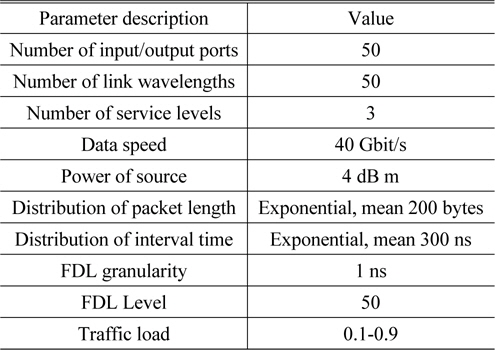
Simulation parameters
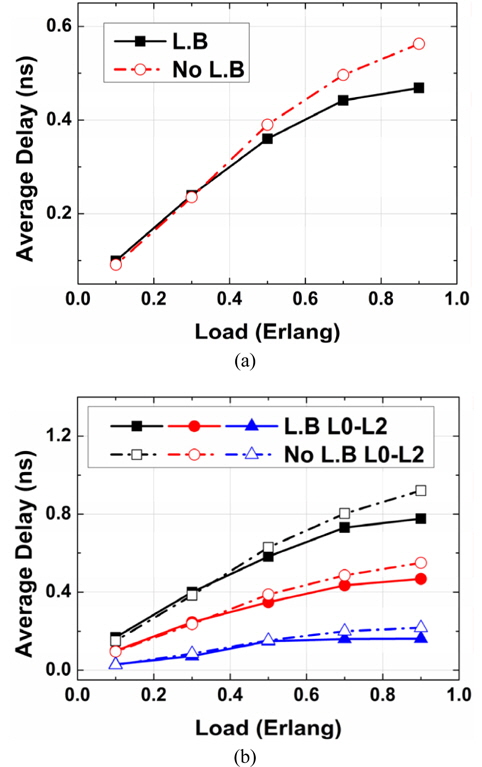
Figure 4 illustrates the average time delay for the three service levels and their total, with and without the balancing algorithm in the simulation platform. Compared to the situation without balancing algorithm, the performance with load balancing is better and improved in terms of average time delay. Figure 4(a) shows the total average time delay curve. We can observe that the average time delay increases when the load increases. Especially when the load is bigger than 0.5 Erlang, the average time delay with the algorithm is obviously lower than that without one. The average time delay is reduced by 0.09 ns, keeping below 0.46 ns. Figure 4(b) shows the average time delay versus load for the three different service levels. We can observe that when the load is greater than the threshold, the average time delay with the balancing algorithm is also far lower than that without one, and the average time delay of the three different levels increases as the load increases.
The L0 service with the lowest level has the maximum average time delay reduction of 0.14 ns; the L2 service with the highest level has the least average time delay reduction of 0.05 ns, while L1 has a reduction of 0.08 ns.
The simulation results show that the balancing algorithm can reasonably balance the asynchronous variant data flow according to the service levels and traffic distribution, and optimize the PLR and time delay for the different service levels correspondingly. The PLR and time delay can be reduced effectively, and the throughput increases when the load becomes higher.
This paper proposes a novel dynamic load-balancing algorithm to improve the performance, in terms of PLR and time delay, for an AOPS node with limited buffer and no wavelength converters, based on the data flow distribution and the service levels. The algorithm is demonstrated by simulation, the results showing that it can enhance the performance for the different service levels and overall, in terms of PLR and time delay in the node. The performance is improved with PLR reduction of 2.24% for different services maximally and 1.41% for the total, staying below 0.01%, and the time-delay reduction of 0.14 ns for different services maximally and 0.09 ns for the total, staying below 0.46 ns. QoS of high level is guaranteed, with optimized output balance and enlarged throughput.