In this study, we demonstrated multimodal nonlinear optical (NLO) microscopy integrated simultaneously with two-photon excitation fluorescence (TPEF), second-harmonic generation (SHG), and coherent anti-Stokes Raman scattering (CARS) in order to obtain targeted cellular and label-free images in an immunofluorescence assay of the atherosclerotic aorta from apolipoprotein E-deficient mice. The multimodal NLO microscope used two laser systems: picosecond (ps) and femtosecond (fs) pulsed lasers. A pair of ps-pulsed lights served for CARS (817 nm and 1064 nm) and SHG (817 nm) images; light from the fs-pulsed laser with the center wavelength of 720 nm was incident into the sample to obtain autofluorescence and targeted molecular TPEF images for high efficiency of fluorescence intensity without cross-talk. For multicolor-targeted TPEF imaging, we stained smooth-muscle cells and macrophages with fluorescent dyes (Alexa Fluor 350 and Alexa Fluor 594) for an immunofluorescence assay. Each depth-sectioned image consisted of 512 × 512 pixels with a field of view of 250 × 250 μm2, a lateral resolution of 0.4 μm, and an axial resolution of 1.3 μm. We obtained composite multicolor images with conventional label-free NLO images and targeted TPEF images in atherosclerotic-plaque samples. Multicolor 3-D imaging of atherosclerotic-plaque structural and functional composition will be helpful for understanding the pathogenesis of cardiovascular disease.
Nonlinear optical (NLO) microscopy is a powerful imaging technique because it can provide subcellular-scale 3-D images of biological samples. NLO microscopy provides high spatial resolution and deep penetration (several hundreds of micrometers) using near infrared (NIR) wavelength excitations compared to conventional confocal-fluorescence microscopy. In addition, NLO microscopy is sensitive to specific molecules and structures [1-6]. Recently, multimodal NLO microscopy has been extended to include two-photon excitation fluorescence (TPEF), second-harmonic generation (SHG), and coherence anti-Stokes Raman scattering (CARS) imaging on the same platform [7-9]. Multimodal NLO microscopy allows simultaneous visualization of different endogenous and exogenous structures and specific molecules in complex tissue samples. Most studies using multimodal NLO microscopy have been directed toward label-free microscopic imaging because of the high and structures [1-6]. Recently, multimodal NLO microscopy has been extended to include two-photon excitation fluorescence (TPEF), second-harmonic generation (SHG), and coherence anti-Stokes Raman scattering (CARS) imaging on the same platform [7-9]. Multimodal NLO microscopy allows simultaneous visualization of different endogenous and exogenous structures and specific molecules in complex tissue samples. Most studies using multimodal NLO microscopy have been directed toward label-free microscopic imaging because of the high
However, although there are advantages to label-free imaging, targeted imaging techniques using fluorescent protein or dye are still widely used in fields such as biology, biophysics, biochemistry, and neuroscience because multicolor, targeted images can provide a range of diagnostics simultaneously ‒ tracking of cell anatomy, movement, lineage, visualization of specific molecules, and recording of activity and signaling events [13]. Recently, multicolor imaging techniques in TPEF microscopy have been studied [14-16]. Kawano
In previous multimodal NLO microscopy papers, a single picosecond (ps) pulsed laser system, a single femtosecond (fs) pulsed laser system with a photonic crystal fiber (PCF), or multi-laser systems with a flip mirror for switching have been used [7-12]. However, in this study, we constructed a multimodal NLO microscope using lights that were combined of an fs-pulsed laser and a ps-pulsed laser incident into a sample, simultaneously. Generally, for label-free imaging, the fs-pulsed laser has been used to generate SHG and TPEF, simultaneously, because the intensities of SHG and TPEF at fs-pulsed light are higher than those at ps-pulsed light [17]. However, in this study, we used the ps-pulsed laser for SHG and the fs-pulsed laser for TPEF when the pulse duration and the wavelength were considered to obtain simultaneously multimodal and multicolor images without any laser parameter changing. As a biological sample, we used the atherosclerotic aorta from an apolipoprotein E-deficient (ApoE-/-) mouse with the goal of obtaining simultaneous label-free and targeted molecular images. Recently, atherosclerosis has been studied as one of the medical applications of multimodal NLO microscopy [18-22]. Atherosclerosis is a chronic, progressive arterial disease associated with lipid deposition and chronic inflammation [23, 24]. Atherosclerotic lesions have biomolecules associated with endothelial cells, extracellular lipid droplets, lipid-rich cells, low-density lipoprotein aggregates, collagen, and elastin. TPEF, SHG, and CARS have been demonstrated for imaging extracellular elastin, type-I collagen fibrils, and lipid-rich molecules, respectively, for non-stained atherosclerotic plaque [18-22]. However, analysis of label-free visualizations of elastin, collagen, and lipids are limited by complicated morphological or chemical changes in atherosclerotic progress. Therefore, NLO microscopy is required in addition for complementary information such as targeted molecular and cellular imaging, in order to understand the pathogenesis of cardiovascular disease. Immunoassay, as the gold standard, can provide identification of the cellular constituents in atherosclerosis studies of inflammatory disease involving several cell types, including macrophages (MΦs) and smooth muscle cells (SMCs) [25-27]. Immunohistochemistry (IHC) and immunofluorescence (IF) have been commonly used by pathologists in diagnostic evaluations in order to identify specific cells, organs, and structures [28, 29]. A limitation of these two methods is that they must be performed on thin slices of atherosclerosis samples. Although confocal laser scanning fluorescence microscopy has routinely been used for 3-D studies of samples, it has a limited penetration depth and the resolution deteriorates with depth [30, 31]. To avoid these problems, TPEF microscopy can be applied to IF assay. We used fluorescent dyes ― Alexa Fluor 350 and Alexa Fluor 594 ― in order to obtain multicolor, labeled TPEF images; we varied our excitation wavelength over the range 720-800 nm in order to determine the wavelength dependence of the two-photon absorption crosssections. By using multimodal NLO microscopy, information on plaque composition and structural organization has been obtained from multicolor label-free images; multicolor targeted images have been used to identify specific molecular and cellular information.
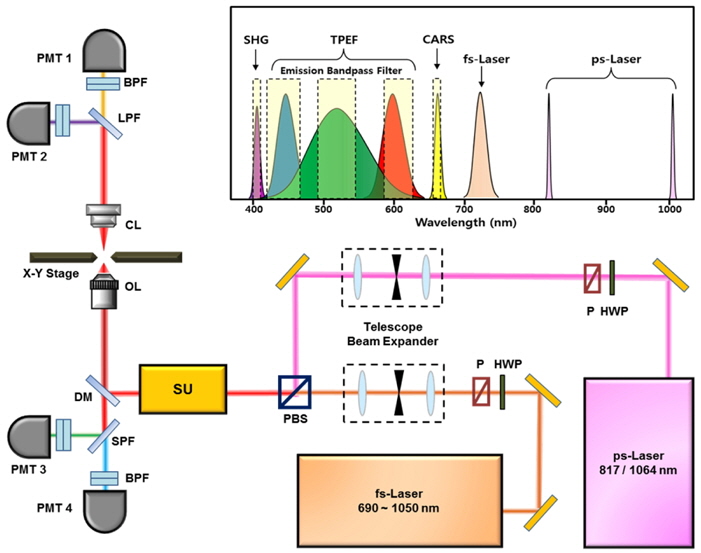
The schematic of the multimodal NLO microscope is shown in Fig. 1. In this study, we used two separate laser systems ― a ps-pulsed laser (
The CARS and SHG signal from the specimen were collected using a condenser lens (IX2-LWUCDA2, Olympus, Japan) with NA=0.55 and a 27-mm working distance in the forward direction and two external photomultiplier tubes (PMT1 and PMT2 in Fig. 1). To separate CARS and SHG signals, we used a dichroic mirror and placed 10-nm wide optical bandpass filters with center wavelengths of 660 nm and 405 nm, respectively, on the front of each PMT. The TPEF signals from the specimen were collected by the same objective in the backward (epi-) direction and separated by a dichroic mirror. The autofluorescent emission wavelength of elastin had the maximum efficiency at 520 nm (green). Therefore, the emission filters of blue (420-460 nm), green (490-540 nm), and red (610-650 nm) were used in order to avoid crosstalk among the fluorochromes. Images were displayed and analyzed using FluoView software (FV10-ASW, Olympus Corp., Japan). Our multimodal NLO microscope could acquire 3-D
III. ANIMAL MODEL AND TISSUE PREPARATION
Male ApoE-/- mice were purchased from Jackson Laboratory (Bar Harbor, ME). The ApoE-/- mice were fed a high-fat diet (#D12079B, Research Diets, New Brunswick, NJ) for 20-30 weeks and maintained under pathogen-free conditions at the Korea Research Institute of Bioscience and Biotechnology. All animal studies conformed to the tenets of the Institutional Animal Care and Use Committee of the Korea Research Institute of Bioscience and Biotechnology. Mice were euthanized with CO2 inhalation and then the vasculature was flushed with phosphate-buffered saline for 5 min. The aorta section from aortic root to thoracic aorta was isolated as described in our previous study [32]. After removing the perivascular connective tissue, a longitudinally opened descending aorta was mounted lumen-side down on a coverglass-bottom chamber, covered with a coverslip.
Cross-sectional and longitudinal-sectioned aortae of the mice were fixed with 4% paraformaldehyde for 10 min. and washed with phosphate-buffered saline (PBS) containing 0.1% bovine serum albumin (BSA). The fixed aortae were permeabilized with PBS containing 0.1% BSA, 0.5% Triton X-100, and 10% goat serum for 10 min. Then, specimens were incubated with anti-CD68 (1:100, Abcam; UK), anti-smooth muscle α-actin (1:200, Sigma, St. Louis, MO) antibodies at 4℃ overnight. The anti-smooth muscle α -actin is used to identify SMCs and the anti-CD68 antibody is used to target MΦs. After washing with PBS, specimens were incubated with secondary antibody-conjugated Alexa Fluor 350 and Alexa Fluor 594 (Molecular Probe, Eugene, OR) for 1 hour at room temperature and then loaded into a Lab-Tek II two-well chambered coverglass (Nalge Nunc International, Rochester NY) in order to obtain labeled TPEF images.
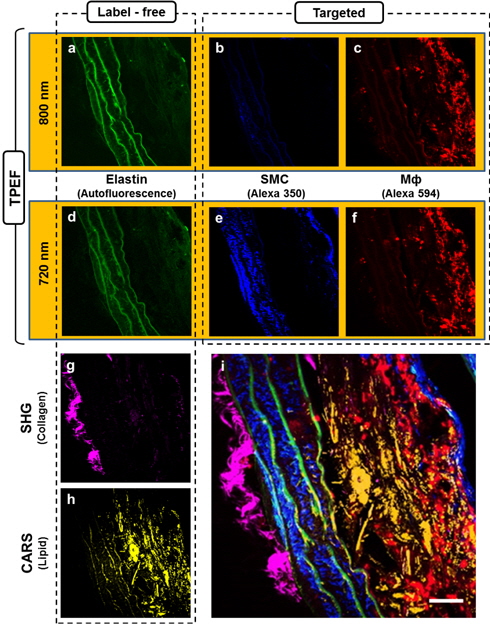
First, we carried out targeted molecular imaging in order to demonstrate the capability of our multimodal NLO microscopy and to characterize the TPEF images of atherosclerotic plaques. MΦ and SMC have been studied as important markers for the characterization of atherosclerotic plaques. Therefore, we obtained TPEF images of MΦ and SMC using traditional histological IF techniques in multimodal NLO microscopy. Before obtaining the TPEF images, we prepared the atherosclerotic aortae of the mice with slices 10 μm thick in the cross-sectional direction. Because the Alexa Fluor 350 and Alexa Fluor 594 used in this study have different two-photon absorption cross-sections [33], it is essential to select a suitable excitation wavelength for the two fluorophores. In order to determine a wavelength with high efficiency, we scanned the wavelength of the fs-pulsed laser from 720 to 800 nm. Figures 2(a) to (c) are TPEF images with an excitation wavelength of 800 nm. The TPEF images of Fig. 2(d) to (f) were obtained at 720 nm. Figures 2(a) and (d) show the typical label-free (autofluorescence) image of the elastin as a major component of the internal elastic lamina (IEL). We could not determine a difference between 800 nm- and 720 nm-excited autofluorescence images. However, SMCs (blue) stained with Alexa 350 could not be observed with 800-nm excitation. Excitation with 800 nm significantly reduced fluorescence intensities in the TPEF images because blue-color fluorophores such as DAPI, SYTO 40, and Alexa 350 have a maximum excitation-wavelength in the vicinity of 700 nm. On the contrary, the Alexa 594 has slightly lower emission quantum efficiency at 720 nm than at 800 nm. Nevertheless, the difference of emission quantum efficiency between 720 nm and 800 nm did not significantly affect the ability to obtain images as shown in Fig. 2(c) and (f). Therefore, we found that an excitation wavelength of 720 nm was suitable for obtaining simultaneously two targeted images from samples stained with Alexa 350 and Alex 594. TPEF signal intensity is inversely proportional to the pulse width of the laser [17]. The pulse duration of the fs-pulsed laser became longer because light passed through several optical components such as lenses, PBS, and the objective lens in our system. Therefore, we adjusted the negative dispersion value of the pre-compensator integrated within the laser in order to maximize the TPEF signal.
Figures 2(g) and (h) show SHG and CARS images corresponding to collagen fibrils and lipids, respectively. The collagen fibrils were predominantly distributed in adventitia imaged by SHG using the pump beam (817 nm) of the ps-pulsed laser and the optical bandpass filter with 405 ± 10 nm. SHG signals from the collagen fibrils could be generated from excitation at 720 nm by the fs-pulsed laser because the ps- and fs-pulsed lasers were simultaneously incident into the sample. However, the SHG signal could not be detected despite the use of PMTs having a spectral detection range of 196-900 nm because the anti-reflection coating of the condenser lens at forward direction was optimized at visible wavelength. In addition, the intensity of the SHG signal is sensitive to variations in the incident wavelength. The intensity of the SHG signal in collagen fibrils at longer wavelengths is higher than at shorter wavelengths [34]. Generally, it is well known that the pulse width of the pulsed laser also affects SHG signals. As the laser pulse width is shortened, the generated SHG signals become stronger [17]. However, we found that the SHG signals were more strongly dependent on the center wavelength of the excitation than on the pulse width. CARS imaging reveals significant lipid accumulation. The strong CARS signal from the foam cells specifically shows the distribution of lipid structures.
We could obtain two color-targeted TPEF images and one label-free TPEF image, which could be clearly distinguished without fluorophore crosstalk because of the use of a set of bandpass filters as shown in the inset graph of Fig. 1. However, we could simultaneously obtain only four images ― two targeted TPEF images, an SHG image, and a CARS image ― because our multimodal NLO microscope had only four PMTs. After acquiring four images, we changed the optical filter in one of PMTs to the backward direction and obtained the autofluorescence TPEF image of elastin. Finally, we could obtain the merged five-color image shown in Fig. 2 (i). As shown in Fig. 2 (i), the IEL were clearly identified in the media, SMCs were densely packed between IEL layers, and MΦs were rarely and randomly distributed on plaque lesions. This composite image verified that multimodal NLO microscopy offers simultaneous label-free and targeted molecular imaging. Our microscope system including FluoView software can be augmented with two additional PMTs in the backward direction. With the addition of two PMTs in combination with well-separated optical-bandpass filters and sample fluorophores, the microscope would be able to obtain simultaneous six-color label-free and targeted molecular images.
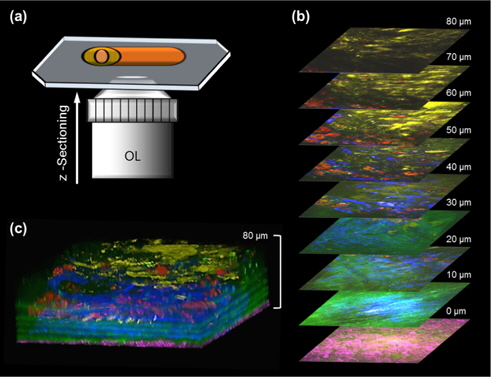
Figures 3 and Figure 4 are multi-color images of an atherosclerotic aorta, which was cut in the longitudinal direction as shown in Fig. 3(a). In order to visualize the 3-D structural information in atherosclerotic plaques, multi-color images were taken at successive 1-μm steps in the axial (
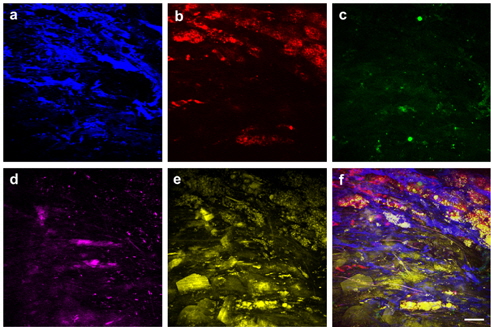
Figure 4 shows targeted cellular images of SMCs (a) and MΦs (b) using TPEF, along with representative multimodal NLO images of the elastin (c), the collagen (d), and the lipids (e) of the atherosclerotic plaques in another area of the specimen at the depth of approximately 50 μm from adventitia. SMCs were widely distributed between layers of IEL, similar to Fig. 3(b). In Fig. 4(c), the elastin could not be detected by TPEF because the elastin did not exist in this depth. As shown in Fig. 3(b), the elastin existed at a depth of approximately 10-30 μm. In addition, collagen fibrils were invisible in Fig. 4(d) because collagen fibrils located at 0-5 μm depth from adventitia were visualized. MΦs were clearly visible and were abundant underneath the lipid core in the form of macrophage-derived foam cells, as shown in Fig. 4(f). The composite image in Fig. 4(f) could be used to characterize the distribution of SMCs and MΦs as well as the specific composition of extracellular matrix (ECM) containing the IEL layer, the collagen structure, and the lipid accumulation. The multicolor 3-D image can reveal the interaction between the cell and the ECM as well as details of morphological and structural events. This multicolor 3-D imaging provides novel opportunities for mechanistic understanding of disease progressions. Advantages of our scheme are that a multicolor 3-D image can be acquired coincidentally by integrating independent nonlinear processes, and the single wavelength excitation of the multiple chromophores provides faster acquisition time than linear microscopy such as confocal-fluorescence microscopy. Additionally, this approach can be applied to a variety of organs imaging with the other target molecules and fluorophore combination in biomedical research fields. In this study, we applied targeted TPEF images to the SMCs and MΦs, which are closely related in inflammation and key roles in the pathogenesis of atherosclerosis. [36-38]. However, the use of various biomarkers in multimodal and multicolor NLO microscopy will be helpful for understanding the pathogenesis of cardiovascular disease [39].
We visualized key aspects of atherosclerotic processes — such as SMCs, MΦs, foam cells, and the ECM — using multimodal NLO microscopy in a labeled and label-free manner. We obtained TPEF, SHG, and CARS images of elastin, collagen fibrils, and lipids, respectively, without staining. Additionally, we used fluorescent dyes to obtain multicolor TPEF images of the MΦs and SMCs in the atherosclerotic aortae of ApoE-/- mice. The combination of label-free and targeted molecular NLO imaging modalities is particularly advantageous for simultaneously identifying the location and properties of the cellular components and morphological structures in atherosclerotic plaques. In particular, because of the larger penetration depth compared with conventional immunofluorescence assays, the TPEF images of the selective and targeted molecules have the potential to expand the understanding of the complex interplay between the targeted agent and the ECM. Our approach will be useful in various biomedical fields such as biology, biophysics, biochemistry, and neuroscience as well as understanding the pathogenesis of cardiovascular disease.