

Lincomycin is one of the major species among the Pharmaceuticals and Personal Care Products (PPCPs) detected from the four major rivers in Korea. The structure characterization was performed of six degradation products of lincomycin formed under the irradiation of electron beam, and the degradation efficiency as a function of the various irradiation dose and sample concentration was investigated. Electron beam (10 MeV, 0.5 mA and 5 kW) experiments for the structural characterization of degradation products that are fortified with lincomycin, were performed at the dose of 10 kGy. The separation of degradation products and lincomycin was carried out using a C18 column (2.1×100 mm, 3.5 μm), using gradient elution with 20 mM ammonium acetate and acetonitrile. The structures of six degradation products of lincomycin were proposed by interpretation of mass spectra and chromatograms by LC-MS/MS. The mass fragmentation pathways of mass spectra in tandem mass spectrometry were also proposed. Experiments were performed of the degradation efficiency as a function of the irradiation dose intensity and the initial concentration of lincomycin in an aqueous environment. In addition, increased degradation efficiency was observed with a higher dose of electron beam and lower concentration.
Pharmaceuticals and personal care products (PPCPs) are a chemical group used extensively in medicines and personal hygiene products.1 It is estimated that the number of PPCPs being used in the medical field exceeds 3000.2 Lincomycin is a well-established antibiotic pharmaceutical compound commonly used to control post-weaning diarrhea and effective against Gram-positive organisms in human and veterinary medicine. It is excreted in the urine as a mixture of the parent drug and its conjugated metabolite.3,4
In recent years, a number of PPCPs have been detected in aqueous environmental systems, including rivers, lakes, and reservoirs. Among the 30 PPCPs surveyed in Korea, lincomycin was detected with relatively high concentration and frequency. Lincomycin has been detected in the range of 0.16 - 16.99 ng/mL in the surface water of four major rivers of Korea.5-7
Due to the incomplete removal of PPCPs during treatment at wastewater treatment plants (WWTPs), considerable amounts of PPCPs remain in WWTP effluents.8 Because most PPCPs are relatively soluble in water and have little biological accumulation, they may not accumulate with high concentration in the environment and biometrics. However, because these PPCPs cannot be made biodegradable for the maintenance of the pharmaceutical action, they can enter into the environmental system without the metabolism of the active functional group in the chemical structure. Being designed for human and veterinary medicine, PPCPs may be of concern because of their potential adverse effects on organisms in the environment.9
A major source of environmental PPCPs is the discharge from wastewater treatment plants (WWTPs), which contains residual PPCPs and their metabolites, and certain disinfection byproducts (DBPs).10-15 PPCP removal rates vary depending on the wastewater treatment technology used and the compound selected.16
Minimal information is available on the removal of PPCPs using electron beam treatment,17 especially for lincomycin. In this paper, structure identification of the degradation products by electron beam was performed using the interpretation of mass spectra and chromatographic data of LC/MS/MS. In addition, the extent of degradation according to the irradiation dose intensity of the electron beam and the initial concentration level of lincomycin in the aqueous environment were investigated.
>
Reagents, Materials, and Instrumentation
Before the experimental, all glassware was washed with detergent, methanol, acetone, and purified water consecutively, and dried in a drying oven. Reagent water and acetonitrile of HPLC grade were purchased from J. T. Baker (NJ, USA). Lincomycin standard and ammonium acetate were obtained from Sigma-Aldrich (Germany) and Merck (Darmstadt, Germany), respectively. The working standard solution was prepared by dissolving lincomycin in water.
LC/MS/MS was an Agilent 1200 series HPLC equipped with a binary pump system and coupled Agilent 6410 triple quadrupole mass spectrometer (Palo Alto, USA) with an electrospray ionization (ESI) source. The chromatographic separation on the HPLC-MS/MS system was performed on a C18 column (100 mm length × 2.1 mm i.d., 3.5 μm particle size). The mobile phases were 20 mM ammonium acetate (A) and acetonitrile (B), and were used with a gradient system (Table 1). The operating parameters for the tandem mass spectrometer were as follows: ionization mode, positive (+) electrospray ionization (ESI); capillary voltage, 4 kV; temperature of nebulizer, 350℃; drying gas flow, 8 L/min (N2); nebulizer pressure, 35 psi (Table 1).
[Table 1.] Analytical instrumental conditions for LC/MS/MS
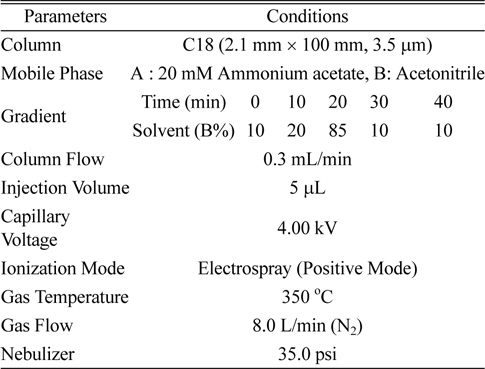
Analytical instrumental conditions for LC/MS/MS
An E-beam irradiation experiment was performed using an electron accelerator (Model: UELV-10-10s; RF energy source: Klystron; e-beam energy: 10 MeV; current: 0.5 mA, and output power: 5 kW) (Korea Atomic Energy Research Institute, Korea).
The aqueous samples were prepared by spiking a lincomycin standard in the water. For the structural identification of the degradation products, the degradation of lincomycin in an aqueous sample was performed by irradiating with an electron beam accelerator at a dose rate of 10 kGy/scan with beam energy of 10 MeV under a nitrogen environment. For the investigation of the degradation efficiency, an electron beam with doses of 0.1, 0.3, 0.5, and 1 kGy was irradiated to the spiked aqueous samples. The irradiated samples were stored in a refrigerator at 4℃ and filtered with a 0.45 μm syringe filter before LC/MS/MS analysis.
>
Chromatographic separation of the degradation products
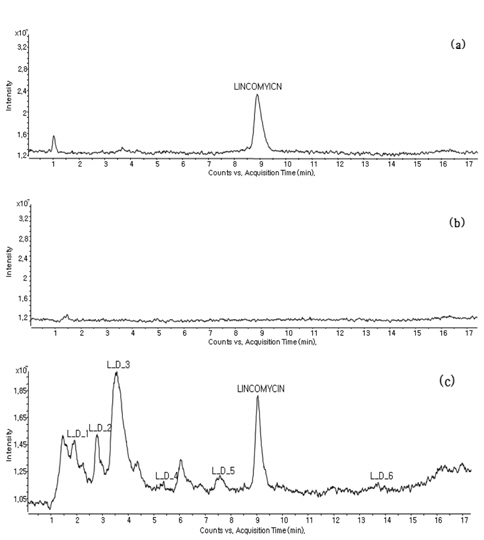
The irradiated sample (dose rate: 10 kGy) containing the lincomycin and its degradation was directly analyzed using the LC-MS/MS in full scan mode after filtering using a 0.45 μm syringe filter. The degradation products were recognized by comparing of the chromatograms of a nonirradiated lincomycin standard sample, an irradiated blank sample and an irradiated lincomycin spiked sample (500 μg/mL).
Lincomycin was detected at the retention time of 8.8 min (Figure 1 (a)) from a non-irradiated standard sample; no peak was observed in the irradiated blank sample (Figure 1 (b)), and several peaks including the parent compound (lincomycin) were found in the irradiated lincomycin spiked sample (Figure 1 (c)).
>
Chemical structure identification of the degradation products
The assigned peaks as degradation products according to the chromatograms of LC-MS/MS of the pseudo-molecular ion [M+H]+ were identified from the full scan mode mass spectra. Because the mass spectra which are obtained from the full scan mode with ESI are few fragment ions, the identification of the degradation products by the interpretation of full scan spectra is not easy. Therefore, product ion mass spectra obtained from the collision of the precursor ion (i.e. product ion scan) were used to identify structures.
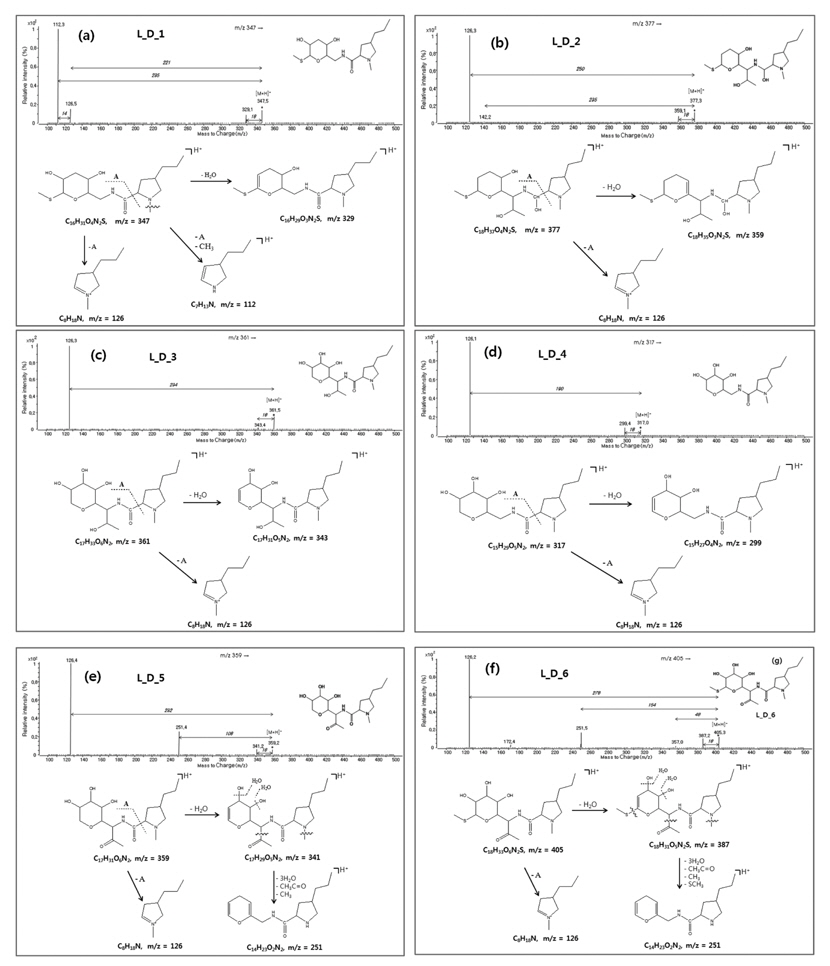
Several degradation products were recognized from the LC-MS/MS chromatogram. However, because elucidation of all recognized peaks through chromatograms and mass spectra was very complex and difficult, only the chemical structures of six species are proposed. The pseudo-molecular ion [M+H]+ and retention time of six degradation products were as follows: L_D_1: m/z 347, 1.8 min; L_D_2: m/z 377, 2.6 min; L_D_3; m/z 361, 3.2 min; L_D_4: m/z 317, 4.9 min; L_D_5: m/z 359, 6.9 min; L_D_6: m/z 405, 12.8 min.
The pseudo-molecular ion, which can be used to predict the molecular weight of the compound, was observed from six compounds, and the product ion [M-H2O+H]+ in which the water molecule is removed from the pseudo-molecular ion (precursor ion) was found commonly in the mass spectra of six compounds.
The proposed chemical structures through the interpretation of chromatographs and mass spectra for each degradation products are as follows:
L_D_1: As depicted in Figure 2 (a), this was found at a retention time of 1.8 min and could be assigned as a compound in which the ethanol and a hydroxyl group are removed from the chemical structure of lincomycin. Because the pseudo-molecular ion [M+H]+ was detected at m/z 347, the molecular weight of this degradation product is assigned as 346.
The fragment ion [M-H2O+H]+ was observed at m/z 329. The product ion at m/z 126 corresponds to 3-propyl-
L_D_2: This is assumed to be the degradation product which included the loss of two -OHs from tetrahydro-2-(methylthio)-2H-pyran-3,4,5-triol and the ketone (-C=O) group was oxidized to alcohol (-OH) (Figure 2 (b)). The pseudo-molecular ion was observed at m/z 377 and the product ions were observed at m/z 359 corresponding to [M-H2O+H]+. The ion with the most intensity of m/z 126 was formed by the loss of tetrahydro-2-(2-hydroxy-1-(hydroxymethylamino)propyl)-6-(methylthio)-2H-pyran-3-ol from molecular structure.
L_D_3: This compound is proposed to be the degradation product by a methanethiol cleavage from the lincomycin parent drug as shown in Figure 2 (c). The pseudo-molecular ion [M+H]+ was observed at m/z 361. The product ions at m/z 343 corresponds to the loss of water (-H2O) and the product ion at m/z 126 corresponds to 3-propyl-
L_D_4: This degradation product is predicted as a compound (m.w. 316) which is formed by the loss of the ethanol group from L_D_3 (Figure 2 (d)). As shown in Figure 2, the pseudo-molecular ion [M+H]+ was detected at m/z 317 and the product ion at m/z 299 corresponds to the [M-H2O+H]+. Also, the base ion at m/z 126 corresponds to 3-propyl-
L_D_5: The pseudo-molecular ion [M+H]+ was detected at m/z 359, and this compound is proposed to be the molecule formed by the loss of the methanethiol group from the tetrahydro-2H-pyran ring of lincomycin and the reduction (-C=O) of –OH from the ethanol group of lincomycin. As depicted in Figure 2 (e), the product ions were observed at m/z 126 corresponding to 3-propyl-
L_D_6: This degradation product is assumed to be the compound in which one hydroxyl (-OH) group in tetrahydro-2-(methylthio)-2H-pyran-3,4,5-triol was changed to the ketone (-C=O) group. The pseudo-molecular ion [M+H]+ was observed at m/z 405 which is 2 Da less than the molecular weight of lincomycin, and the position of the ketone group is proposed as #3 in tetrahydro-2-(methylthio)-2H-pyran-3,4,5-triol. The common ion at m/z 126 was observed and m/z 251 was detected similarly to L_D_5 (Figure 2 (f)).
>
Degradation efficiency according to the dose of electron beam
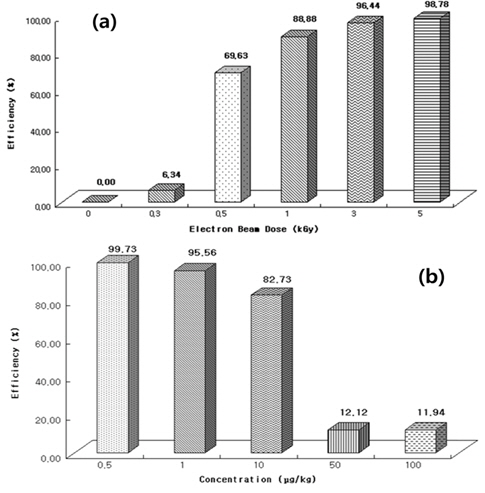
The experiments of degradation efficiency according to the electron beam intensity were performed in the 100 μg/kg standard aqueous solution under the various absorbed dose (0.3, 0.5, 1, 3, and 5 kGy). The calculation of the degradation efficiency was achieved by the integration of peak obtained from the MRM (multiple reaction monitoring) mode in LC-ESI(+)-MS/MS, and the precursor ion and characteristic ions of lincomycin and their degradation products for the quantitation are shown in Table 2.
[Table 2.] Precursor ion and characteristic ions of lincomycin and its degradation products
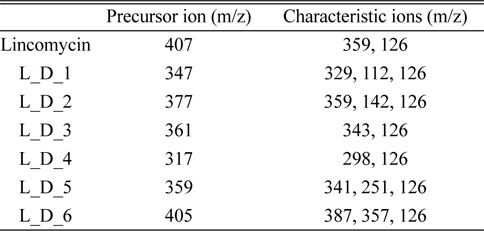
Precursor ion and characteristic ions of lincomycin and its degradation products
As shown in Figure 3 (a), the degradation profile as a function of absorbed dose shows the significant degradation from the 0.5 kGy, and the irradiation of lincomycin with 5 kGy almost reached complete degradation of lincomycin. Therefore, for the complete removal or degradation of lincomycin from the aqueous sample, the absorbed dose of 5 kGy is required.
>
Degradation efficiency according to the sample concentration
Figure 3 (b) shows the degradation profile of lincomycin as a function of the initial sample concentration. The experiments of the degradation efficiency as a function of sample concentration (0.5, 1, 10, 50, and 100 μg/kg) were performed at the absorbed dose of 0.3 kGy. The degradation efficiency may be depending on the amount and variety of matrix in sample, and because the aims of this study were to observe the tendency of degradation according to the irradiation dose and sample concentration, the exact quantitative analysis for the degradation products was not necessary. And then, in this study, the exact amount of lincomycin was not spiked in aqueous sample, and the degradation efficiency of 100 μg/kg at 0.3 KGy dose (Figure 3 (a)) and 0.3 KGy dose in 100 μg/kg of sample concentration (Figure 3 (b)) were shown. A decreasing trend of the degradation efficiency was observed with increasing concentration. A degradation efficiency of greater than 80% was observed in the concentration range of 0.5~10 μg/kg, and in the concentration of 50 and 100 μg/ kg, only the degradation efficiencies of 12.1% and 11.9%, respectively, were observed.
This paper proposes the structures of the degradation products of lincomycin under an electron beam by the interpretation of mass spectra with LC-ESI-MS/MS. This allowed structural identification as well as elucidation of the fragmentation pathways for six degradation products that were formed in an aqueous environment under electron beam irradiation. In the investigation of degradation efficiency, the irradiation dose of 3 kGy was required to achieve more than 95% degradation of 100 μg/kg lincomycin in the aqueous sample. For the treatment of the aqueous sample containing less than 0.5 μg/kg lincomycin, only the absorbed dose of 0.3 kGy was required. The results imply that the effective treatment of the aqueous environmental sample containing high concentration lincomycin is needed for the higher irradiation dose of electron beam. The results can provide basic information of the wastewater treatment and the toxic study after wastewater treatment by electron beam.

