The objective of this study was to elucidate the physicochemical characteristics of gelatin extracted from jellyfish Rhopilema hispidum. We investigated the proximate composition, amino acids, gel strength, gelling/melting points, dynamic viscoelastic properties, and viscosity of jellyfish gelatin. Jellyfish gelatin contained 12.2% moisture, 1.5% lipid, 2.1% ash, and 84.8% protein. Glycine, hydroxyproline, proline, and alanine were the predominant amino acids. The gelatin showed a gel strength of 31.2 kPa, a gelling point of 18.0°C, and melting point of 22.3°C. The gelatin was composed of α1-chain, α2-chain, β-chain, and γ-chain. During cooling and heating process, jellyfish gelatin showed lower elastic modulus (G') and loss modulus (G") values than mammalian gelatin. Jellyfish gelatin did not show superior rheological properties to mammalian gelatin, like other fish gelatin; however, it can be used in various food and cosmetic products not requiring high gel strength.
Gelatin, a denatured protein derived from collagen by thermal hydrolysis, has a rheological property of thermo-reversible transformation between sol and gel (Stainsby, 1987; Cho et al., 2004). As an important gelling agent, gelatin has widely been applied in the food, pharmaceutical, cosmetic, and photographic industries (Cho et al., 2004, 2005).
Most commercial gelatin is produced from the by-products of mammals such as pigs and cattle. However, bovine spongiform encephalopathy (BSE) and foot/mouth diseases have caused human health problems, and thus, mammal gelatin sources have been limited (Cho et al., 2005). As a replacement, fish gelatin has been widely investigated. In addition, religious constraints (Kosher and Halal foods) and increasing health consciousness on the part of consumers have also resulted in a high demand for fish gelatin (Kittiphattanabawon et al., 2005). Numerous studies have reported production and physicochemical properties of gelatin from various fish sources, such as harp seals (
Although the physicochemical properties of gelatin from various fish sources are known, information on jellyfish (
Salted jellyfish were provided by Korea Jellyfish Inc. (Busan, Korea) and washed three times for salt removal. Samples were kept at –20°C until gelatin extraction. The extraction of gelatin was performed according to Cho et al. (2005). The jellyfish were washed with tap water for 12 h to remove foreign matter and then chopped. Samples were treated with 5 volumes (v/w) of 2% NaOH in a shaking incubator (200 rpm) at 10°C for 8 h to remove non-collagen protein and to swell the tissues. Following pretreatment, samples were neutralized with 6 N HCl and washed with distilled water (DW). Gelatin extraction was performed in 6 volumes (v/w) of DW at 60°C for 5 h while agitated. The extracted solutions were filtered using filter paper (No. 5A; Advantec, Tokyo, Japan), concentrated at 60°C, and dried at 50°C for 24 h in a hot-air dryer (WFO-601SD; EYELA, Tokyo, Japan). Gelatin yields were 38.5%:
>
Measurement of proximate components and pH
Moisture content (oven-drying procedure), crude protein (Kjeldahl), lipid (ether extraction), and ash content were estimated by the Association of Analytical Communites (AOAC, 2006). A factor of 5.55 was used to convert nitrogen values to gelatin protein (Sarbon et al., 2013). pH was measured by melting 0.1 mg gelatin in 10 mL distilled water at 60°C with a pH meter (Accumet model 15; Fisher Scientific, Waltham, MA, USA). All analyses were replicated three times.
Extracted gelatin (30 mg) was dissolved in 10 mL of 6 N HCl containing 0.1% phenol and hydrolyzed in vacuum-sealed glass tubes at 110°C for 24 h using norleucine as the internal standard. The hydrolysates were filtered with a glass filter and vacuum-concentrated at 60°C. The concentrates were made up with 10 mL with citrate phosphate (pH 2.2) and then analyzed with an automatic amino acid analyzer (S-433H; Sycam GmbH, Eresing, Germany).
>
Sodium dodecyl sulfate?polyacrylamide gel electrophoresis (SDS-PAGE)
SDS-PAGE was performed according to Laemmli (1970). For polyacrylamide gels, 5% stacking gel and 6% separating gel were used. Gelatin solution (10 mg/mL) and tracking dye mixtures containing 0.5 M Tris–HCl buffer (pH 6.8), 5% 2-mercaptoethanol, 20% glycerol, and 0.1% bromophenol 300blue were heated at 100°C for 5 min. After heating, the solution was injected on the gel, and electrophoresis was performed at 15 mA/gel with Mini-Protean 3 (Bio-Rad Laboratories, Hercules, CA, USA). The gel was separated, dyed in 0.25% (w/v) Comassie Brilliant Blue R250, and decolorized. Calf skin collagen (Sigma-Aldrich, St. Louis, CA, USA) was used as the marker protein.
Gel strength was measured according to Cho et al. (2005) using rheometry (Compac-100; Sun Scientific Co., Tokyo, Japan). Gelatin was dissolved with DW (6.67%, w/v) at 60°C for 30 min until completely dispersed and then kept at 7°C for 17 h. After cool maturation, gel strength was measured with the following conditions: plunger, 12.7 mm diameter; penetration depth, 4 mm; penetration speed, 2 cm/min.
>
Measurement of gelling and melting points
Gelling and melting points were measured as described by Gudmundsson (2002) and Cho et al. (2005). The gelling point was evaluated from the intersection point of the elastic modulus (G', Pa) and the loss modulus (G", Pa) during the cooling process. The melting point was determined during the heating process in the same manner.
>
Measurement of dynamic viscoelastic properties
Dynamic viscoelastic properties were measured with a rheometer (Rheostress 1 RS30; HAAKE GmbH, Vreden, Germany). The concentration of gelatin was converted to 6.67% with a water bath at 60°C. The measurement was performed at a frequency of 1 Hz and a temperature of 0.5°C/min; oscillating applied stress was at 3 Pa and the gap was at 4.2 mm. The temperature ranges were divided into two for measurement of the elastic modulus (G', Pa) and loss modulus (G", Pa): a cool-down from 40°C to 5°C and a heating from 5°C to 40°C.
Viscosity was measured according to Kittiphattanabawon et al. (2005) with a slight modification. Gelatin (0.04%, 100 mL) was added to 0.1 M acetic acid at 60°C. Spindle No. 40 of a Brookfield Synchorolectic Viscometer (model DV II+; Brookfield Engineering Lab, Mt. Prospect, IL, USA) was used to measure viscosity at 60 rpm. Temperatures ranged from 15°C to 50°C, at 15°C/min. The experiment was carried out after the solution was maintained at each temperature for 10 min.
>
Measurement of denaturation temperature
The denaturation temperature was measured according to Kimura et al. (1988) with a slight modification. The denaturation temperature was expressed by measuring the viscosity of gelatin (0.03%, 5 mL) at intervals of 5°C between 20°C and 50°C with an Ostwald–Fenske viscometer (Cannon Instrument Co., State College, PA, USA). During the measurement, the temperature of the gelatin was maintained for 10 min at the temperature ranges before the experiment was conducted. The denaturation temperature (Td) was evaluated at the half position of the measured value.
All experiments were analyzed with three repetitions per sample using one-way analysis of variance (ANOVA; α = 0.05). Means were separated using Duncan’s multiple range test (α = 0.05). Regression analysis for gel strength as a function of gelatin concentration and maturation time was performed using the REG procedure in SAS (version 8.01; SAS Institute, Cary, NC, USA).
The proximate composition and pH value of jellyfish gelatin are shown in Table 1. Jellyfish gelatin contained 12.2% moisture, 75.3% crude protein, 1.5% crude lipid, and 2.1% crude ash. The ash content of gelatin plays an important role in the quality of gelatin. According to the US standards of food (Gelatin, FCC, 1994), the maximum ash content of gelatin is 3%. Thus, jellyfish gelatin contains less ash than the regulation level. The pH value of jellyfish gelatin was 7.32.
[Table 1.] Proximate composition and pH value of gelatin extracted from jellyfish Rhopilema hispidum
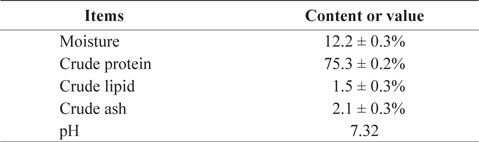
Proximate composition and pH value of gelatin extracted from jellyfish Rhopilema hispidum
Jellyfish gelatin contained high levels of glycine (Gly, 18.90%), proline (Pro, 8.15%), and hydroxyproline (Hyp, 13.93%; Table 2). This originates from a repeated structure (Gly–Pro–Hyp) of collagen, the precursor of gelatin. Ledward (1986) reported that gelatin has a repeated structure of Gly–X–Y. With Pro and Hyp in the X and Y positions, the gelatin structure is stable. The total content of Gly–Pro–Hyp is an important factor that expresses thermal stability in gelatin (Burjandze, 2000). Imino acids are involved in formation of hydrogen bonds (Ledward, 1986). Generally, mammalian gelatin contains more imino acids (Pro and Hyp) than fish gelatin (Gilsenan and Ross-Murphy, 2000; Haug et al., 2004). In the present study, jellyfish gelatin showed lower imino acid content than mammalian gelatin, as reported in previous studies. The contents of alanine and lysine in jellyfish gelatin were 6.88% and 2.49%, respectively. Gómez-Guillén et al. (2002) reported that the low content of alanine causes poor gelation, and lysine stabilizes the gelatin structure by forming crosslinking structures between chains.
[Table 2.] Amino acid composition of gelatin extracted from jellyfish Rhopilema hispidum
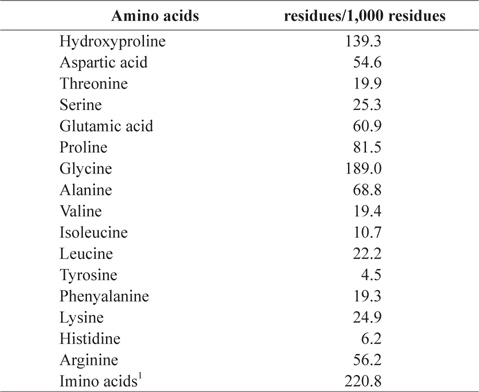
Amino acid composition of gelatin extracted from jellyfish Rhopilema hispidum
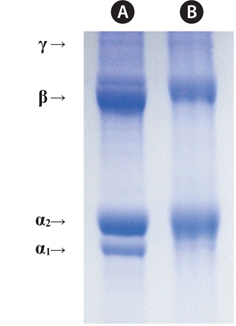
Fig. 1. shows electrophoretic patterns of jellyfish gelatin and calf skin collagen (a marker protein) by SDS-PAGE. The calf skin collagen was composed of α-chains (α1:α2 = 1:2, <95 kDa), the β-component (cross-linked dimer of α-chains, <200 kDa), and the γ-component (cross-linked trimer of α-chains; Gómez-Guillén et al., 2002). Jellyfish gelatin was found to be composed of the α1-chain, the α2-chain, the β-chain, and the γ-chain; the α1-chain was less clear than that in calf skin collagen. In bone gelatin, the lower content of high-molecular-weight fractions (β- and γ-chains) was associated with lower viscosity, melting- and setting points, and a longer setting time (Muyonga et al., 2004).
>
Gel strength, and gelling and melting points
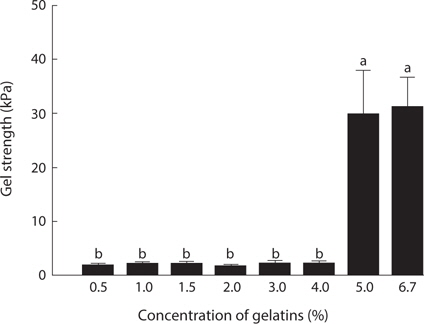
In the assessment of gelatin quality, physical properties such as gel strength, and gelling and melting points are important. The gelation of gelatin occurs by physical cross-linking, leading to the formation of junction zones and ultimately a three-dimensional branched network (Gilsenan and Ross-Murphy, 2000). Generally, fish gelatin shows lower gel strength than mammalian gelatin (Norland, 1987; Choi and Regenstein, 2000). Among fish, tropical fish such as tilapia and tuna possesses a superior gel strength to cold-water fish such as cod (Gudmundsson and Hafsteinsson, 1997; Gómez-Guillén et al., 2002; Cho et al., 2005). The gel strength (31.2 kPa) of jellyfish gelatin was lower than that of porcine (147.4 kPa) and bovine (107.9 kPa) gelatin (data not shown). Fig. 2 shows the changes in gel strength of jellyfish gelatin as affected by concentration. Jellyfish gelatin formed a gel at higher concentrations than porcine and bovine gelatin (5% vs. 1.5%; data not shown). Gel strength is a function of complex interactions determined by the amino acid composition, and the ratio of α-chains, and the amount of β-components (Cho et al., 2004). Gómez-Guillén et al. (2002) reported that the gel structure of gelatin is more stable when the imino acid (Hyp and Pro) content is higher, and when the amount of aggregates of higher molecular weight is lower. The lower gel strength in jellyfish gelatin is likely due to a lower amount of total Gly+Hyp+Pro, which stabilizes gelatin structures.
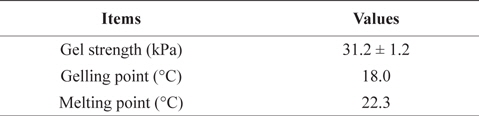
Gelling and melting points are also important indicators of gelatin quality. Generally, mammalian gelatin possesses higher gelling and melting points than fish gelatin (Choi and Regenstein, 2000; Gilsenan and Ross-Murphy, 2000; Gudmundsson, 2002). The gelling and melting points of jellyfish gelatin were 18.0°C and 22.3°C, respectively (Table 3). Mammalian gelatin has a much higher gel set temperature than both warm- and cold-water fish gelatin (Avena-Bustillos et al., 2006). Cho et al. (2005) reported that the respective gelling and melting points of mammalian gelatin were 23.8°C and 33.8°C for bovine gelatin, and 25.6°C and 36.5°C for porcine gelatin. The gelling and melting points of jellyfish gelatin were lower than those of mammalian gelatin. This tendency has been reported in previous studies on fish gelatin, such as that from tuna (Cho et al., 2005) and tilapia (Gilsenan and Ross-Murphy, 2000; Gudmundsson, 2002). These results suggest that jellyfish gelatin has useful physical properties different from mammalian gelatin.

Gel strength, gelling point and melting points of gelatin extracted from jellyfish Rhopilema hispidum
>
Dynamic viscoelastic properties
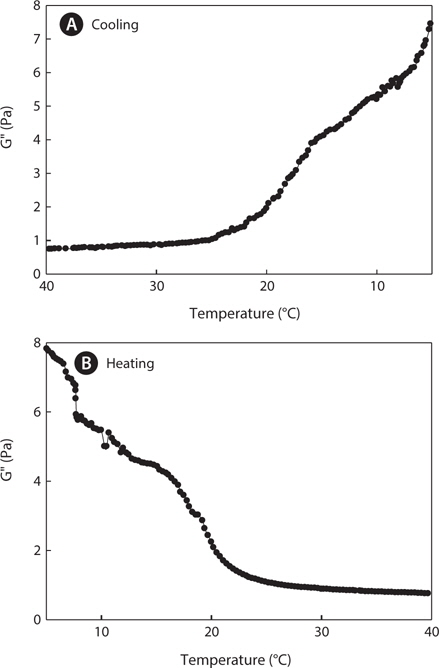
Dynamic viscoelastic profiles were measured during the cooling (40°C–5°C) and heating (5°C–40°C) processes at a rate of 0.5°C/min. Figs. 3 and 4 show changes in the elastic modulus (G', Pa) and the loss modulus (G", Pa), respectively. The elastic modulus (G') and the loss modulus (G") are important indicators for the gelling ability of gelatin. In general, when the value of G" is higher than the value of G', a state of sol occurs, whereas the opposite trend results in a state of gel. The intersection point of G' and G" shows the gelling point (Winter and Chambon, 1986). The G' values of jellyfish gelatin sharply increased when the temperature decreased during cooling (<18°C), whereas G" values gradually increased. G' and G" values of gelatin at 5°C were higher during the heating process than they were at 5°C during the cooling process because the gelatin gel continued to stabilize for a few minutes until measurement began. Gelatin with larger elastic modulus values, also indicated by higher gelation temperatures, contained higher concentrations of helical structures (Joly- Duhamel et al., 2002), indicating that mammalian gelatin possesses a higher melting point and is more thermostable than jellyfish gelatin.
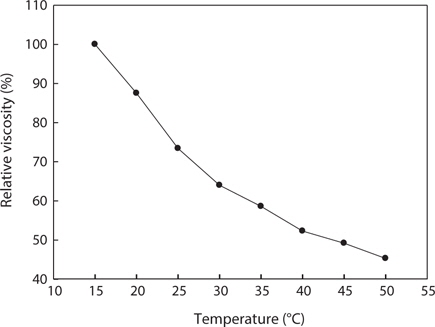
Fig. 5. shows changes in the relative viscosity of jellyfish gelatin solution (0.04%, w/v) at different temperatures. At lower temperatures, the gelatin molecules begin to form triple helical junction zones to develop more cross-linking and to eventually develop some network structure; the viscosity also rapidly increases (Avena-Bustillos et al., 2006). At higher temperatures, the gelatin molecules behaved as random coils in solution, and all gelatins had low viscosity. When a gelatin solution undergoes heat treatment, the hydrogen bonds are broken and viscosity decreases (Nagai et al., 1999; Nagai and Suzuki, 2000, 2002). The viscosity of jellyfish gelatin solution tended to decrease rapidly until the temperature reached 32°C and decreased gradually between 33°C and 50°C. According to Kittiphattanabawon et al. (2005), when gelatin was extracted from the bones and skin of bigeye snapper, the viscosity of the gelatin decreased gradually between 35°C and 50°C. The change in the viscosity of jellyfish gelatin showed a similar tendency.