검색 전체 메뉴
PDF
맨 위로
OA 학술지
Iridescent Specular Structural Colors of Two-Dimensional Periodic Diffraction Gratings
  • 비영리 CC BY-NC
  • 비영리 CC BY-NC
ABSTRACT
Iridescent Specular Structural Colors of Two-Dimensional Periodic Diffraction Gratings
KEYWORD
Diffraction grating , Iridescence , Structural color , Numerical modeling
  • I. INTRODUCTION

    Color is a fundamental constituent of culture and technology. Basic and applied research on coloring materials has been intensively conducted for a long time. Conventional coloring mechanisms originate inherently from the selective absorption and reflection of light by the coloring materials. In liquid crystal displays (LCDs), color filters are fabricated with absorptive pigments or dyes containing red, green, and blue color constituents [1]. In Denisyuk’s reflection color holography [2, 3], R(red, 638 nm), G (green, 532 nm), and B (blue, 450 nm) highly coherent lasers are illuminated on object surfaces, and the selective optical color-reflection waves on the object surfaces are recorded as the fringe patterns of refractive index in volume-hologram media. Interestingly, the resultant volume-hologram media produce full-color holographic images, based on a color-selective volume diffraction mechanism. The full-color volume holograms can be considered as excellent structural color media. Any periodic optical structures, such as classical diffraction gratings, show diffractive structure-dependent iridescent color patterns.

    Recently, novel concepts and technologies in the field of nanophotonics have been applied to create new technologies for structural colors. Highly scalable and practical transmission color filters of subwavelength surface binary gratings, based on guided-mode resonance (GMR), were reported [4, 5]. Enhanced tunable color-filter devices were operated via active electro-optic control of surface-plasmon resonance (SPR) [6], but the intrinsic dissipative loss in metal decreases the transmission efficiency of SPR-based color filters and hinders their practicality [6-8]. Nonabsorbing structural representation color by means of superparamagnetic colloidal nanocrystal clusters, which is magnetically tunable and lithographically fixable, was also reported [9, 10], butits one-dimensional structure is known to exhibit iridescence.

    The structural color generated by a diffraction grating has been understood as a diffractive chromatic dispersion effect, but has not been considered for exploitation in coloring applications, such as consumer product decoration, colorful artistic surface lettering, and color specular holography. In this paper we investigate the mechanism of the structural color appearing in the specular reflection on the surface of a binary diffraction grating, and its feasibility for applications. We introduce a theoretical model of the specular structural colors of binary diffraction gratings based on nonparaxial diffraction theory [11], and analyze the color-representation range of specular-reflection light in the standard CIE 1931 chromaticity diagram, to seek the optimal structural conditions to maximize the color-representation range.

    This paper is organized as follows. In section 2, based on nonparaxial diffraction theory the mathematical modeling of specular structural color of a binary diffraction grating is depicted. In section 3, the color-representation range of the binary diffraction grating and the dependence of specular structural color on the structural parameters of gratings are analyzed on the standard CIE 1931 chromaticity diagram. Finally, concluding remarks are given.

    II. MODELING OF SPECULAR STRUCTURAL COLORS OF BINARY DIFFRACTION GRATINGS

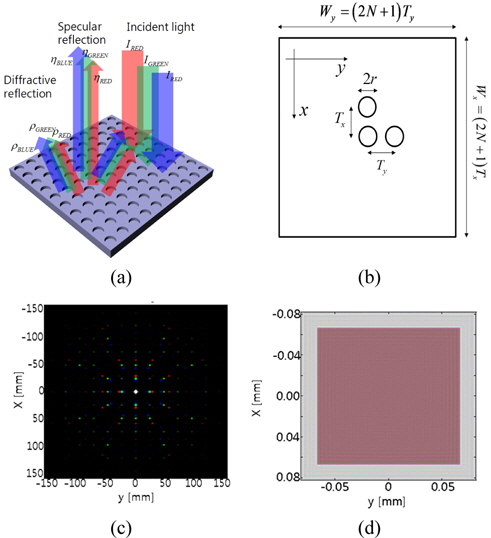
    In this section the specular structural color of binary gratings is mathematically modeled. Figure 1(a) shows a schematic of the specular structural-color mechanism. A white plane wave is incident on a periodic binary grating, which is of reflection type and has a unit cell of circular intaglio with depth t, radius r, an x-directional (y-directional) period Tx(Ty)r (see Fig. 1(b)). Specular reflection and diffraction waves are generated by the grating, and the substrate is assumed to be perfectly metallic for an arbitrary incidence angle of illuminating light. In Fig. 1(c), an exemplary diffraction pattern generated by a diffraction grating with chromatic dispersion is shown. Here the white plane wave is assumed to have three color components: Red (λ R = 638 nm), Green (λ G = 532 nm), and Blue (λ B = 450 nm). Assuming that the total energy of the incident light is equal to that of the reflected light, the energy of specular reflection is the difference between that of diffractive reflection and that of the incident wave. For each color component, the monochromatic diffraction efficiency is different; consequently we can obtain structural color in the specular reflection, as shown in Fig. 1(d), which is the grating-surface image observed by a perfect numerical camera that rejects diffractive reflection components. The representable colors in the specular reflection can be diverse, but are expected to be highly dependent on the structural parameters of the grating.

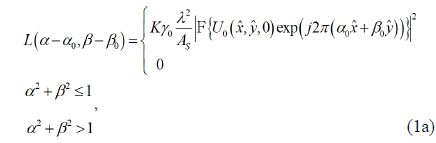
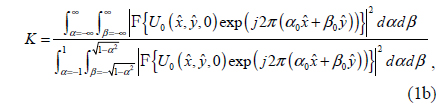
    In this paper, mainly the representation scope of the specular structural color of binary diffraction gratings is analyzed. To investigate this problem we develop a numerical model of specular structural color of a grating, based on nonparaxial scalar diffraction theory [11]. In scalar nonparaxial diffraction theory, the diffraction is supposed to be scalable with operating wavelength, which is seen in the use of the wavelength-normalized coordinate system in its theoretical framework. It is known that the fundamental quantity of nonparaxial diffraction is the renormalized diffracted radiance, defined as

    image

    where the coordinate pair (α , β ) is the directional cosine space defined on a far-field hemispherical surface, and α 0, β 0, and γ 0 are the x-, y- and z-directional spatial frequencies of an obliquely incident plane wave, AS is the illuminated area of the diffraction grating, and is the complex transmittance function of the grating. Physically, L(α , β ) is the brightness measured on a virtual far-field hemispherical surface. The angular spectrum components of the light field in the first regime α 2+β 2≤1 in Eq. (1) can propagate in free space, while a light wave in the second region α 2+β 2 > 1 is evanescent. Hence the diffracted radiance measurable in the far-field region is zero. To satisy energy conservation, the renormalization factor K is employed, being defined by the ratio of the total optical energy spread in the angular spectrum domain to the energy of the propagating modes localized in α 2+β 2≤1 :

    image

    where F represents a two-dimensional Fourier transform. Under the condition of the paraxial approximation, nonparaxial diffraction theory becomes equivalent to Fraunhofer diffraction theory in the far-field region around the optical axis. From a theoretical point of view, scalar nonparaxial diffraction theory can be considered as a relatively rough approximation of rigorous, vectorial electromagnetic diffraction theory. The scalar diffraction theory has limitations in explaining diffraction from subwavelength-scale features or polarization-sensitive structures. However, the diffraction from a two-dimensional periodic grating with circular unit pattern, as dealt with in this paper, is relatively immune to the polarization of the illumination light, and the iridescennt structural colors usually come from superwavelength-scale gratings, for which the scalar diffraction theory is appropriate. Therefore, nonparaxial scalar diffraction theory is appropriate for this study. Also, scalar diffraction theory is so efficient that it is useful for exploring the wide range of parameters studied in this paper.

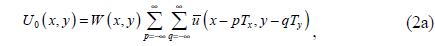
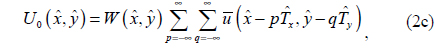
    The nonparaxial diffraction theory is applied to analyze the exemplary grating structure presented in Fig. 1(b). The complex optical-field distribution on the grating surface, U0(x, y), is represented as

    image

    where is the optical-field distribution on the unit cell of the periodic grating and W(x, y) is the finite-sized aperture function, given by

    image

    where Wx and Wy are set to integer multiples of the x- and y-directional grating periods respectively as Wx = (2N+1)Tx and Wy = (2N+1)Ty. Here, for simplicity, the oblique phase term is omitted without loss of generality, since the diffracted radiance is shift-invariant in the directional cosine space [11].

    In nonparaxial scalar diffraction theory, functions are usually described for spatial variables normalized by wavelength. Thus U0(x, y) and W(x, y) are rewritten in their variable-normalized forms, respectively, as

    image
    image

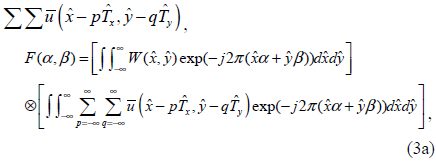
    where and are the wavelength-normalized terms Tx, Ty, Tx, and Wy respectively. The Fourier transform of in Eq. (1a), F(α, β), is obtained as the convolution of the Fourier transforms of and ,

    image

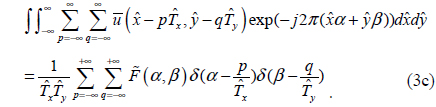
    where ⊗ is the symbol for the convolution operator. The first integral term in Eq. (3a) is solved as
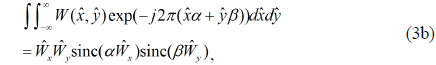
    image

    where sinc(x)=sin(π x)/π x. The second integral term in Eq. (3a) takes the form of periodization of

    image

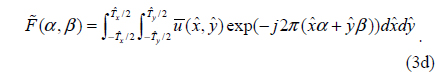
    where is the angular spectrum of the optical field for a single unit cell,
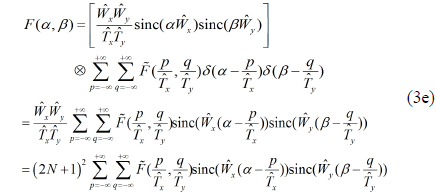
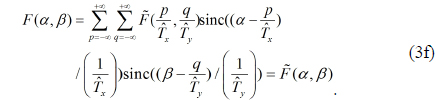
    image

    Therefore, F(α, β) is written as

    image

    In particular, when is equal to the grating includes only one unit element, so and Eq. (3e) reads equivalently as the Whittaker-Shannon interpolation formula of the band-limited signal,

    image

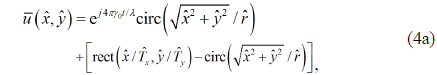
    More specifically, the specular structural colors of the exemplary circular intaglio grating schematically illustrated in Figs. 1(b) are analyzed. The optical field profile on a unit cell of the circular intaglio grating, , is represented by

    image

    where the exponential function e j4πγ 0t/λ expresses the round-trip phase delay of an oblique incident plane wave of wavelength λ and z-directional wave vector component γ 0 inside an intaglio pattern with thickness t. is the radius of the circular intaglio pattern. The second term of the sum in Eq. (4a) is the specular reflection on the flat metallic region.

    The main task in the analysis of Eq. (3e) is to calculate the angular spectrum function of Substituting Eq. (4a) into Eq. (3d), we obtain as
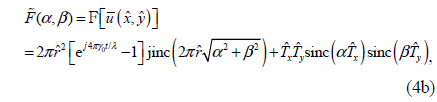
    image

    where jinc(x) is defined by jinc(x)=J1(x)/x with an equality of lim J1(x) being an order-1 Bessel function of the first kind. Substituting Eqs. (4b) and (3f) into Eq. (1a), we can obtain the nonparaxial diffracted radiance of the binary diffraction gratings.

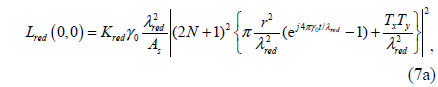
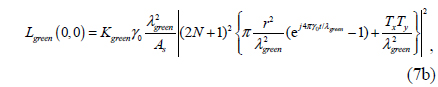
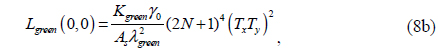
    As stated above, the structural color of a diffraction grating is perceived in the specular reflection, and is the zeroth-order diffracted radiance L(0,0) for incident white light waves of arbitrary incidence direction. In the CIE 1931 chromaticity diagram [12], a color is parametrized by three normalized numbers x, y, and z, which are defined in terms of diffracted radiance as

    image
    image
    image

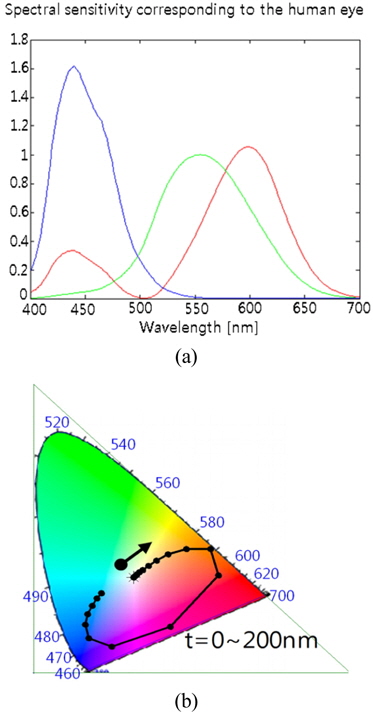
    where X, Y, and Z are the CIE XYZ tristimulus values for a color [12]. In particular, the tristimulus values for R, G, and B spectra are respectively defined as
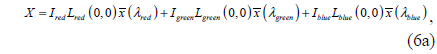
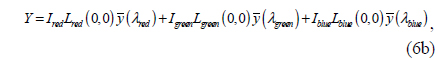
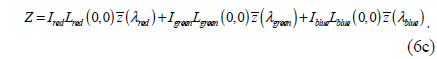
    image
    image
    image

    where (λ), (λ), and (λ) are the red, green, and blue color-matching functions for the CIE 1931 chromaticity diagram, plotted in Fig. 2(a). The color-matching function represents the spectral sensitivity of the three kinds of photoreceptors in the human eye. To evaluate the tristimulus values, we obtain the diffracted radiances of the specular reflection of R, G, and B wavelengths from Eqs. (1a) and (3e):

    image
    image
    image

    where Kred, Kgreen, and Kblue are the renormalization factors for R, G, and B wavelengths. In particular, for the case of flat metal with t = 0, without any surface relief profiles, the reflected color should be perfectly white. The partial diffracted radiances of R, G, and B wavelengths are obtained by setting t = 0 in Eqs. (8a)-(8c):

    image
    image
    image

    In the CIE 1931 chromaticity diagram, the standard white color has coordinates ( X,Y, Z) = (95.05,100.00,108.88) [12]. Substituting the coordinates of the white color into Eqs. (6a) and (6b), we can obtain spectral intensities Ired = 0.373, Kgreen = 0.176, and Iblue = 0.109, for which the specular reflection is standard white. It is assumed in the simulation that the incident white light has those spectral intensities. In Fig. 2(b) the trace of the specular structural color in the CIE 1931 chromaticity diagram is presented by varying the grating depth from t = 0 to t = 200 nm, where the black arrow indicates that the trace of the specular structural color follows a clockwise curve. Here the fill factor and grating period are set to 0.4 and T = 10 μm respectively. The initial color at the starting point of the trace is standard white. With increasing grating depth t, the structural color varies reddish from standard white, continues to pass through the regions of purple and blue, and finally arrives at a blue color inclined to white. The variation rate measured in terms of distance in the CIE 1931 chromaticity diagram of the structural color is nonlinear with change of t. As explained in Fig. 1(a), the diffraction efficiency of each wavelength depends on the structural parameters of the diffraction grating, such as grating depth, period, and fill factor, and as a result the composition ratio of the three colors in the specular reflection is sensitively varied with respect to the structural parameters, and we can observe drastic change in specular structural color from the grating, as shown in Fig. 2(b).

    III. REPRESENTATION RANGE OF SPECULAR STRUCTURAL COLORS

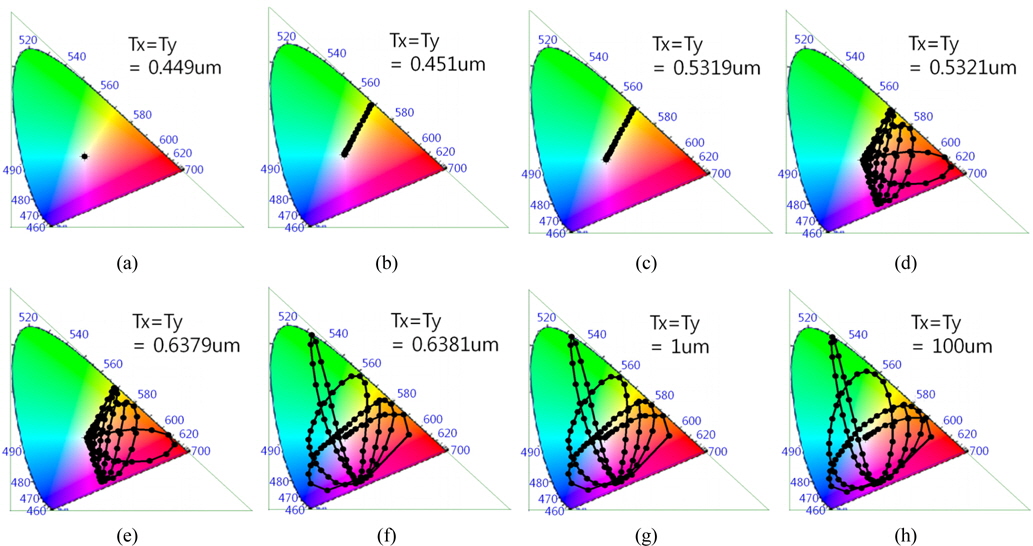
    Next the relationship between the specular structural colors and various structural parameters of binary diffraction gratings, such as grating period, fill factor, illumination angle, and grating depth, is investigated. The final objective of the analysis is to determine the represenation range of specular structural color in the CIE 1931 chromaticity diagram. The scope of the color representation lies inside the triangle defined by the three points indicating the wavelengths R (638 nm), G (532 nm), and B (450 nm) in the CIE 1931 diagram.

    First, depth-dependent traces of the specular structural color are calculated on the chromaticity diagram for various grating periods. The depth-dependent traces with distinct features are selectively collected in Fig. 3, in descending order of the magnitude of the period. In simulations the fill factor is set to 0.4, and the incidence angle of white light is assumed to be normal to the surface of the grating. For a period of 449 nm (Fig. 3(a)), since the period is at subwavelength scale for all three wavelengths λ R(638 nm), λ G (532 nm), and λ B (450 nm), specular reflection is dominant and the optical energy transfer from specular reflection to the diffraction field is negligible. Therefore the color of the specular reflection remains the same white as for the incident illumination, which is manifested in the CIE 1931 chromaticity diagram, as shown in Fig. 1(a). The structural white color is invariant with grating depth, until the grating period is tuned to be greater than λ B yet smaller than λ G. Then only the blue component begins to diffract, so the observed structural color shifts toward the yellow region in the chromaticity diagram, as shown in Figs. 3(b) and (c). The degree of yellowness is nonlinearly dependent on the grating depth, following Eq. 7(c). It is noteworthy that the color coordinate is on the line crossing the yellow region. As the period passes the second threshold λ G to diffract green light, but remains smaller than λ R, the color representation scope is drastically extended. The grating structural colors with period in the range λ GT < λ R represent strong reddish colors, which are sensitive to the depth of intaglio of the gratings. The depth-dependent color trace seems to be nonlinear in grating depth. For a period greater than the longest wavelength λ R, all three color components of light diffract to generate higher-order patterns. In Figs. 3(f), 3(g), and 3(h) the full range of structural colors of the specular reflection is plotted at T = 638 nm, T = 1 μm, and T = 100 μm respectively. The pure red, green, and blue colors can be produced by specified grating structures, and the depth-dependent traces with periods greater than T = 638 nm look similar, even with variations in the period. Here the fill factor is set to 0.4, but its variation could enable the scope of the color representation to cover the untouched regions in the CIE 1931 chromaticity diagram. In Fig. 4, under normal incidence of white light, the depth-dependent traces of the grating structural color for various fill factors and a fixed period of T = 10 μm are presented, and the influence of the fill factor on the color is analyzed. When the fill factor is equal to 0.2, the diffraction efficiency is relatively low for all three wavelengths simultaneously. By increasing the fill factor from 0.2 to 0.4, we observe that the diffraction efficiency increases along with the fill factor, and the scope of color representation in the chromaticity diagramis gradually extended. The extension of the color scope continues to increase until the fill factor reaches 0.4, where the scope is maximized. After this point, the response of the color scope to increasing fill factor changes from increasing to decreasing, as shown in Fig. 4(d). The more the fill factor is over the optimal value 0.4, the more the amount of diffraction and the color representation space are reduced.

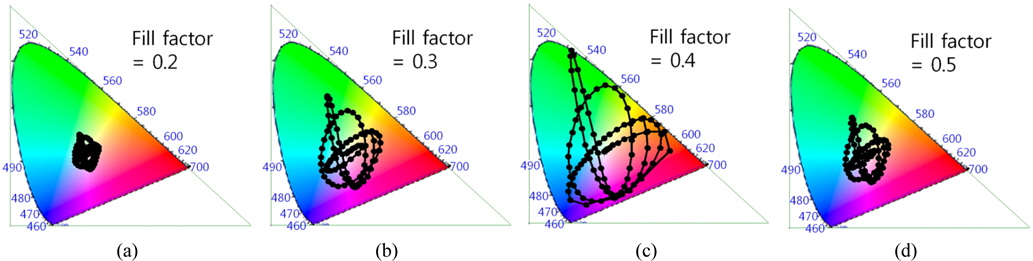
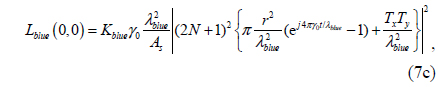
    An important note is that the color representation scope does not exactly reflect the diffraction efficiency of the grating, but it is determined by the relative ratio of the weighted R/G/B radiances. This problem has to be dealt with using numerical analysis, due to the complexity of the color-coordinate function. However, one insight is that the color representation scope tends to widen with increasing diffraction efficiency. From a simple analysis of Eqs. (7a)-(7c), we can see that the fill factor for maximum diffraction efficiency is 0.5. The condition for maximum color representation scope condition (fill factor 0.4) does not exactly match the condition for maximum diffraction (fill factor 0.5). The condition for maximum ratio maximum among R/G/B radiances can deviate from the condition for maximum diffraction efficiency. For example, a composite of maximally diffracted R/G/B components can produce a nearly white color, as proven in Fig. 4(d).

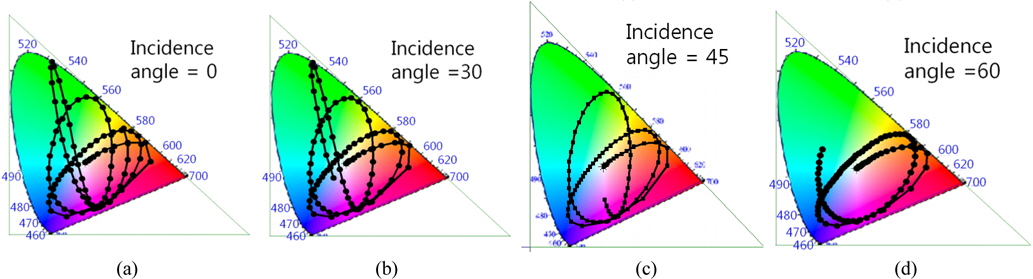
    In practice, the illumination angle is considered as a variable, while the structural parameters are fixed. Thus the illumination has to be considered as an environmental variable, and the natural degree of freedom for observation of grating structural color. In Fig. 5 we analyze the change in the structural color, where the grating fill factor and period are set to 0.4 and T = 10 μm respectively, and the illumination angle varies from 0 to 60 degrees. As seen in the simulation results, the specular structural color is affected more strongly by the incidence angle as the depth increases.

    IV. CONCLUSION

    The specular structural colors generated by two-dimensional reflection-type periodic binary metallic gratings have been investigated, based on the scalar nonparaxial diffraction theory. The possible color-representation ranges for structural colors in the standard CIE 1931 chromaticity diagram, and the various structural dependences of the structural colors, have been analyzed. We have found that the range of structural color is not strongly dependent on the pattern period, when the period is greater than the red wavelength, and becomes maximized for a fill factor of 0.4. For practical coloring applications, such as artistic surface decoration of consumer products, or color specular holography, the structural color needs to be insensitive to the incidence angle of illumination, which requires further research on multilayered grating structures; in the near future we will design practical, multilayered structural color gratings based on what has been discussed in this paper.

참고문헌
  • 1. Sabnis R. 1999 “Color filter technology for liquid crystal displays,” [Display] Vol.20 P.119-129 google cross ref
  • 2. Bjelkhagen H. I. 2006 “Color holography: Its history, state-of-the-art and future,” [Proc. SPIE] Vol.6252 P.62521U google
  • 3. Gentet Y., Gentet P. 2000 “Ultimate emulsion and its applications: a laboratory-made silver halide emulsion of optimized quality for monochromatic pulsed and full color holography,” [Proc. SPIE] Vol.4149 P.56-62 google
  • 4. Kanamori Y., Shimono M., Hane K. 2006 “Fabrication of Transmission color filters using silicon subwavelength gratings on quartz substrates,” [IEEE Photon. Technol. Lett.] Vol.18 P.2126-2128 google cross ref
  • 5. Catrysse P. B., Wandell B. A. 2003 “Integrated color pixels in 0.18-μm complementary metal oxide semiconductor technology,” [J. Opt. Soc. Am. A] Vol.20 P.2293-2306 google cross ref
  • 6. Diest K., Dionne J. A., Spain M., Atwater H. A. 2009 “Tunable color filters based on metal-insulator-metal resonators,” [Nano Lett.] Vol.9 P.2579-2583 google cross ref
  • 7. Laux E., Genet C., Skauli T., Ebbesen T. W. 2008 “Plasmonic photon sorters for spectral and polarimetric imaging,” [Nat. Photon.] Vol.2 P.161-164 google cross ref
  • 8. Xu T., Wu Y.-K., Luo X., Guo L. J. 2010 “Plasmonic nanoresonators for high-resolution colour filtering and spectral imaging,” [Nat. Commun.] Vol.1 P.59 google cross ref
  • 9. Kim H., Ge J., Kim J., Choi S.-E., Lee H., Lee H., Park W., Yin Y., Kwon S. 2009 “Structural colour printing using a magnetically tunable and lithographically fixable photonic crystal,” [Nat. Photon.] Vol.3 P.534-540 google cross ref
  • 10. Rowe D. G. 2009 “Tunable structural colour,” [Nat. Photon.] Vol.3 P.551-553 google cross ref
  • 11. Harvey J. E., Vernold C. L., Krywonos A., Thomson P. L. 1999 “Diffracted radiance: A fundamental quantity in nonparaxial scalar diffraction theory,” [Appl. Opt.] Vol.38 P.6469-6481 google cross ref
  • 12. Ebner M. 2007 Chapter 4.4 P.79 google
OAK XML 통계
이미지 / 테이블
  • [ FIG. 1. ]  Structural color in a diffraction grating: (a) mechanism, (b) circular intaglio grating, (c) chromatic diffraction pattern of a white plane wave composed of R, G, and B components, and (d) reddish structural color observed in specular reflection.
    Structural color in a diffraction grating: (a) mechanism, (b) circular intaglio grating, (c) chromatic diffraction pattern of a white plane wave composed of R, G, and B components, and (d) reddish structural color observed in specular reflection.
  • [ ] 
  • [ ] 
  • [ ] 
  • [ ] 
  • [ ] 
  • [ ] 
  • [ ] 
  • [ ] 
  • [ ] 
  • [ ] 
  • [ ] 
  • [ ] 
  • [ ] 
  • [ ] 
  • [ ] 
  • [ ] 
  • [ ] 
  • [ ] 
  • [ ] 
  • [ ] 
  • [ FIG. 2. ]  (a) Color matching functions (λ), (λ), and (λ). (b) Trace of the grating structural color for grating depth t varying from 0 nm to 200 nm, represented on the CIE chromaticity diagram.
    (a) Color matching functions  (λ),  (λ), and  (λ). (b) Trace of the grating structural color for grating depth t varying from 0 nm to 200 nm, represented on the CIE chromaticity diagram.
  • [ ] 
  • [ ] 
  • [ ] 
  • [ ] 
  • [ ] 
  • [ ] 
  • [ FIG. 3. ]  Depth-dependent structural color traces on the CIE 1931 chromaticity diagram for a fill factor of 0.4 and various grating periods (T): (a) 0.449 μm, (b) 0.451 μm, (c) 0.5319 μm, (d) 0.5321 μm , (e) 0.6379 μm, (f) 0.6381 μm, (g) 1 μm, and (h) 100 μm.
    Depth-dependent structural color traces on the CIE 1931 chromaticity diagram for a fill factor of 0.4 and various grating periods (T): (a) 0.449 μm, (b) 0.451 μm, (c) 0.5319 μm, (d) 0.5321 μm , (e) 0.6379 μm, (f) 0.6381 μm, (g) 1 μm, and (h) 100 μm.
  • [ FIG. 4. ]  Depth-dependent structural color traces on the CIE 1931 chromaticity diagram for grating period T = 10 μm and various fill factors: fill factor = (a) 0.2, (b) 0.3, (c) 0.4, and (d) 0.5.
    Depth-dependent structural color traces on the CIE 1931 chromaticity diagram for grating period T = 10 μm and various fill factors: fill factor = (a) 0.2, (b) 0.3, (c) 0.4, and (d) 0.5.
  • [ FIG. 5. ]  Depth-dependent structural color traces for a fill factor of 0.4 and various incidence angles (θ): (a) 0, (b) 30, (c) 45, and (d) 60 degrees.
    Depth-dependent structural color traces for a fill factor of 0.4 and various incidence angles (θ): (a) 0, (b) 30, (c) 45, and (d) 60 degrees.
(우)06579 서울시 서초구 반포대로 201(반포동)
Tel. 02-537-6389 | Fax. 02-590-0571 | 문의 : oak2014@korea.kr
Copyright(c) National Library of Korea. All rights reserved.