Langmuir monolayers, which are monomolecular films of amphiphilic organic molecules at an air/water interface, have been investigated very extensively as a planar model system having a rich phase-transition behavior, and also as a simple system mimicking biological membranes [1-4]. Among the important issues concerning Langmuir monolayer are the conformation of molecules in the monolayer and its phase-transition behavior, and many experimental techniques such as X-ray diffraction/reflectivity [5, 6], Brewster angle microscopy [7, 8], ellipsometry [6, 8-11], and infrared reflection-absorption spectroscopy [9] have been employed to address these issues in the Langmuir monolayer system. As one of these techniques, sum-frequency generation (SFG) spectroscopy has proven to be the most promising and feasible technique to investigate the molecular conformation of the system [10, 12, 13]
Based on the second-order nonlinear optical process which is not allowed in the system having inversion symmetry, SFG is a highly surface-sensitive probe to any light-accessible interface. It is also suitable to monitor the molecular conformation and structure because the sum-frequency response of each vibrational mode is an orientation average of specific moieties of the molecules in the system and changes sensitively with a subtle conformation change of the molecules [14]. For example, when long-chain molecules in the monolayer are neatly ordered, the directions of methylene (CH2) groups in each alkyl chain are oriented oppositely, to make the SF response from methylene groups cancel each other. Therefore, for a compact monolayer with molecules in all-
To better interpret the complex spectra, a two-dimensional (2D) correlation analysis approach has been employed in IR and Raman spectroscopies [15]. By employing the mathematical formalism based on an integral transformation, this technique can help to follow the spectral changes caused by external perturbations more clearly. 2D correlation analysis outputs two two-dimensional arrays, called 2D synchronous and asynchronous maps, respectively. These maps work to enhance the spectral resolution by spreading one-dimensional data to two-dimensional arrays, and have been utilized to analyze many kinds of spectroscopic data in the system undergoing changes by an external perturbation [15]. When this technique was first developed in 1986 to enhance an ability to interpret complex spectra, it could be applied only to a time-dependent sinusoidal perturbation [16]. In the early 1990s its mathematical formalism was generalized based on Fourier transformation of the data, and gained a widespread usage [15]. Nowadays, a more advanced formalism based on Hilbert transformation is widely employed for calculation because of its computational efficiency and simplicity [17]. To date, 2D correlation analysis has been utilized to analyze many kinds of one-dimensional (1D) spectroscopic data including electronic, IR, NMR, X-ray and Raman spectra, and was found useful for an in-depth study of spectral variations caused by external factors [18-24]. Recently, Hore and coworkers first suggested applying 2D correlation analysis to investigate the simulated sum-frequency spectra, and demonstrated that 2D correlation analysis can also be readily applied to the sum-frequency vibrational spectroscopy [25].
In this work, 2D correlation analysis was first applied to the experimental SFG spectra. Langmuir monolayers containing the equal-amount mixture of two different kinds of lipid molecules was investigated at several different moleculararea conditions by sum-frequency generation spectroscopy. The change in the 1D spectra indicative of the conformation change of the molecules in the monolayer were shown more clearly in the 2D correlation maps [26]. Closely-spaced spectral bands in the CHx range (spectral range corresponding to the stretch modes of the alkyl chains) could be easily distinguished in the 2D correlation spectra. Sequential order of the spectral evolutions also came into sight from the asynchronous 2D correlation map. Some spectral components in correlation maps were found out to be shifted from the original position, due to the interference effect in the coherent spectroscopy.
2.1. Sum-Frequency Vibrational Spectroscopy
A typical sum-frequency setup has two inputs of visible and IR beams, having frequencies of

Here
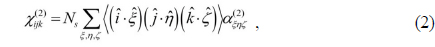
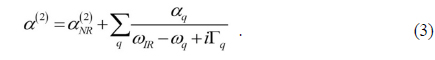
Here
From Eq. (2), SFG spectroscopy is especially useful to study subtle conformation changes in Langmuir monolayer system, which is a distinguishing feature as compared to the other probes like infrared absorption or Raman spectroscopy. If the chain has all-
2.2. Two-dimensional Correlation Analysis
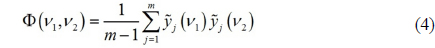
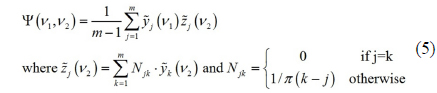
Two-dimensional correlation analysis shows the spectral variation caused by an external perturbation as a pair of two-dimensional arrays, each of them called 2D synchronous and asynchronous spectrum of the system. Typical two-dimensional analysis approach follows several calculation steps. In this work, we only sketch the formalism based on Hilbert transformation. First, from a set of

where index
Interpretation of these two-dimensional correlation spectra follows Noda’s rule, named after Noda who first invented this mathematical formalism [27]. A peak in a synchronous 2D spectrum represents the frequency bands whose intensities vary in phase. Since every peak varies in phase with itself, a 2D synchronous spectrum always shows diagonal peaks. And there can be also off-diagonal peaks called cross peaks. If there is a positive cross-peak at (
As these 2D spectra are derived from a series of 1D spectra, these maps can determine the peak positions more accurately when two or more spectral modes are close together and cannot be resolved easily. It can also distinguish the processes that look very similar with the conventional 1D spectra. The case of (1) pure peak shift of single band, and (2) two overlapped peaks change in intensities under external perturbation sometimes cannot be distinguished easily in the 1D spectra. Dluhy and coworkers compared these two cases in IR absorption spectroscopy with 2D correlation analysis, and reported that a 2D asynchronous spectrum shows totally different appearance in the two cases. The former (‘frequency shifting’ model) shows a quartet of cross peaks, and the latter (‘overlapped peaks’ model) shows a doublet of cross peaks which is clearly different from the former one [28].
III. EXPERIMENTAL SECTION & DATA TREATMENT
The 1,2-dipalmitoyl-3-trimethylammonium-propane (16:0 TAP or DPTAP) and 1,2-dimyristoyl-
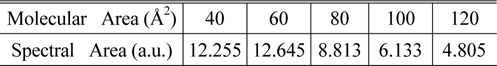
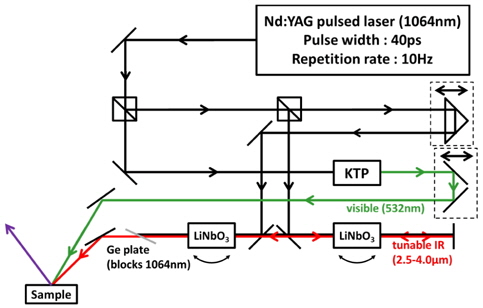
The SFG measurement was conducted with a picosecond Nd:YAG pulsed laser (Continuum PY61-10, 40ps pulse width, 10 Hz repetition rate) and a LiNbO3-based optical parametric generator/amplifier (OPG/OPA) system pumped by this laser. The OPG/OPA system provided the tunable IR input ranging from 2.5 μm to 4.0 μm in wavelength, and the second-harmonic of the laser from potassium titanyl phosphate (KTP) crystal produced the visible input (532 nm). Typical input energies were 1 mJ/pulse for visible and ~200 μJ/pulse for tunable IR. Their incident angles were βvis = 45° and βIR = 60°, respectively. These two beams were overlapped on the sample surface within the beam diameter of ~200 μm. The SF output in the reflection direction was spatially and spectrally filtered and detected by a photomultiplier tube. The spectra were taken at typically 5 cm-1 intervals and each data point was an average of signals accumulated over at least 200 laser shots. The spectra were normalized against the SF spectrum from a z-cut quartz sample used as a reference. Input/output polarization combination of SSP (S-polarized SF output, S-polarized visible input and P-polarized IR input) was employed. 1D spectra were smoothed by averaging 3 adjacent data points as needed. Spectra were also normalized by dividing each spectrum with corresponding spectral area, as tabulated in Table 1. The array of the 1D spectra after normalization were treated with a lab-made MATLAB program for 2D correlation calculation, based on the generalized 2D correlation approach developed and modified by I. Noda.
[TABLE 1.] Normalization factor for each spectrum

Normalization factor for each spectrum
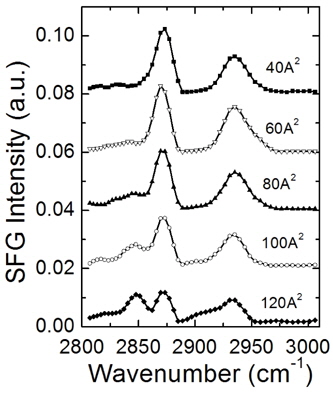
The SFG spectra of 1:1 mixture of DPTAP and DMPG Langmuir monolayers on water for five different surface areas, normalized by the total area under each spectrum, are plotted in Fig. 2. Here the monolayers with specific surface areas were prepared by compression of the monolayers with trough barrier, and regulated with an assistance of the pressure-area isotherm measured before [26]. Spectra show a gradual increase in CH2 symmetric stretch mode (~2853 cm-1) and decrease in CH3 symmetric stretch mode (~2875 cm-1) with an increase in the surface area, which implies a conformation change of monolayer from the condensed phase to the liquid phase. It would also cause the intensity changes in CH2 asymmetric, CH3 asymmetric stretch modes, and CH3 Fermi resonance mode (around 2919 cm-1, 2959 cm-1 and 2936 cm-1, respectively), which can be hardly discriminated in the spectra because of their overlapping within narrow frequency band.
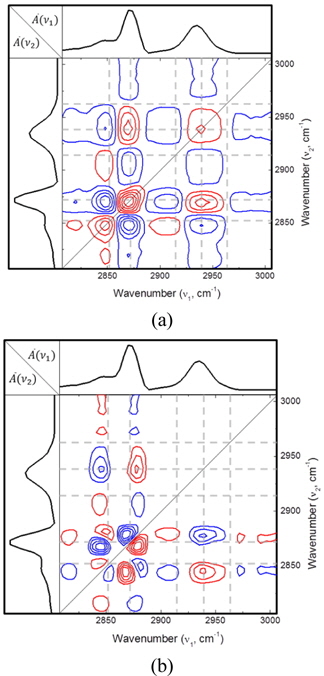
For a better discrimination of these features, two-dimensional correlation analysis was conducted on the spectra. Figure 3 shows a contour plot of 2D synchronous map (a) and a 2D asynchronous map (b) for the SF spectra normalized with spectral area shown in Fig. 2. In the synchronous map, a negative peak at (2870 cm-1, 2848 cm-1) indicates an anti-correlation between CH2 and CH3 symmetric stretch modes clearly, which agrees with one-dimensional spectral analysis. Two-dimensional correlation spectrum analysis shows its superiority in characterizing the closely-spaced spectral modes in the region ranging from 2900 cm-1 to 2960 cm-1. Here one-dimensional analysis fails to distinguish different spectral components, whereas 2D synchronous map clearly shows the distinct negative and positive peaks. Negative peak at (2870 cm-1, 2910 cm-1) implies the existence of a spectral component located around 2910 cm-1 negatively correlated with CH3 stretch mode at 2870 cm-1. This feature can be accounted for as the appearance of CH2 asymmetric stretch mode with an increased disorder in the alkyl chain. 2D synchronous map also shows a positive maximum at (2870 cm-1, 2940 cm-1), suggesting the spectral feature positively correlated with CH3 symmetric stretch mode at 2870 cm-1. The peak is due to a decrease of CH3 Fermi resonance mode (~2936 cm-1) simultaneous with a decrease of CH3 symmetric stretch mode as the molecular area increases. In the asynchronous spectrum in Fig. 3(b), the most prominent are the negative peaks located at (2870 cm-1, 2850 cm-1) and (2940 cm-1, 2850 cm-1). These asynchronous cross peaks indicate a different rate of change of these bands, and we deduce that the spectral change for CH2 mode (~2850 cm-1) took place earlier than CH3 modes at 2870 cm-1 and 2940 cm-1.
One more thing to remark is that the locations of 2D spectral components are slightly shifted with respect to the conventional peak positions [14]. For example, in the synchronous map, the cross peak of CH2 symmetric stretch mode (conventionally about 2853 cm-1) and CH3 symmetric stretch mode (~2875 cm-1) is located at (2848 cm-1, 2870 cm-1), a few wavenumbers shifted from the original position. These kinds of spectral shifts also take place in the asynchronous map. These phenomena are considered as an artifact due to the intrinsic nature of the SFG spectroscopy. In conventional spectroscopy such as Raman, fluorescence, and IR absorption, the signals contributing to the spectral band (e.g. resonant signal and non-resonant background) are added incoherently as a spectral intensity. But in the sum-frequency generation spectroscopy, the signals contributing to a certain spectral feature are first added as electric fields. The field thus summed-up is squared to yield the SFG spectrum we measure experimentally, and the interference between spectral components can be seen in the spectrum when band-overlap or nonresonant contribution is significant. Recently S. Roy and coworkers reported that a spectral shift can be seen as an artifact when 2D correlation analysis is applied to the coherent spectroscopy [25]. To avoid this artifact, in the future study one can apply 2D correlation analysis to 1D imaginary spectra, which can be either deduced by fitting the spectrum with a multi-peak Lorentzian or measured with heterodyne SFG experiments [29].
Langmuir monolayers consisting 1:1 mixture of DPTAP and DMPG at different area/molecule were investigated with sum-frequency vibrational spectroscopy, and these spectra were further analyzed by using two-dimensional correlation spectroscopy. 2D correlation maps were able to better resolve closely-spaced spectral components, for example CH2 asymmetric stretch mode and CH3 Fermi resonance mode of the spectra. The 2D asynchronous map indicated the order of spectral evolution that the change in the CH2 mode precedes the change in the CH3 mode. Due to the interference between the bands in the SF spectra, spectral features in the correlation maps are found to be shifted from their originally assigned locations, which indicate that the care needs to be taken in analyzing the coherent 1D spectra by using the 2D correlation method.