In this paper, we present an economical and practical standard to install a bypass diode in a thin-film PV module. This method helps to reduce heat generation and to prevent module degradation due to excess current from reverse bias. The experimental results confirm that for different numbers of solar cells, there is a relation between the excess reverse current and the degradation of solar cells in a-Si:H modules. The optimal number of solar cells that can be connected per bypass diode could be obtained through an analysis of the results to effectively suppress the degradation and to reduce the heat generated by the module. This technique could be expanded for use in high power crystalline Si PV modules.
The reverse bias due to the mismatched behavior or partial shadowing of solar cells in a module generates hot spots in the cells, and such excessive temperatures in the hot spots melt the encapsulation materials, such as EVA, and the back sheet. As a result, the performance characteristics of the module are degraded [1-3].
Therefore, module safety and reliability are heavily dependent on the durability of the module against the temperatures of a hot spot.
Researchers have suggested that the reverse excess current flowing through a low-power solar cell plays a key role in generating heat at a hot spot in the module [4-6], and mathematical models of the reverse excess current in relation to a hot spot have been developed to predict the electrical output of a reversebiased solar cell [7,8]. The shunt resistance, which affects the reverse excess current of the solar cell, was empirically examined in order to confirm the relationship between a hot spot and the reverse excess current [9-11]. The shunt resistance of a single reverse-biased solar cell was analyzed to limit the reverse excess current that flows through the solar cell, including that through the hot spot [12]. Recently, an improved maximum power point tracking method was developed to suppress the damage to the module due to the appearance of a hot spot [13]. The reverse excess current can be generally limited by connecting a bypass diode in parallel with the solar cells to avoid irreversible damage of a commercial module due to a hot spot [5]. A partially reversebiased module with and without an operating bypass diode was tested in order to predict the output, the surface temperature distribution, and the hot spots in the solar cells [9,14,15]. Therefore, the installation conditions for a bypass diode were extensively studied with respect to the performance factors of the module, such as the number of solar cells connected, the shading ratio, and the number of shaded solar cells, in an effort to reduce the heat generated by the hot spot as well as the power dissipated there [12,16].
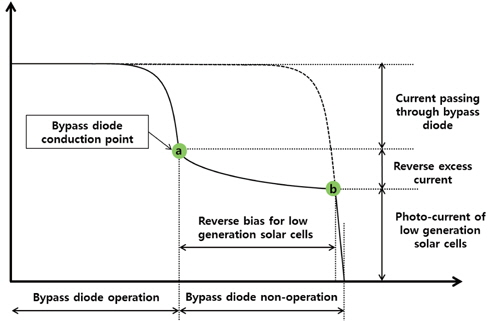
The typical I-V curve for a PV module with a bypass diode is analyzed under partially different generation conditions, as shown in Fig. 1. Although the PV module is connected with a bypass diode, the low-performance solar cells are reverse-biased between points (a) and (b) when the bypass diode is turned off, and the reverse excess current generates heat and degrades the solar cells through which it flows. Therefore, the reverse excess current has to be reduced in order to alleviate the problems resulting from the mismatched generation in the module. However, the reverse excess current is influenced in a complex manner by the characteristics of the solar cells, such as the breakdown voltage, the number of solar cells bridged per bypass diode, or the number of solar cells generating a low amount of power. The optimal installation conditions for a bypass diode are difficult to determine in order to prevent heat generation and degradation of solar cells in a module.
In this study, the installation conditions for a bypass diode are investigated, such as the number of solar cells per bypass diode, in order to reduce the heat generated as a result of the reverse excess current and to prevent the degradation of the solar cells in a module. a-Si:H PV modules with a high output voltage and a low breakdown voltage for each solar cell are used to apply the results obtained for all types of thin film modules. Experiments were conducted to determine the amount of reverse excess current that passes through the low-grade solar cells in the modules with a bypass diode. First, we confirm that the extent to which the solar cells are degraded depends on the level of reverse excess current from the DC power supply. Second, the I-V curves for the partially shaded modules with different numbers of solar cells are measured with bypass diode conduction, and the reverse excess currents are calculated on the basis of the data that was obtained. The modules that are similarly shaded in order to pass equal amounts of reverse excess current through the shaded solar cells are exposed to light for 30 min, and the output of the shaded solar cells is measured. The results are compared against the data measured of the solar cells degradation that had been obtained from the DC power supply, and the relation between the reverse excess current and the solar cell degradation is confirmed. Finally, the economical and practical installation conditions for bypass diodes in a module is proposed in order to reduce the degradation and to limit the heat generated by the low power generating solar cells in the module.
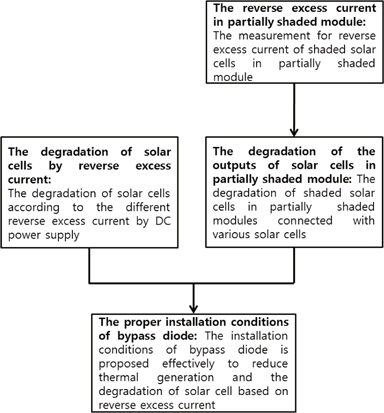
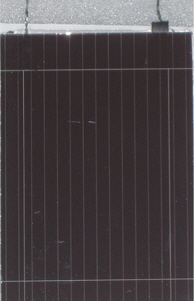
100 mm × 100 mm a-Si:H PV modules with ten solar cells inside were manufactured in order to easily control the total number of solar cells as the mini-modules are connected in series, as shown in Fig. 2. A paper-type tape is used to effectively protect the designated parts of the PV module from exposure to light, and the I-V curves of the partially shaded PV modules are measured by using a PV module simulator that includes a Xenon light source with a pulse duration of up to 100 ms. The experimental procedures are shown in Fig. 3.
2.1 Degradation of the a-Si:H PV module by the reverse excess current
The difference between the low and the high generation current of the solar cells in the module, excluding the generation current, could be the maximum reverse excess current passing through the low-generation solar cell. The current produces a hot spot that deteriorates the low-power generating solar cells. We assume that the high current generated in the solar cell in the module is the same as the short-circuit current through each module exposed to light with an intensity of 1 KW/m2.
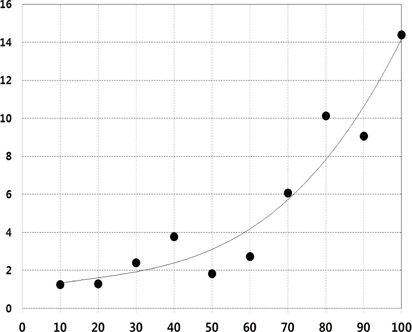
In this experiment, the equivalent current generated from the DC power supply passes through the solar cells in a mini-module, which is partially shaded for 30 min to control the reverse excess current through each module. Figure 4 shows the decrease in the rate of the maximum output power for each mini module after the experiments. The maximum power for a module is suddenly diminished with a shading rate of more than 60% for the entire area of one solar cell. On the other hand, the decrease in the rate of the maximum output for each module is uniformly distributed within the 60% shading rate. The trend line for the measured data can be expressed as a cubic function. The results in Fig. 4 indicate that the deterioration in the performance of these solar cells of approximately 15% is caused by the mismatch in the current after installation. . When a reverse excess current that is less than half the short circuit current of a solar cell flows through the low-current generating solar cells, the output of the solar cells is reduced to approximately 4%.
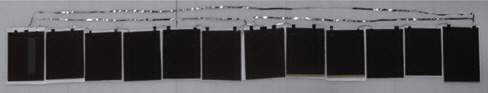
The experiments were conducted to verify the amount of reverse excess current that flows through the low-power generating solar cells in a module with a different number of solar cells during bypass diode operation. All of the modules serially connected, and some of the 100 mm × 100 mm a-Si:H PV modules are fabricated to easily control the number of the connected solar cells according to a module that includes many external connectors. All of the modules are serially connected with 24, 28, 32, and 36 solar cells installed with two bypass diodes, as shown in Fig. 5.
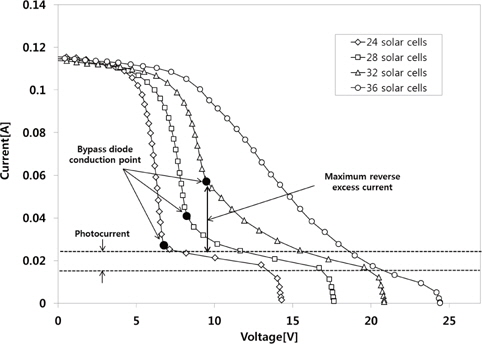
Figure 6 shows the I-V curves of perfectly shaded modules for one solar cell in an individual module. However, the photocurrent for the shaded solar cells is in the range of 0.025 A to 0.015 due to the optical reflection from the others, as also shown in Fig. 6. The bypass diodes begin to conduct from the A, B, and C points due to the increase in the reverse bias that is applied to the shaded solar cells. However, we assume that the bypass diode in the module with 36 solar cells does not operate because the shaded solar cells are applied with a higher-than-breakdown voltage for a solar cell of 11 V, which results in an avalanche phenomenon. Therefore, the entire reverse excess current in the module flows through the shaded solar cells. The maximum reverse excess current flowing through the shaded solar cells is calculated as the difference between the photocurrent of the shaded solar cell and the current at the bypass diode conduction point.
Table 1 summarizes the maximum reverse excess current according to an increase in the number of solar cells connected in a module. In the module with fewer than 32 solar cells, the current flowing through the shaded solar cells gradually increases as the number of connected solar cells increases. In the module with 36 solar cells, however, the ratio of the maximum reverse excess current to the short circuit current increases by more than 80%, and Fig. 4 indicates that the performance of the shaded solar cells may be drastically reduced.
[Table 1.] Bypass diode conduction point and maximum reverse excess current based on Fig. 6.
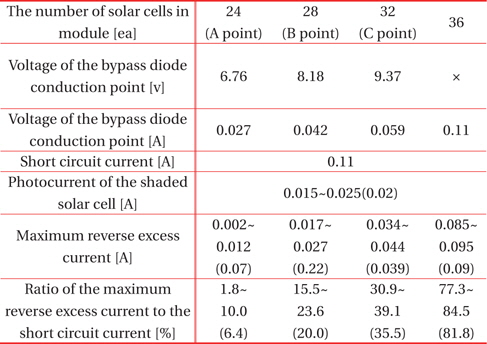
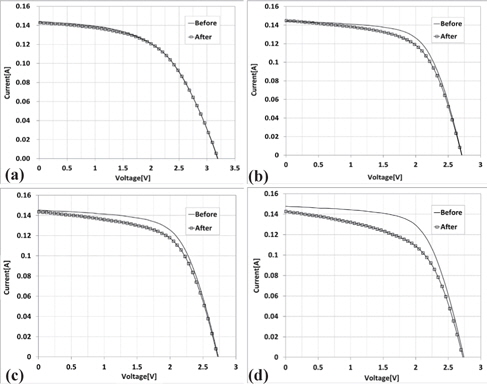
Bypass diode conduction point and maximum reverse excess current based on Fig. 6.
Four a-Si:H PV modules were fabricated with a specific number of solar cells, including 72, 84, 96, and 108 solar cells, which is three times that used to confirm the maximum reverse excess current in Table 1. Each module was installed with two bypass diodes, and the experiments were conducted in order to confirm the relationship between the degradation of the modules and the heat generated in the shaded solar cells as a result of the equal maximum reverse excess current (as also summarized in Table 1). Therefore, three solar cells in each module are shaded at 82% of the entire area of the solar cells in order to match the average photocurrent of the shaded solar cell (Fig. 6). All of the modules were exposed for 30 min to high irradiance at 1 KW/ m2 under standard testing conditions (STCs). Figure 7 shows the I-V curves of the shaded solar cells before and after each module was exposed to light. The electrical performance of these solar cells dramatically deteriorates with any number of solar cells in the module, despite the operation of the bypass diode. The maximum power of the shaded solar cells in the module with 108 solar cells is noticeably reduced to 14.4%. However, the solar cells in the modules with 84 and 96 solar cells are similarly degraded to within 5%. In the case of the module with 72 solar cells, the I-V curves do not change.
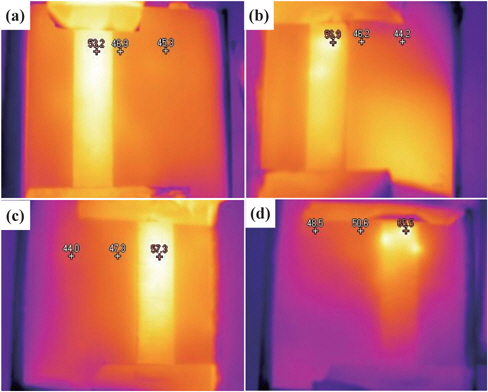
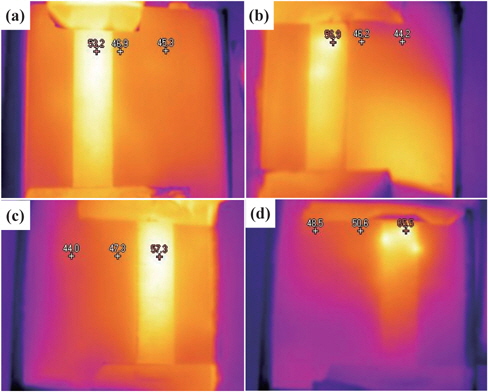
Figure 8 shows the distribution of the surface temperature of the partially shaded solar cells by means of thermal IR camera, while each module is exposed to light. A significant hot spot appears in the module with 108 solar cells, with a maximum temperature of 65.5℃. However, the modules with fewer than 96 solar cells do not generate hot spots, despite of the increase in the temperature on the surface of the shaded solar cells. The difference in the maximum temperatures of two modules with 96 and 108 solar cells is of 8.2℃. On the other hand, the temperature between the other pairs of modules (84 and 96 solar cells, or 72 and 84 solar cells) is of less than 3.7℃.
Five experiments were repeatedly conducted under the same conditions in order to reduce the errors resulting from the diverse characteristics of the modules. The averaged data are compared against the results of the degradation in the mini modules caused by reverse excess current generated from the DC power supply, as shown in Fig. 4. The ratio of the average maximum reverse excess current to the short-circuit current flowing through the shaded solar cells of the module with 72 solar cells is calculated to be of approximately 6.4%, as shown in Table 1. We assume that the degradation in these solar cells is the same as the results for the solar cells with a shading rate between zero and 10%, as shown in Fig. 4. In the case of a module with 84 solar cells (as summarized in Table 1) the ratio of the maximum reverse excess current is 20% that of the short circuit current, and the degradation in the shaded solar cells of the module is calculated from Fig. 4 to be of approximately 3%. The degradation in the modules with 96 and 108 solar cells are calculated to be of 15.2% and 3.1%, respectively.
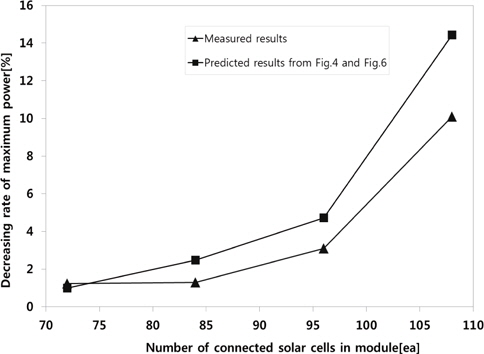
Figure 9 describes the degradation ratio measured for the shaded solar cells in the modules connected with different numbers of solar cells, as well as the predicted degradation for the shaded solar cells (from the data in Figs. 4 and 6). The slope of the two curves for the modules with less than 96 solar cells gradually increases. However, the slope dramatically increases for the modules with more than 96 solar cells. The difference in the two results is attributed to the use of the ribbon to electrically connect the mini module, as shown in Fig. 5, which limits the reverse excess current.
Although the heat generated and the degradation ratio of the shaded solar cells could be significantly reduced by decreasing the number of solar cells per bypass diode, as shown in Figs. 8 and 9, a higher number of bypass diodes in a module leads to additional production costs for the module rather than alleviating the problems due to the reverse excess current. On the other hand, a module installed with fewer bypass diodes fails to protect the module or the solar cells from the reverse excess current. Therefore, it is very difficult to decide on the number of bypass diodes that should be installed in a module. The relationship between the degradation and the reverse excess current could be elucidated by comparing the experimental results against the data obtained from two procedures: the degradation ratio of the solar cells (shown in Fig. 4) and the reverse excess current calculated from the I-V curves of the partially shaded modules (as summarized in Table 1). These results suggest that this a-Si:H PV module with 96 solar cells bridged with two bypass diodes is the most appropriate with respect to its efficacy and the installation costs of the bypass diodes. Also, two experimental methods were proposed to find the optimal conditions for the installation of the bypass diode.
An increase in the reverse excess current, excluding the generation current, flowing through the low-power generation solar cells in a module leads to an increase in the surface temperature and the subsequent degradation in the solar cells. The bypass diode alleviates many problems caused by the reverse excess current. However, an economical and practical installation standard for a bypass diode, which can reduce the heat generated in hot spots and can also limit the reverse excess current, has not yet been established. In this study, we have assumed that low-power generation solar cells in a module are severely damaged by the reverse excess current, which is a key problem in real power stations, and bypass diodes were installed in the module to limit the current. The relationship between the degradation of solar cells and the reverse excess current was confirmed by comparing the measurements of shaded solar cells degraded under continuous exposure to light with the data predicted for the degradation of a mini-module obtained from DC power supply and the I-V curve measurements of a partially shaded module. The optimal number of solar cells per bypass diode is proposed to effectively reduce heat generated in, and the subsequent degradation of, low-power generation solar cells in a module. These experimental results and methods could be very useful for the design of crystalline Si-based and thin-film PV modules with high output voltages.